-
-
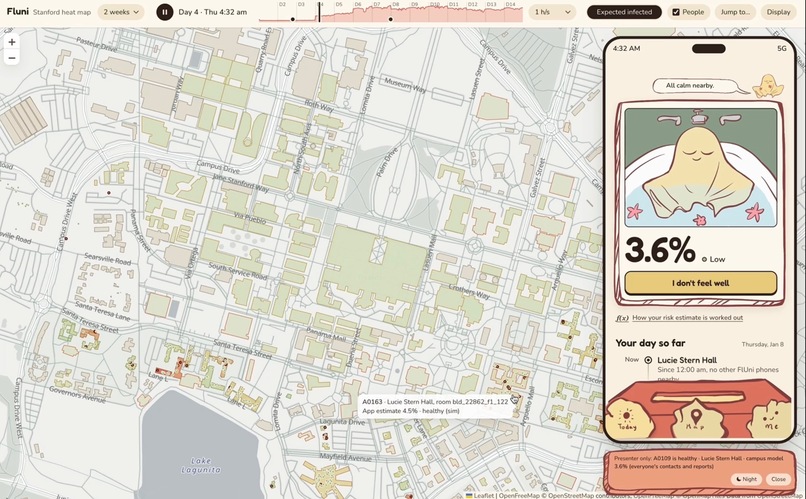
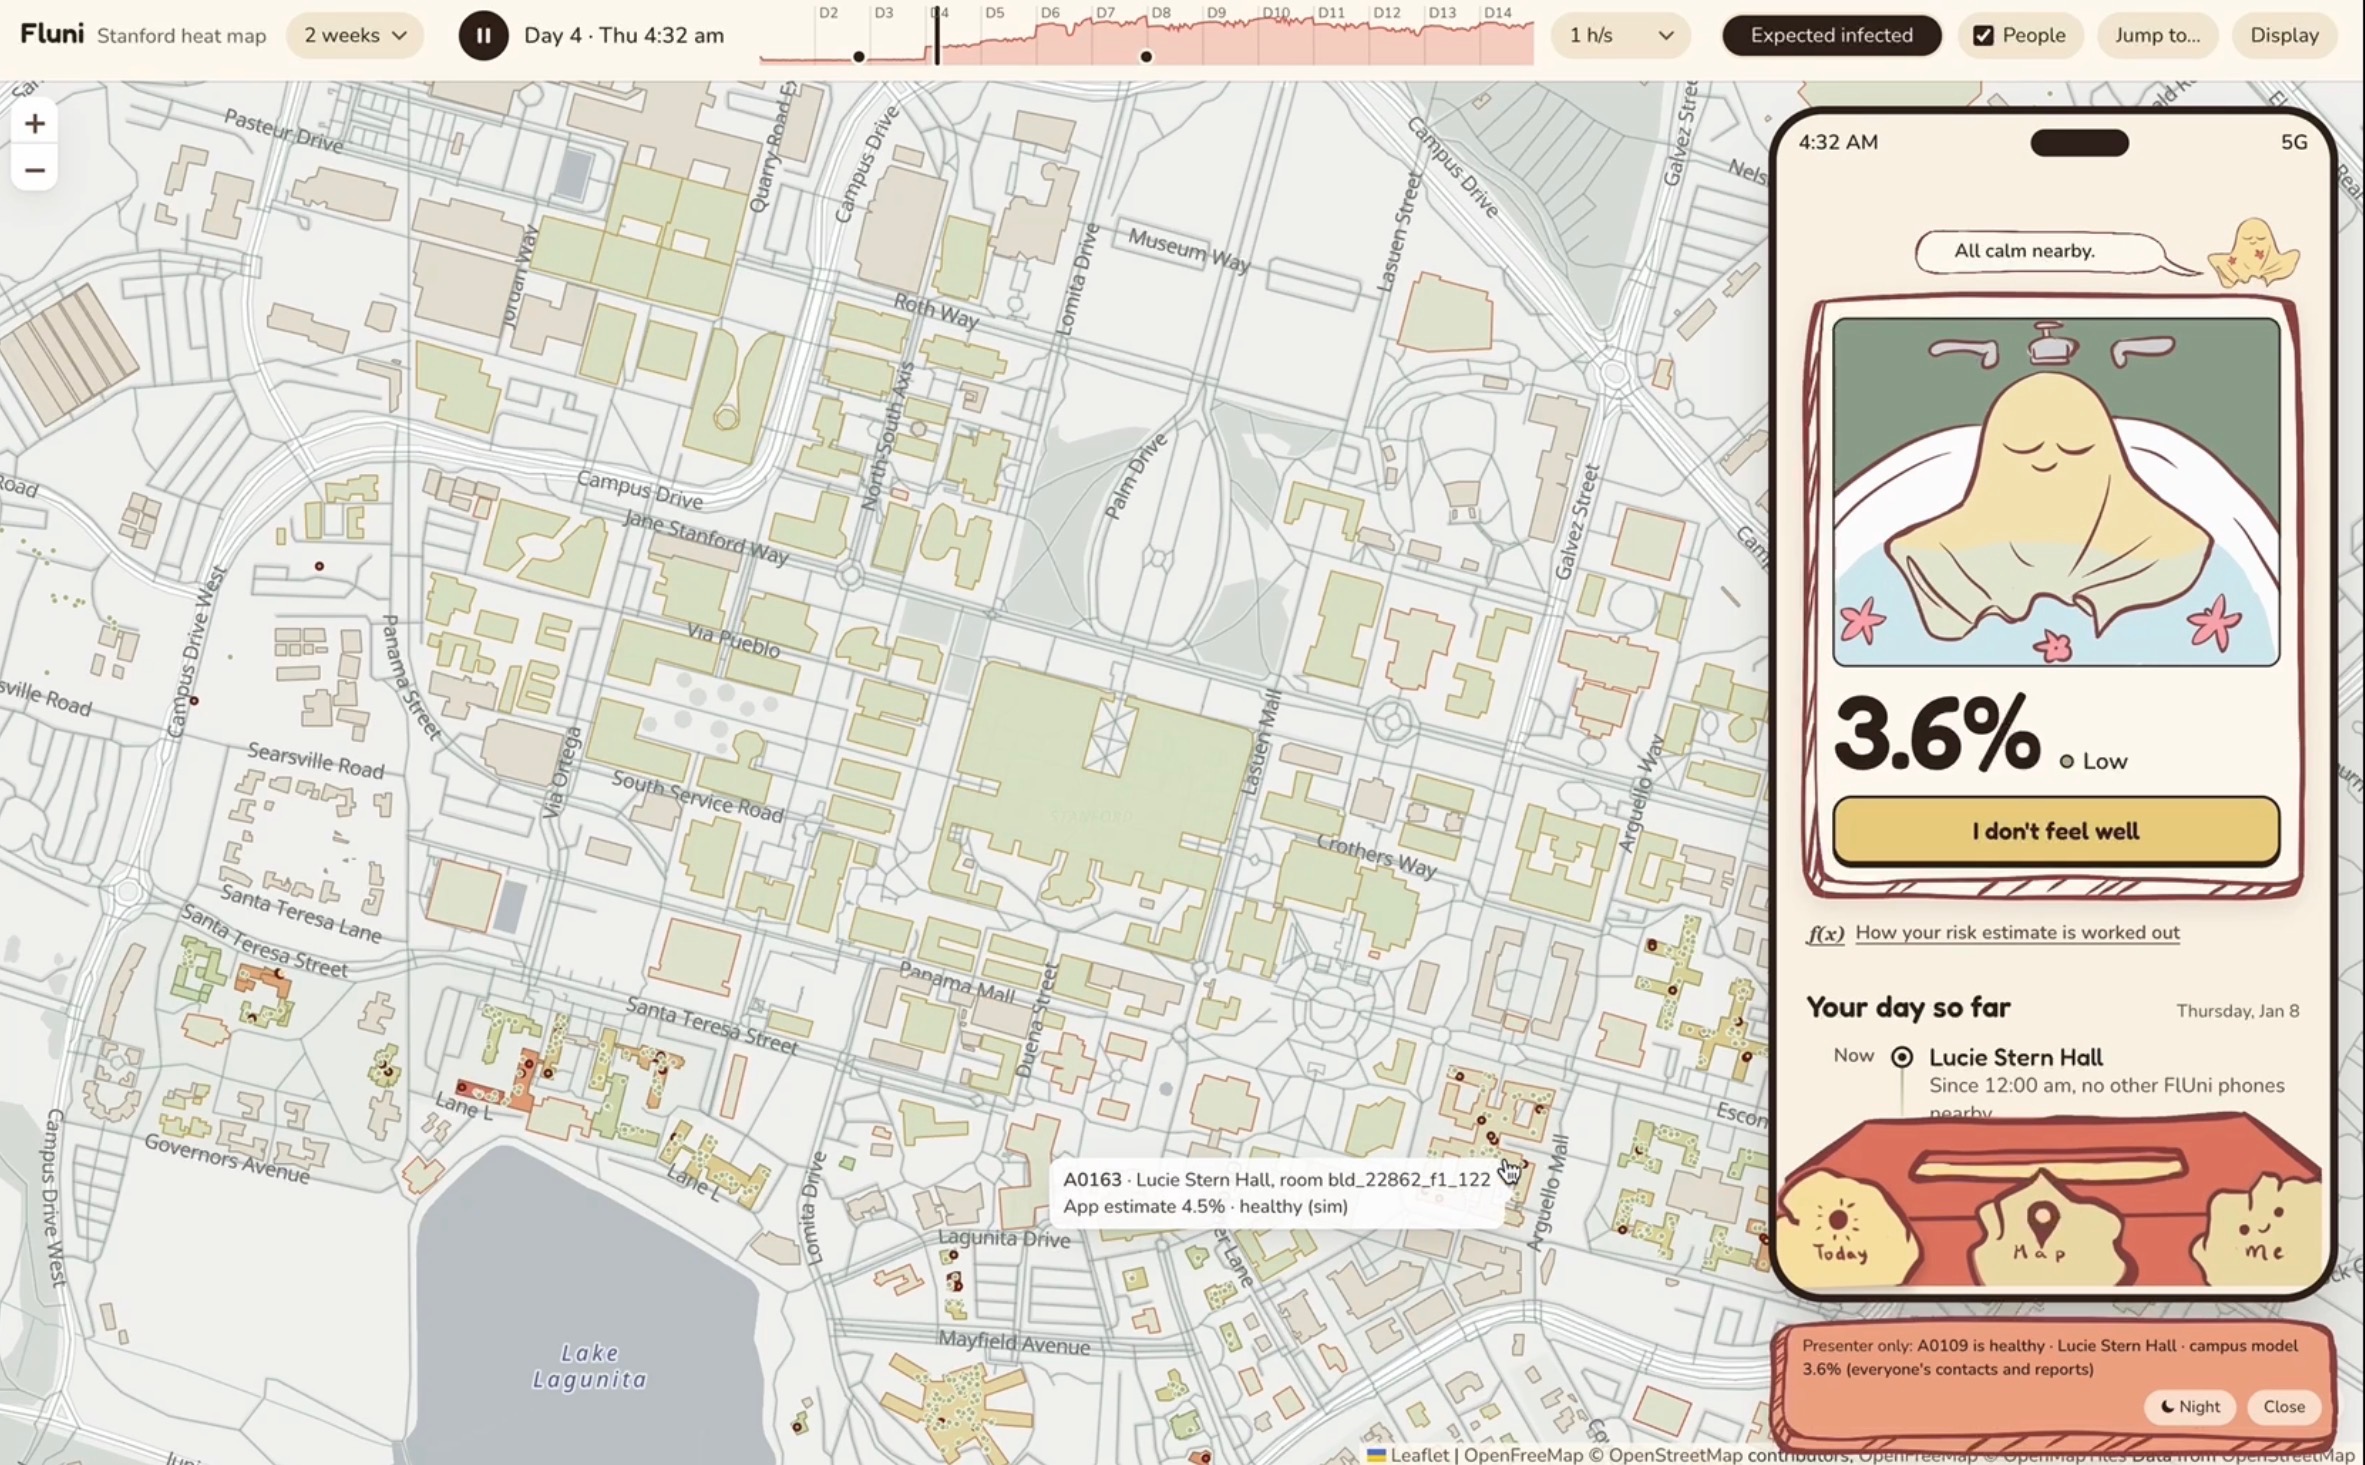
Heat map + User view of one agent (well)
-
Loading screen
-
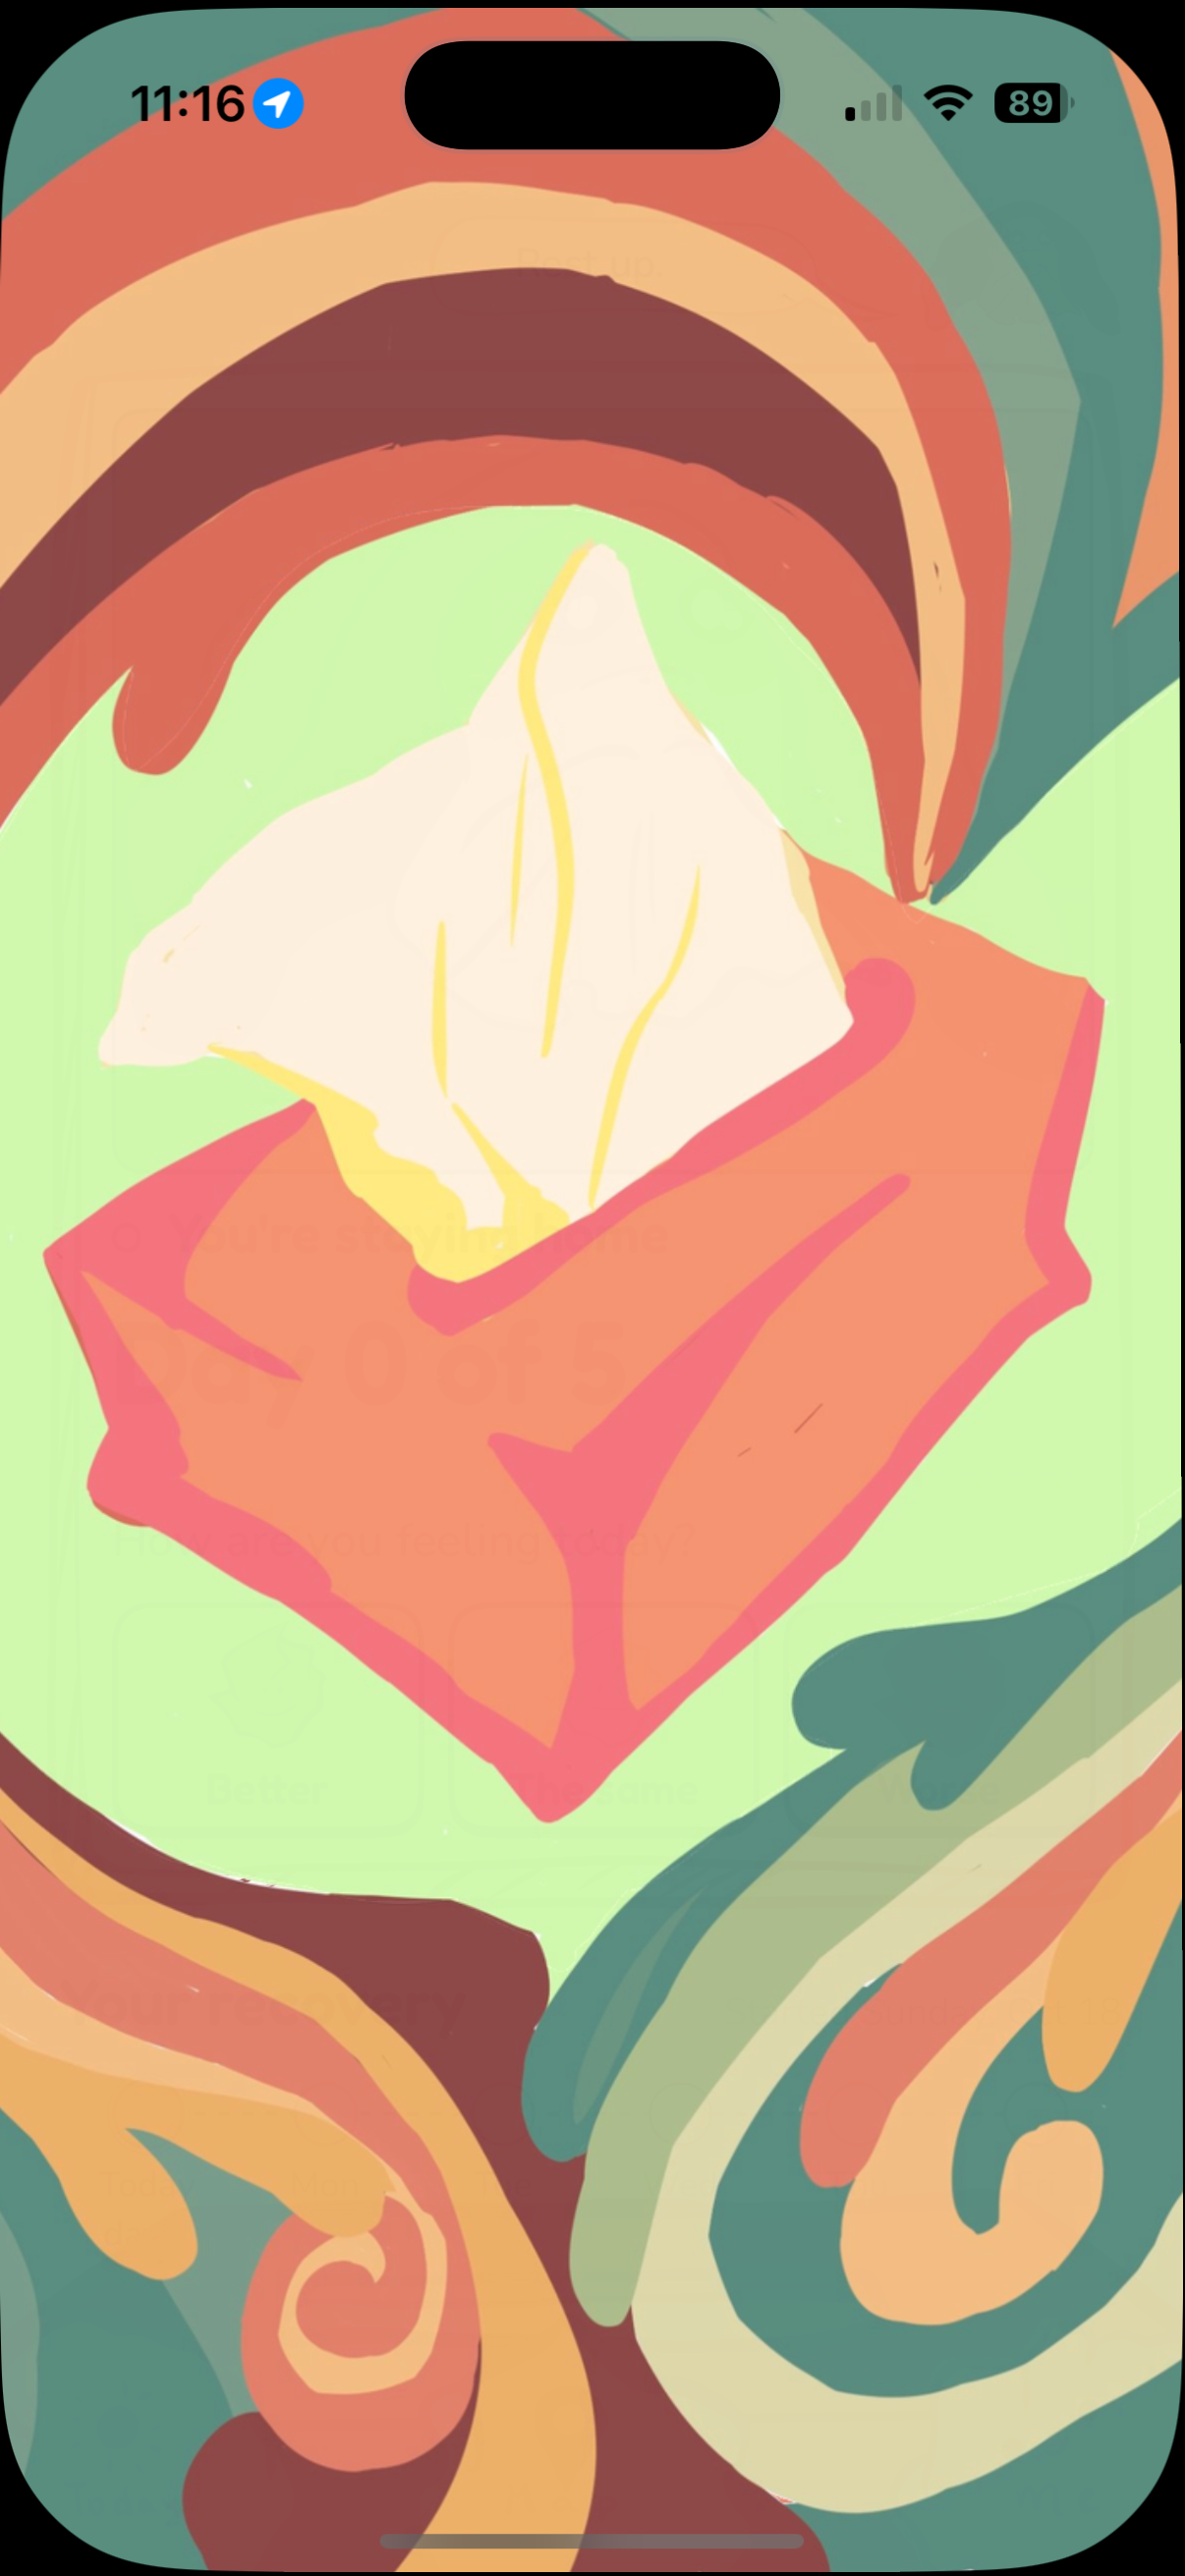
"pull up" tissue animation 2
-
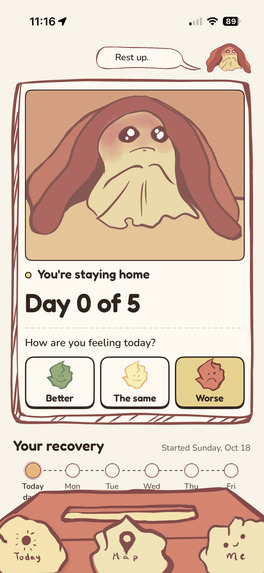
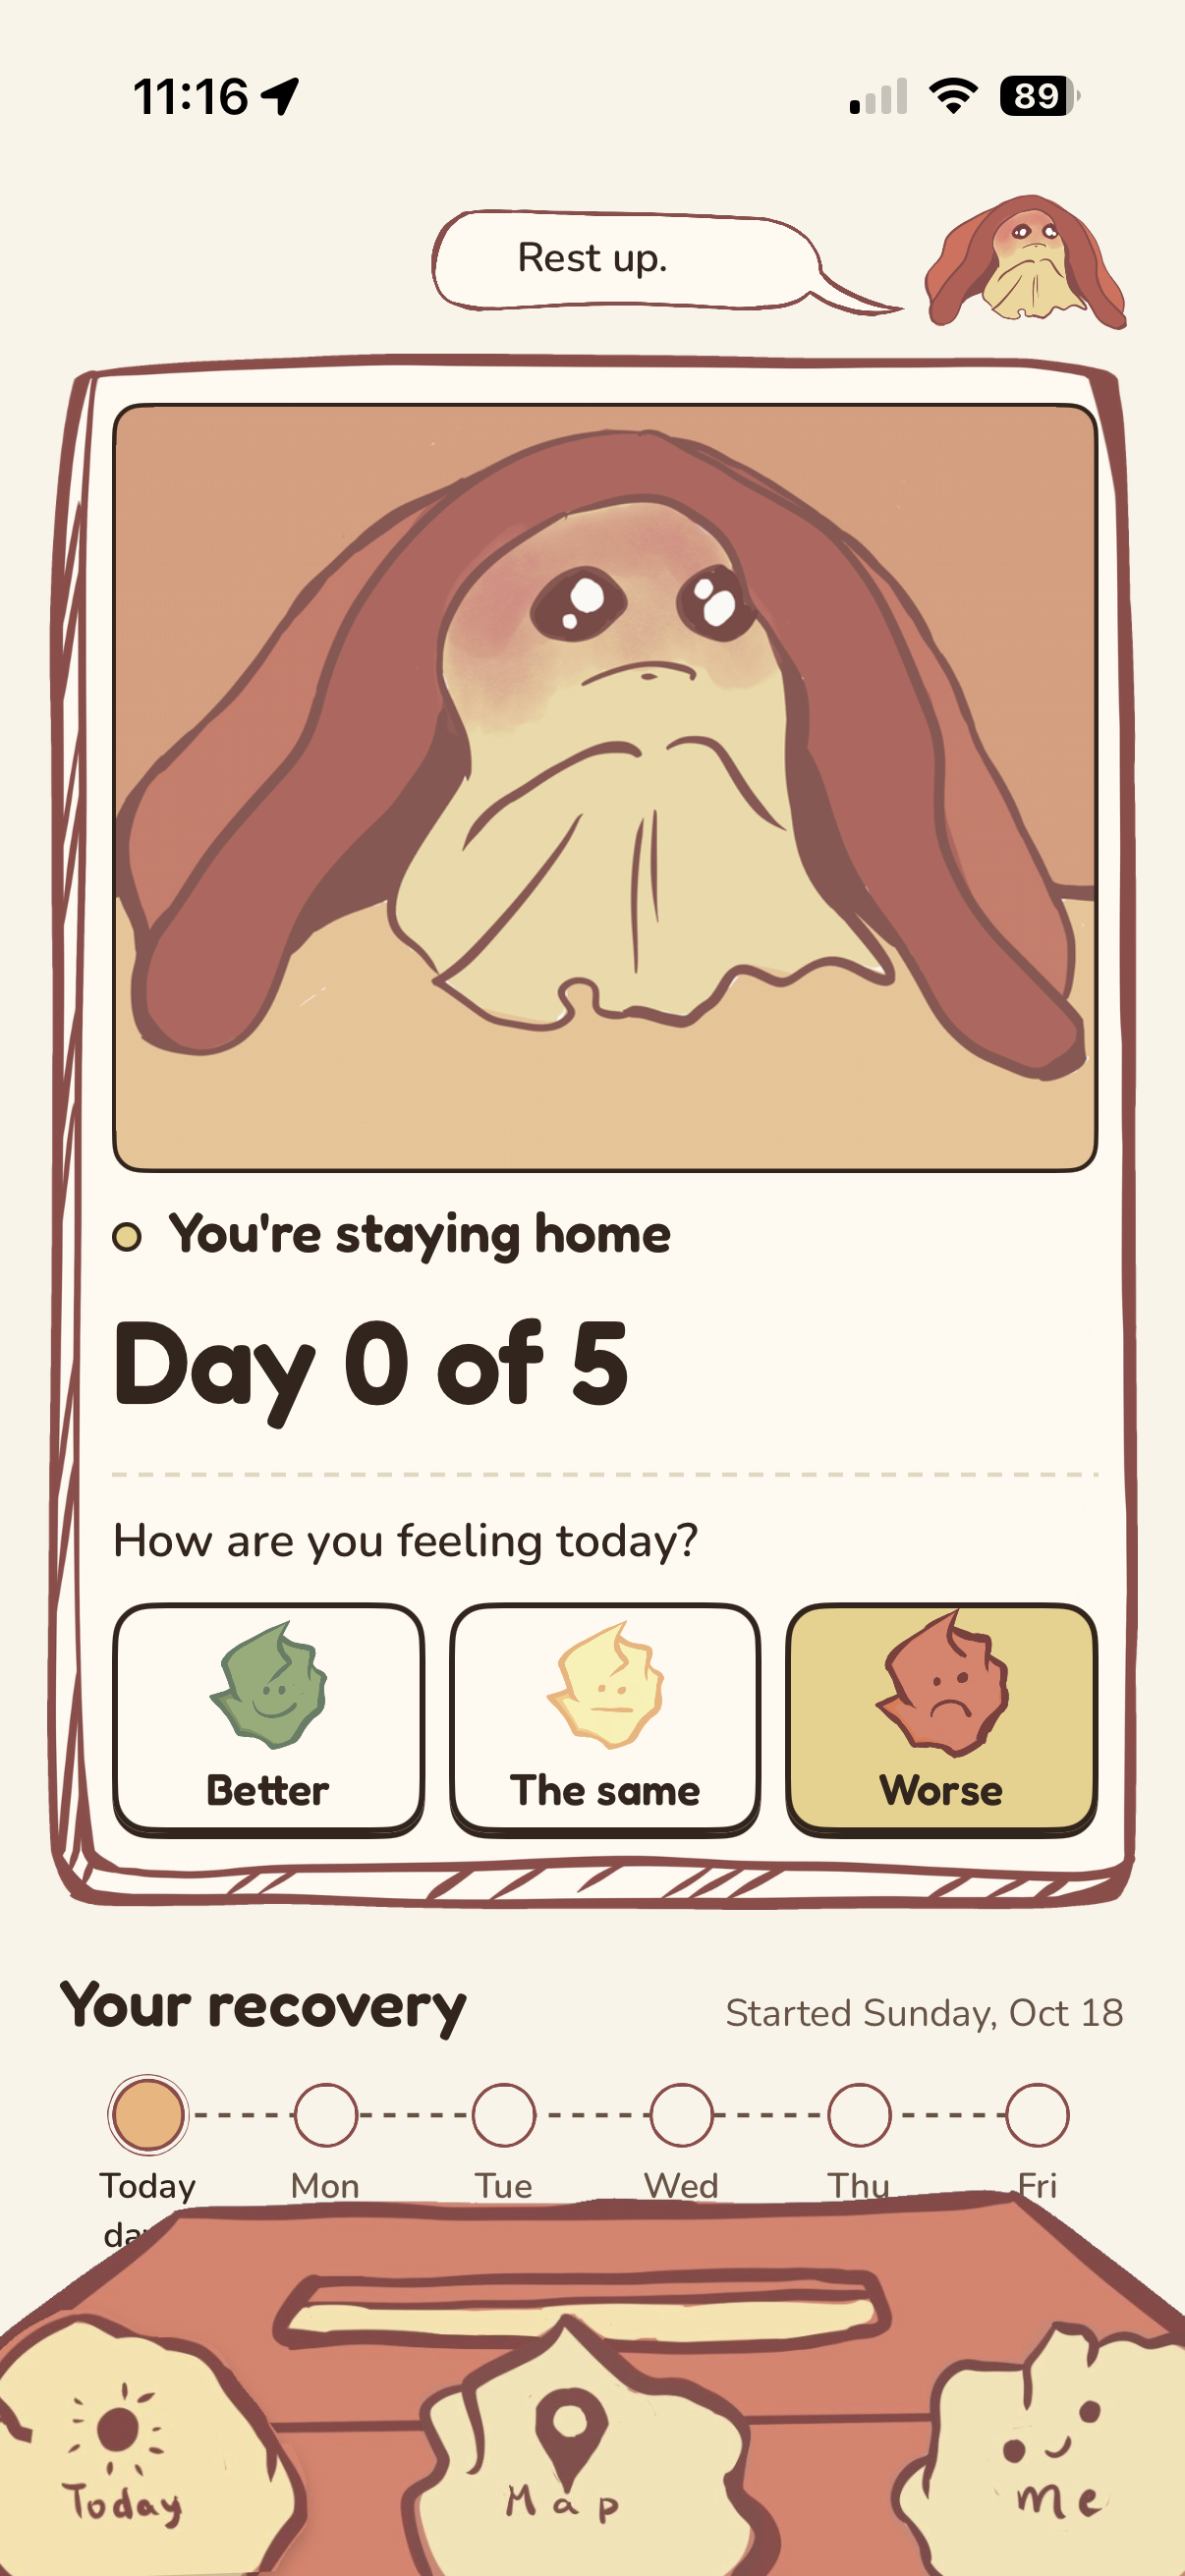
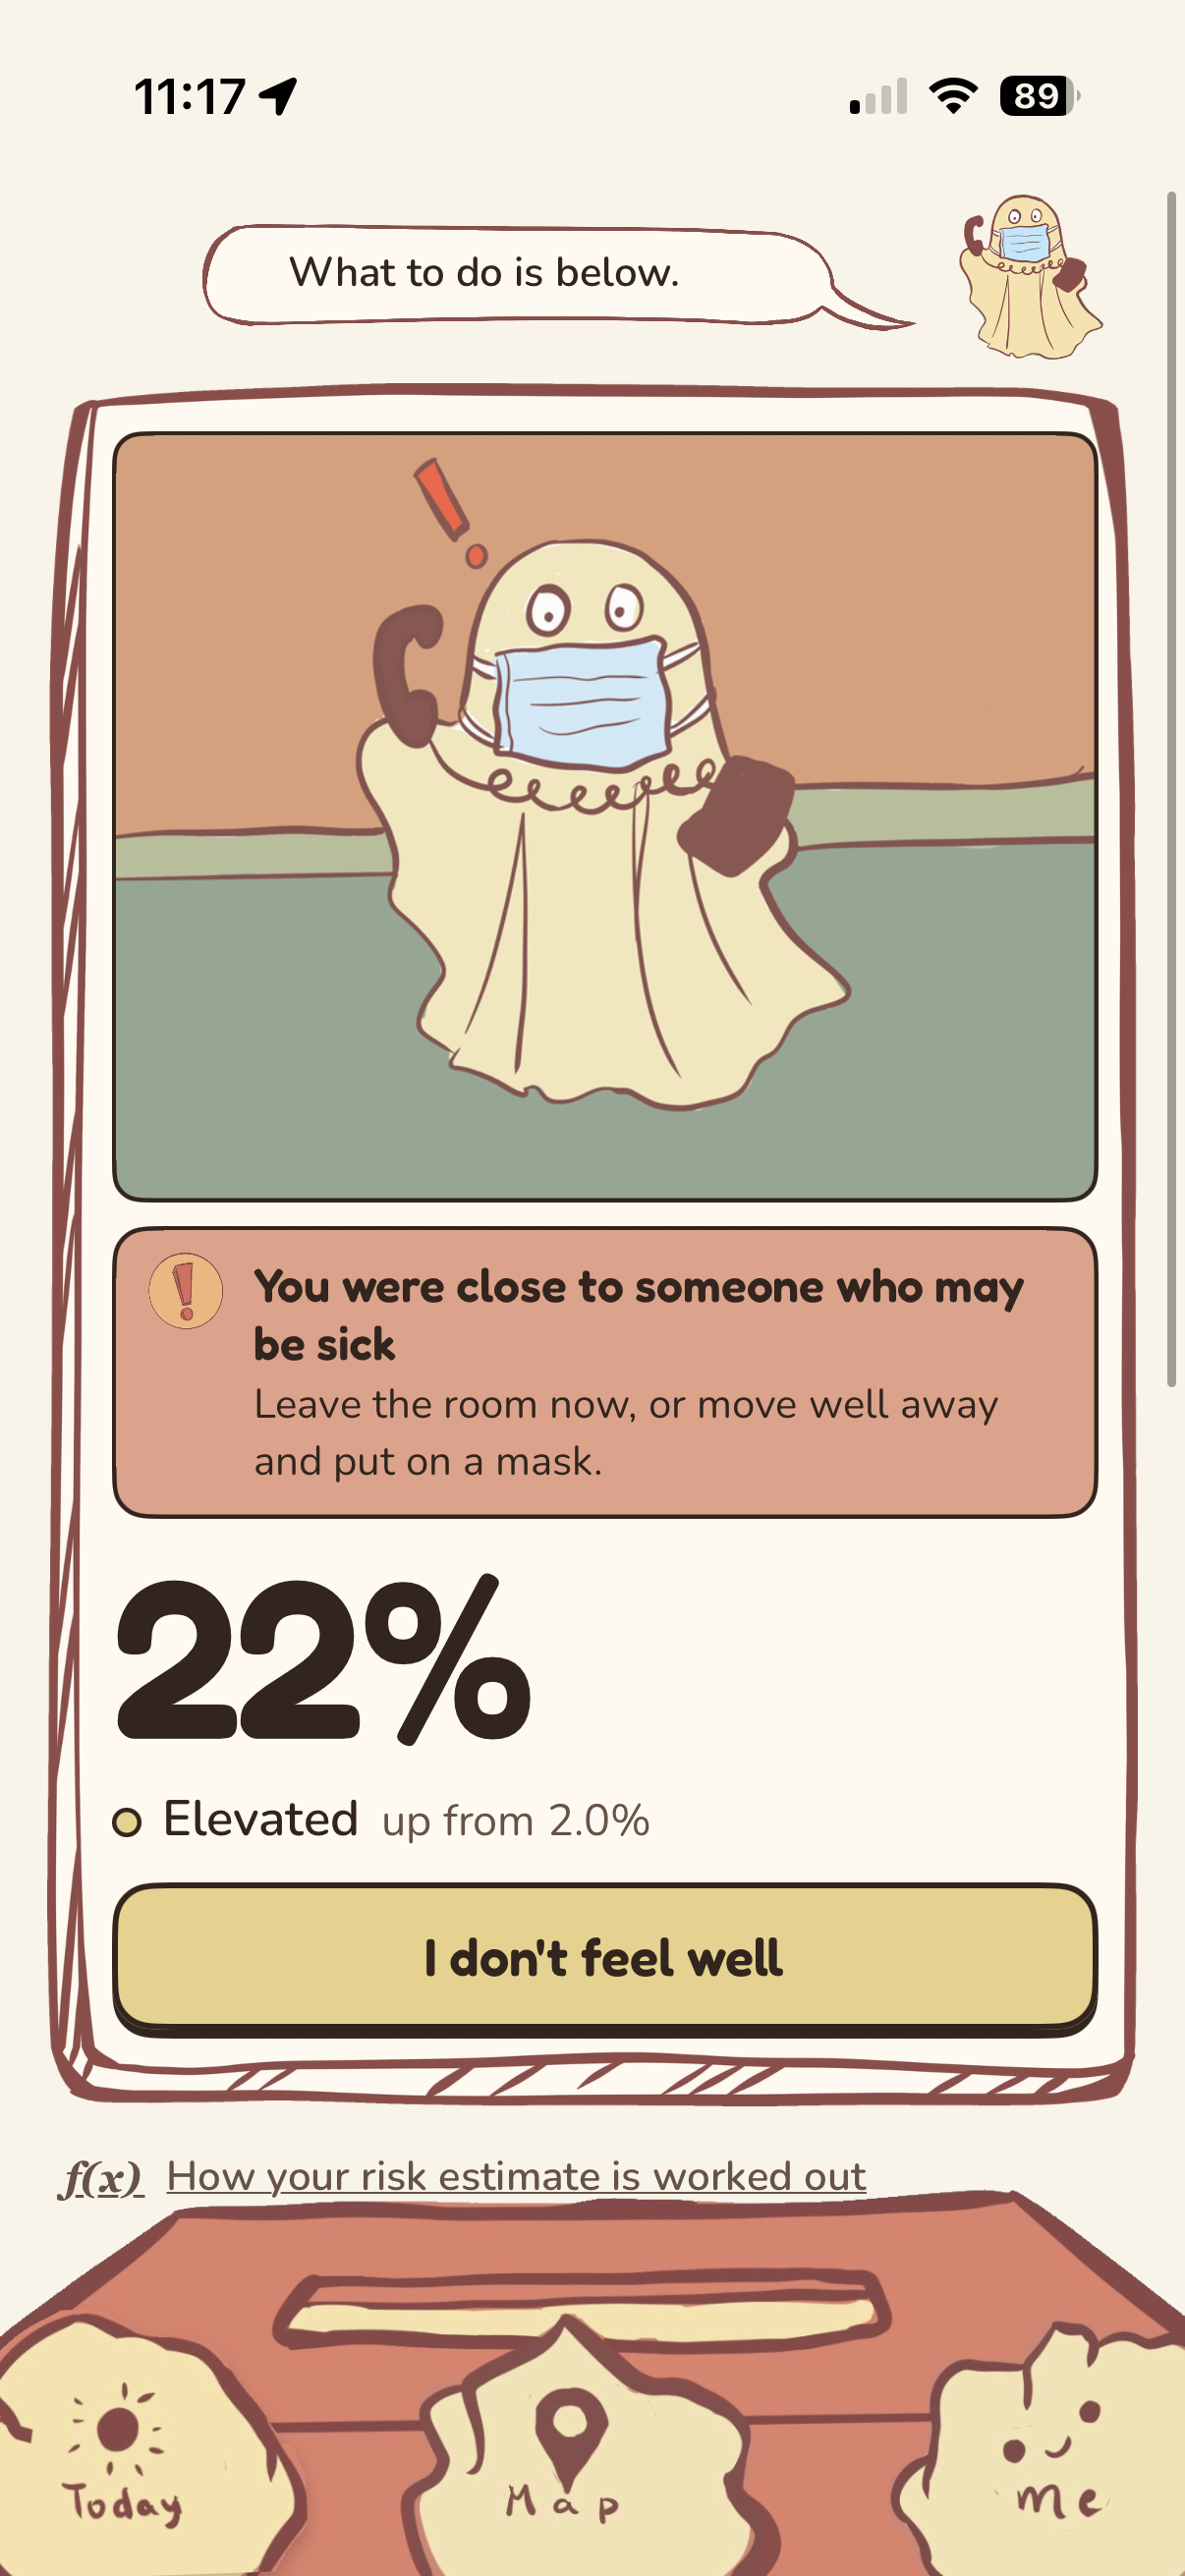
Home page (sick)
-
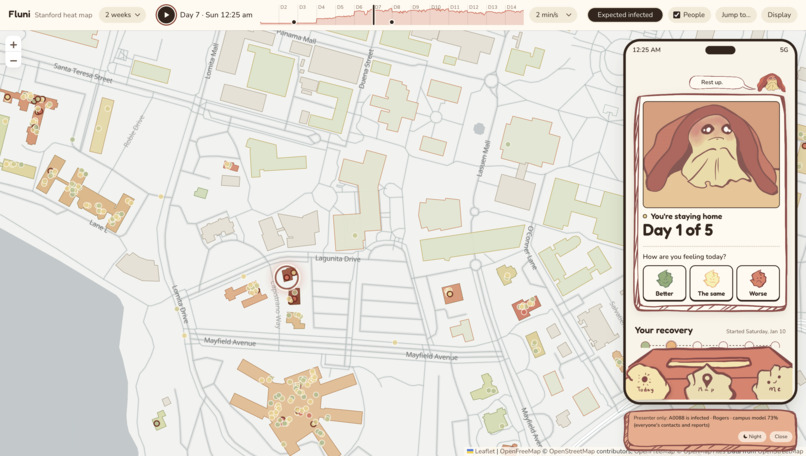
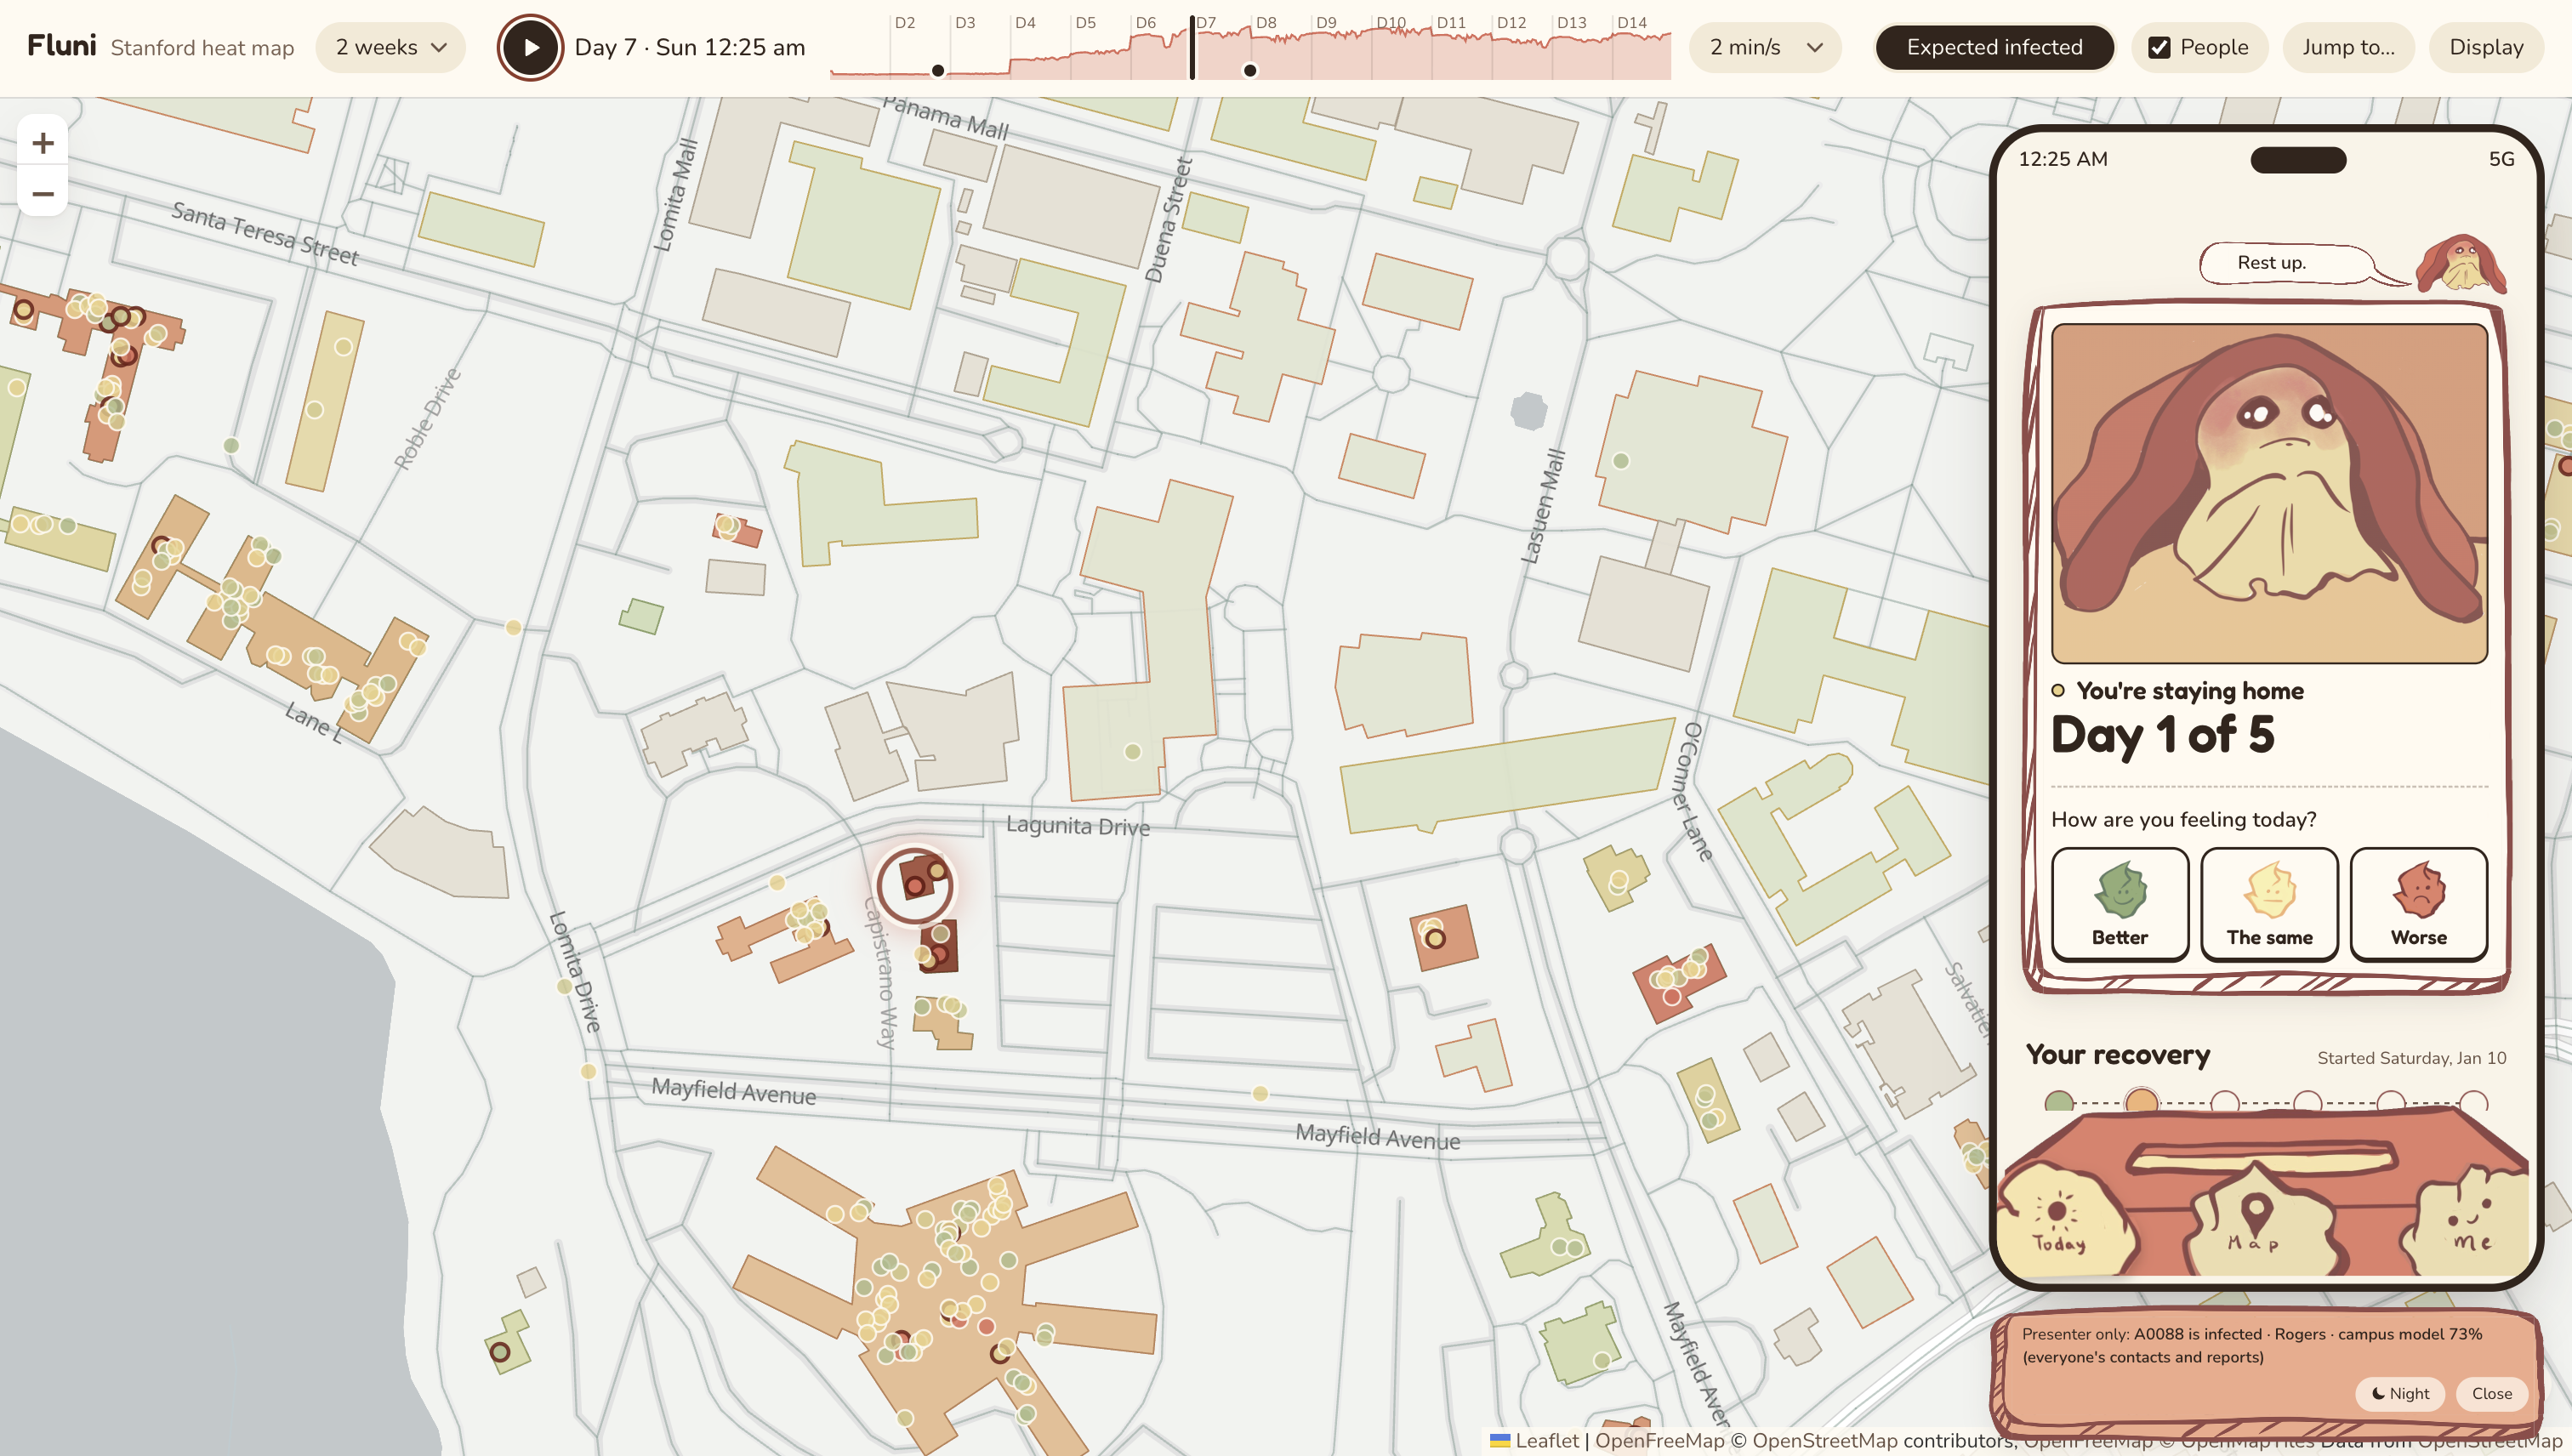
Heat map + User view of one agent (sick)
-
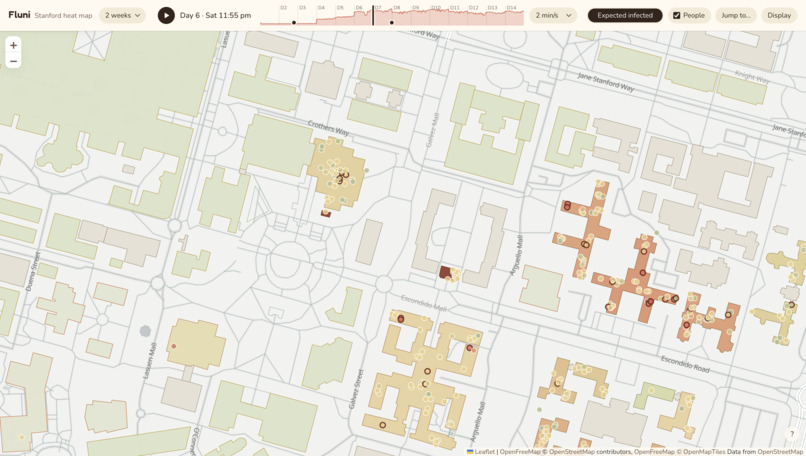
General infection prediction heat map
-
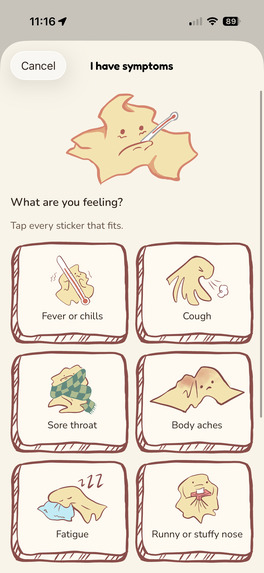
Symptom selection screen
-
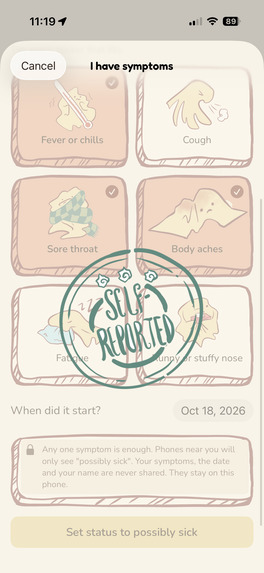
Self-reported symptoms animation
-
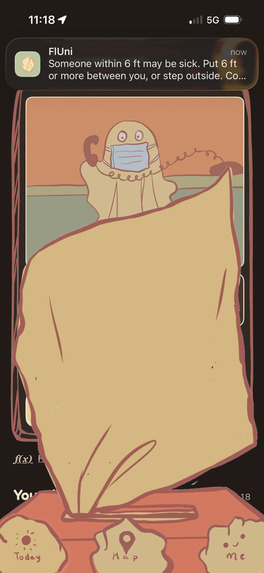
"pull up" tissue animation 1
-
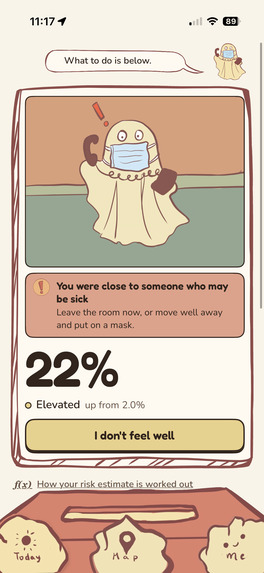
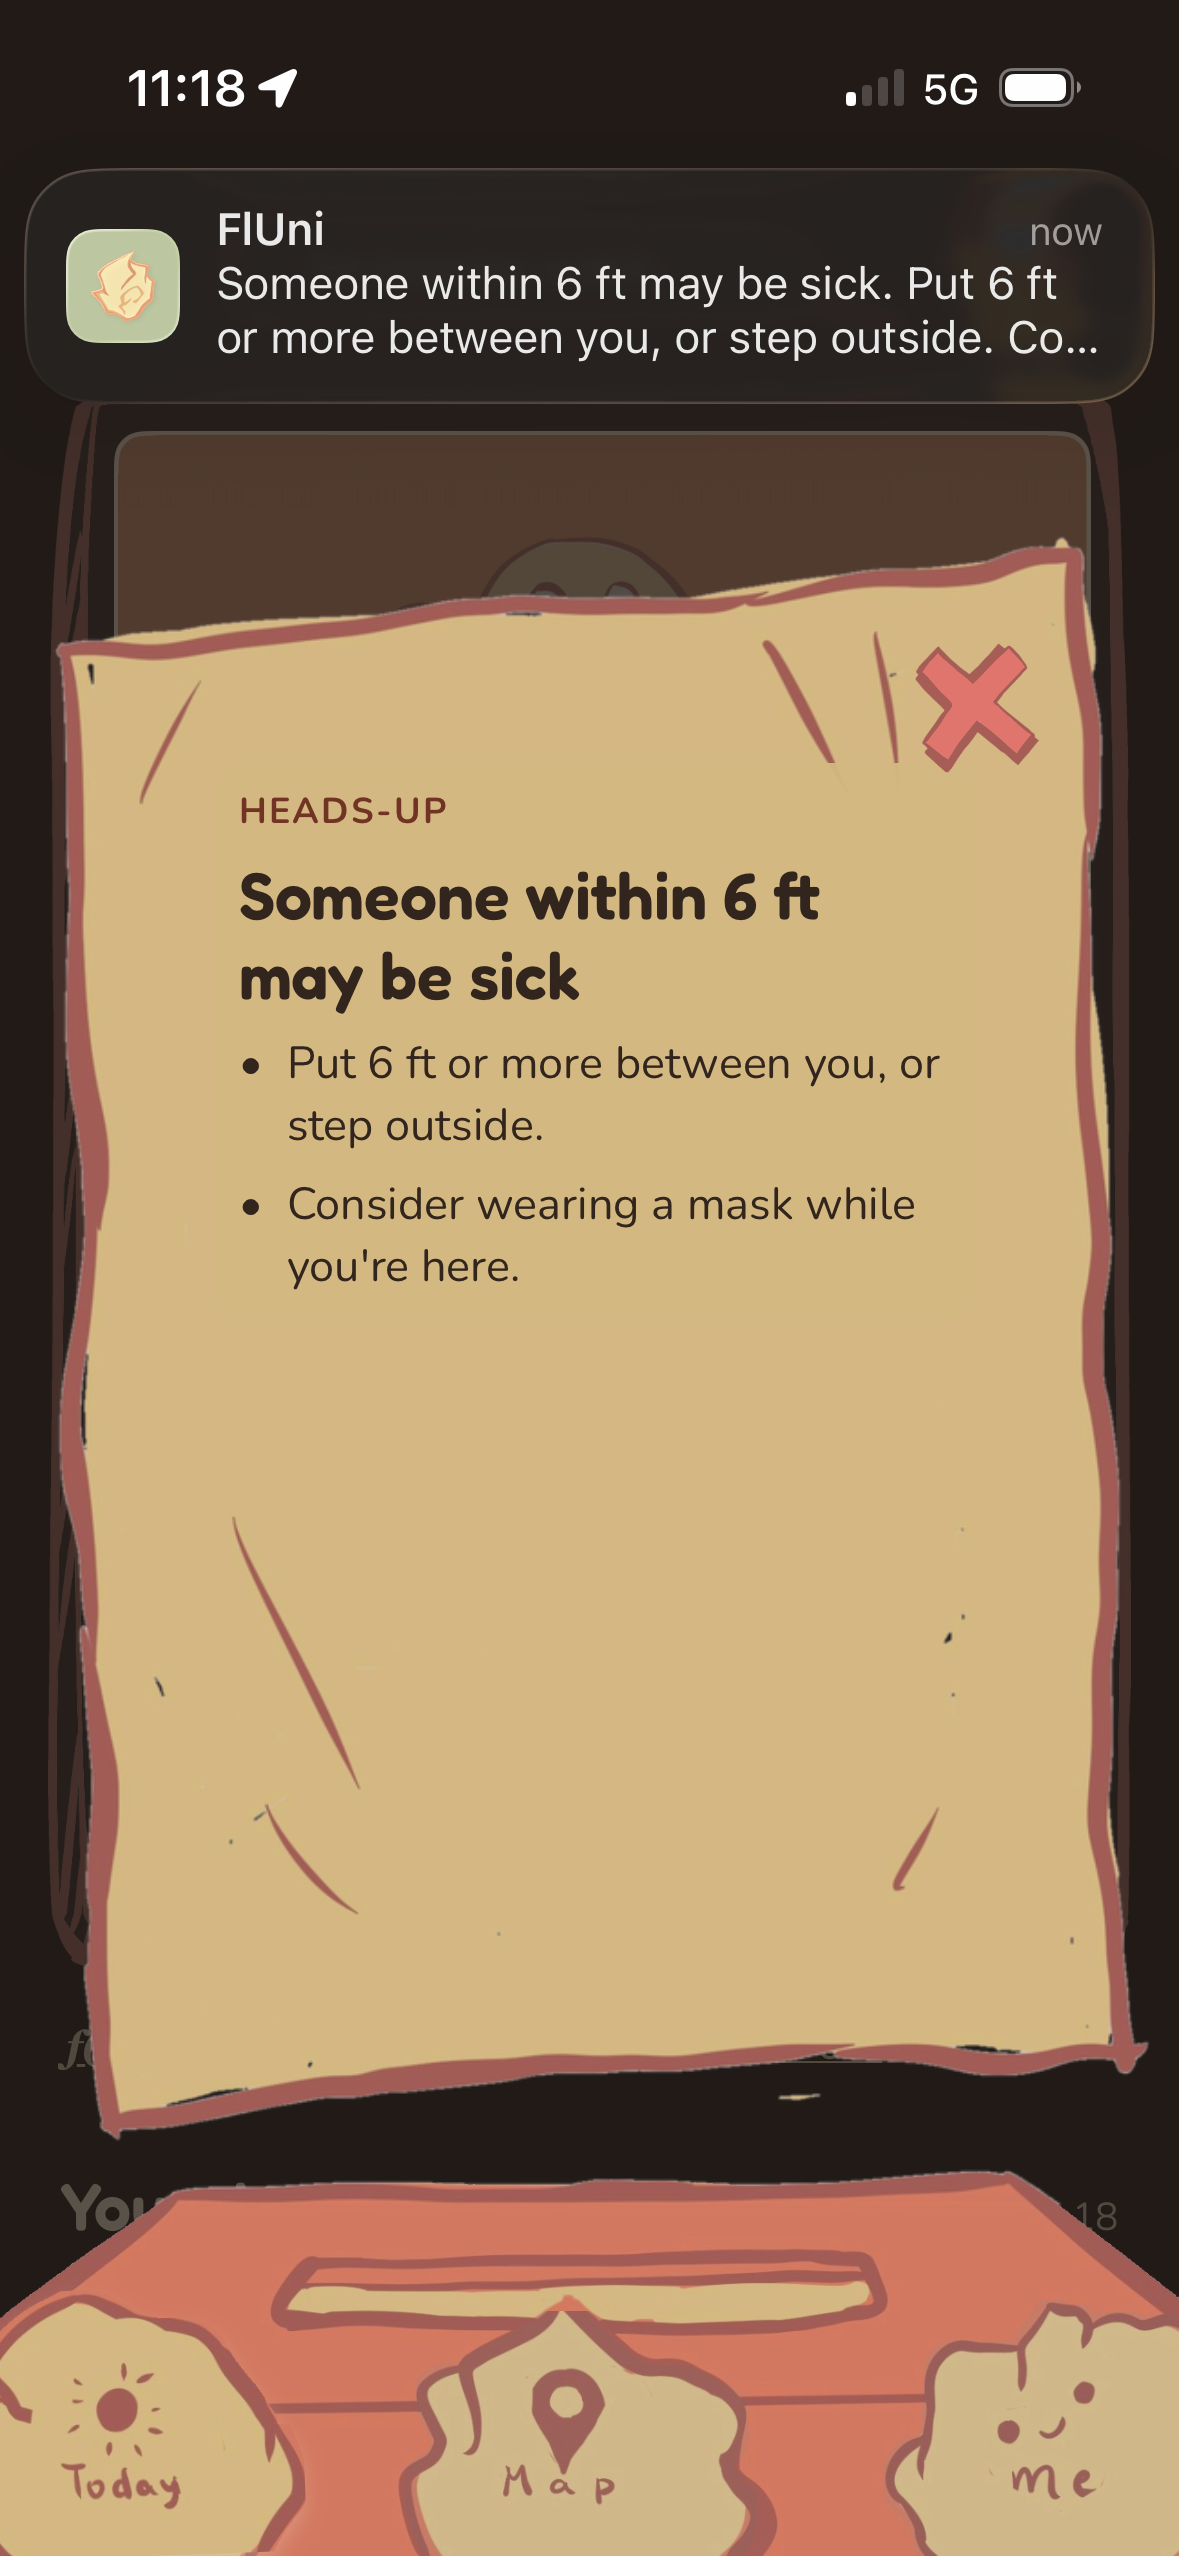
Risk of exposure home screen
-
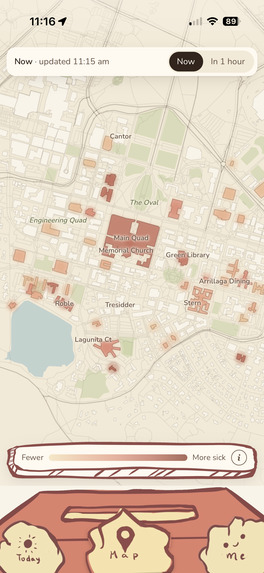
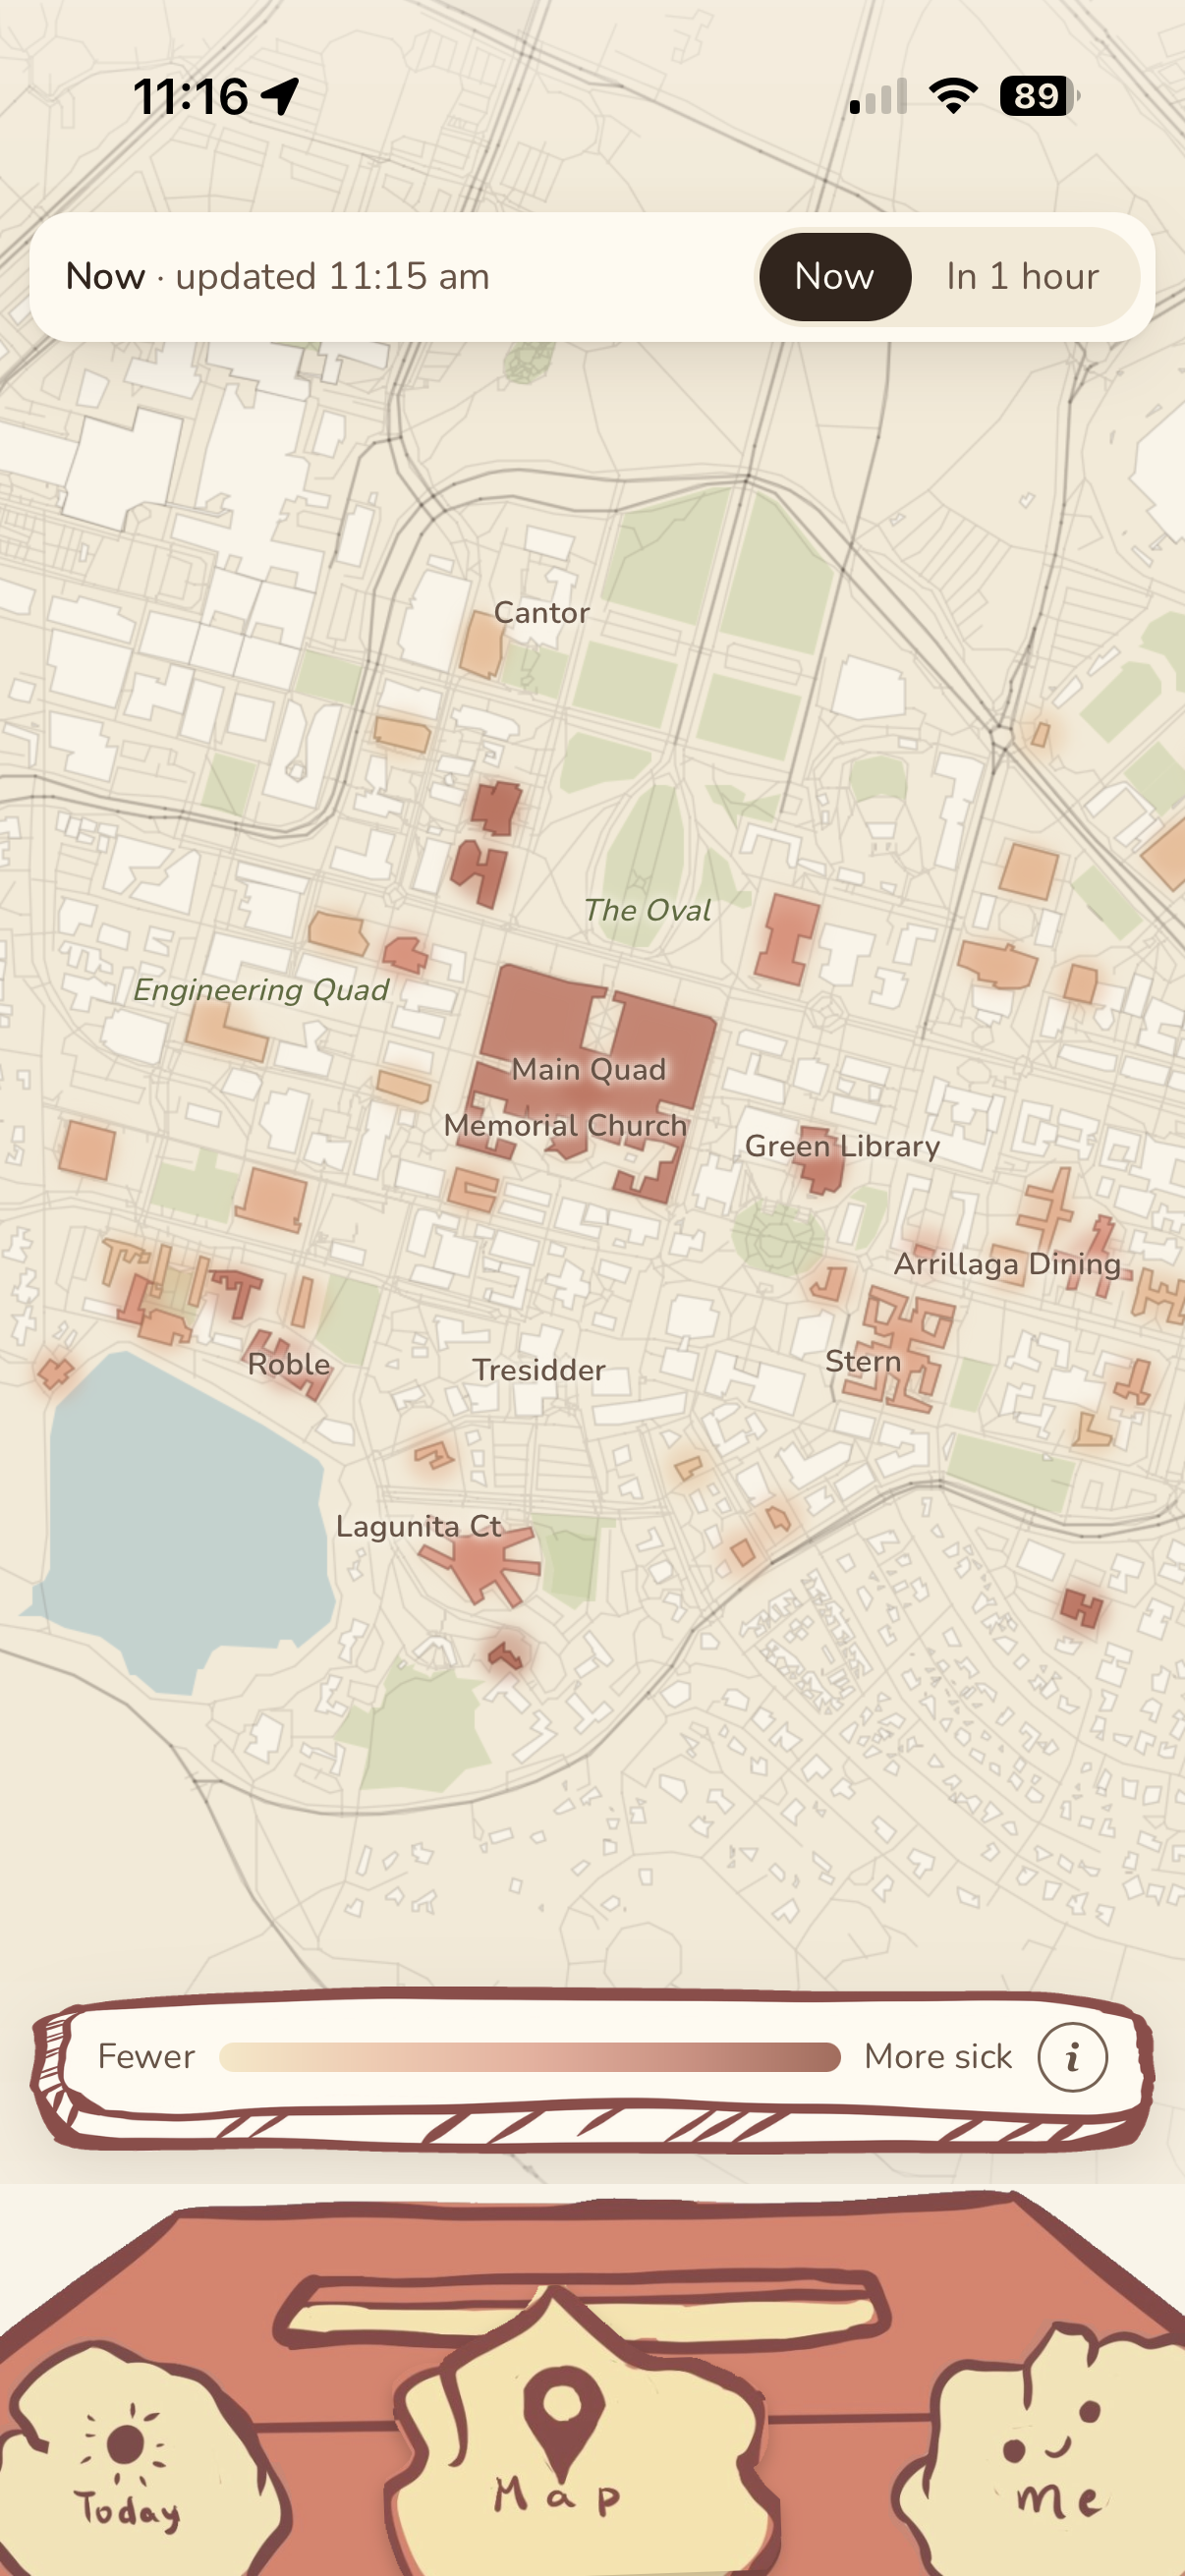
In-app heat map
Inspiration
When the COVID-19 pandemic was at its peak in 2020-2022, contact tracing events were all the hype. Big names like Google, Apple, Facebook, and MIT all contributed to the space, but none of them really succeeded. They failed for many of the same reasons: adoption was low, concerns about security were high, useful guidance was not provided, infrequent phone users were excluded, and companies’ proximity detection algorithms were flawed. The aforementioned products grew defunct as the pandemic waned, and no contact-tracing app remained widely adopted.
Like every school year, Stanford has been struck by the freshman flu. All of us are victims of it. Not wanting to let the freshman flu (or more fatal illnesses) from interfering with our chaotic university lives, we were drawn to the problem of contact tracing. We realized that many of the problems previous contact tracing apps faced could be solved if we only applied it to Stanford. Because the school is separated by a kilometer in any direction from the surrounding city (colloquially known as the “Stanford bubble”), we are essentially an isolated human ecosystem of our own.
Features
Our main forward-facing feature is an app that helps students mitigate their chances of catching any infectious diseases spreading on campus.
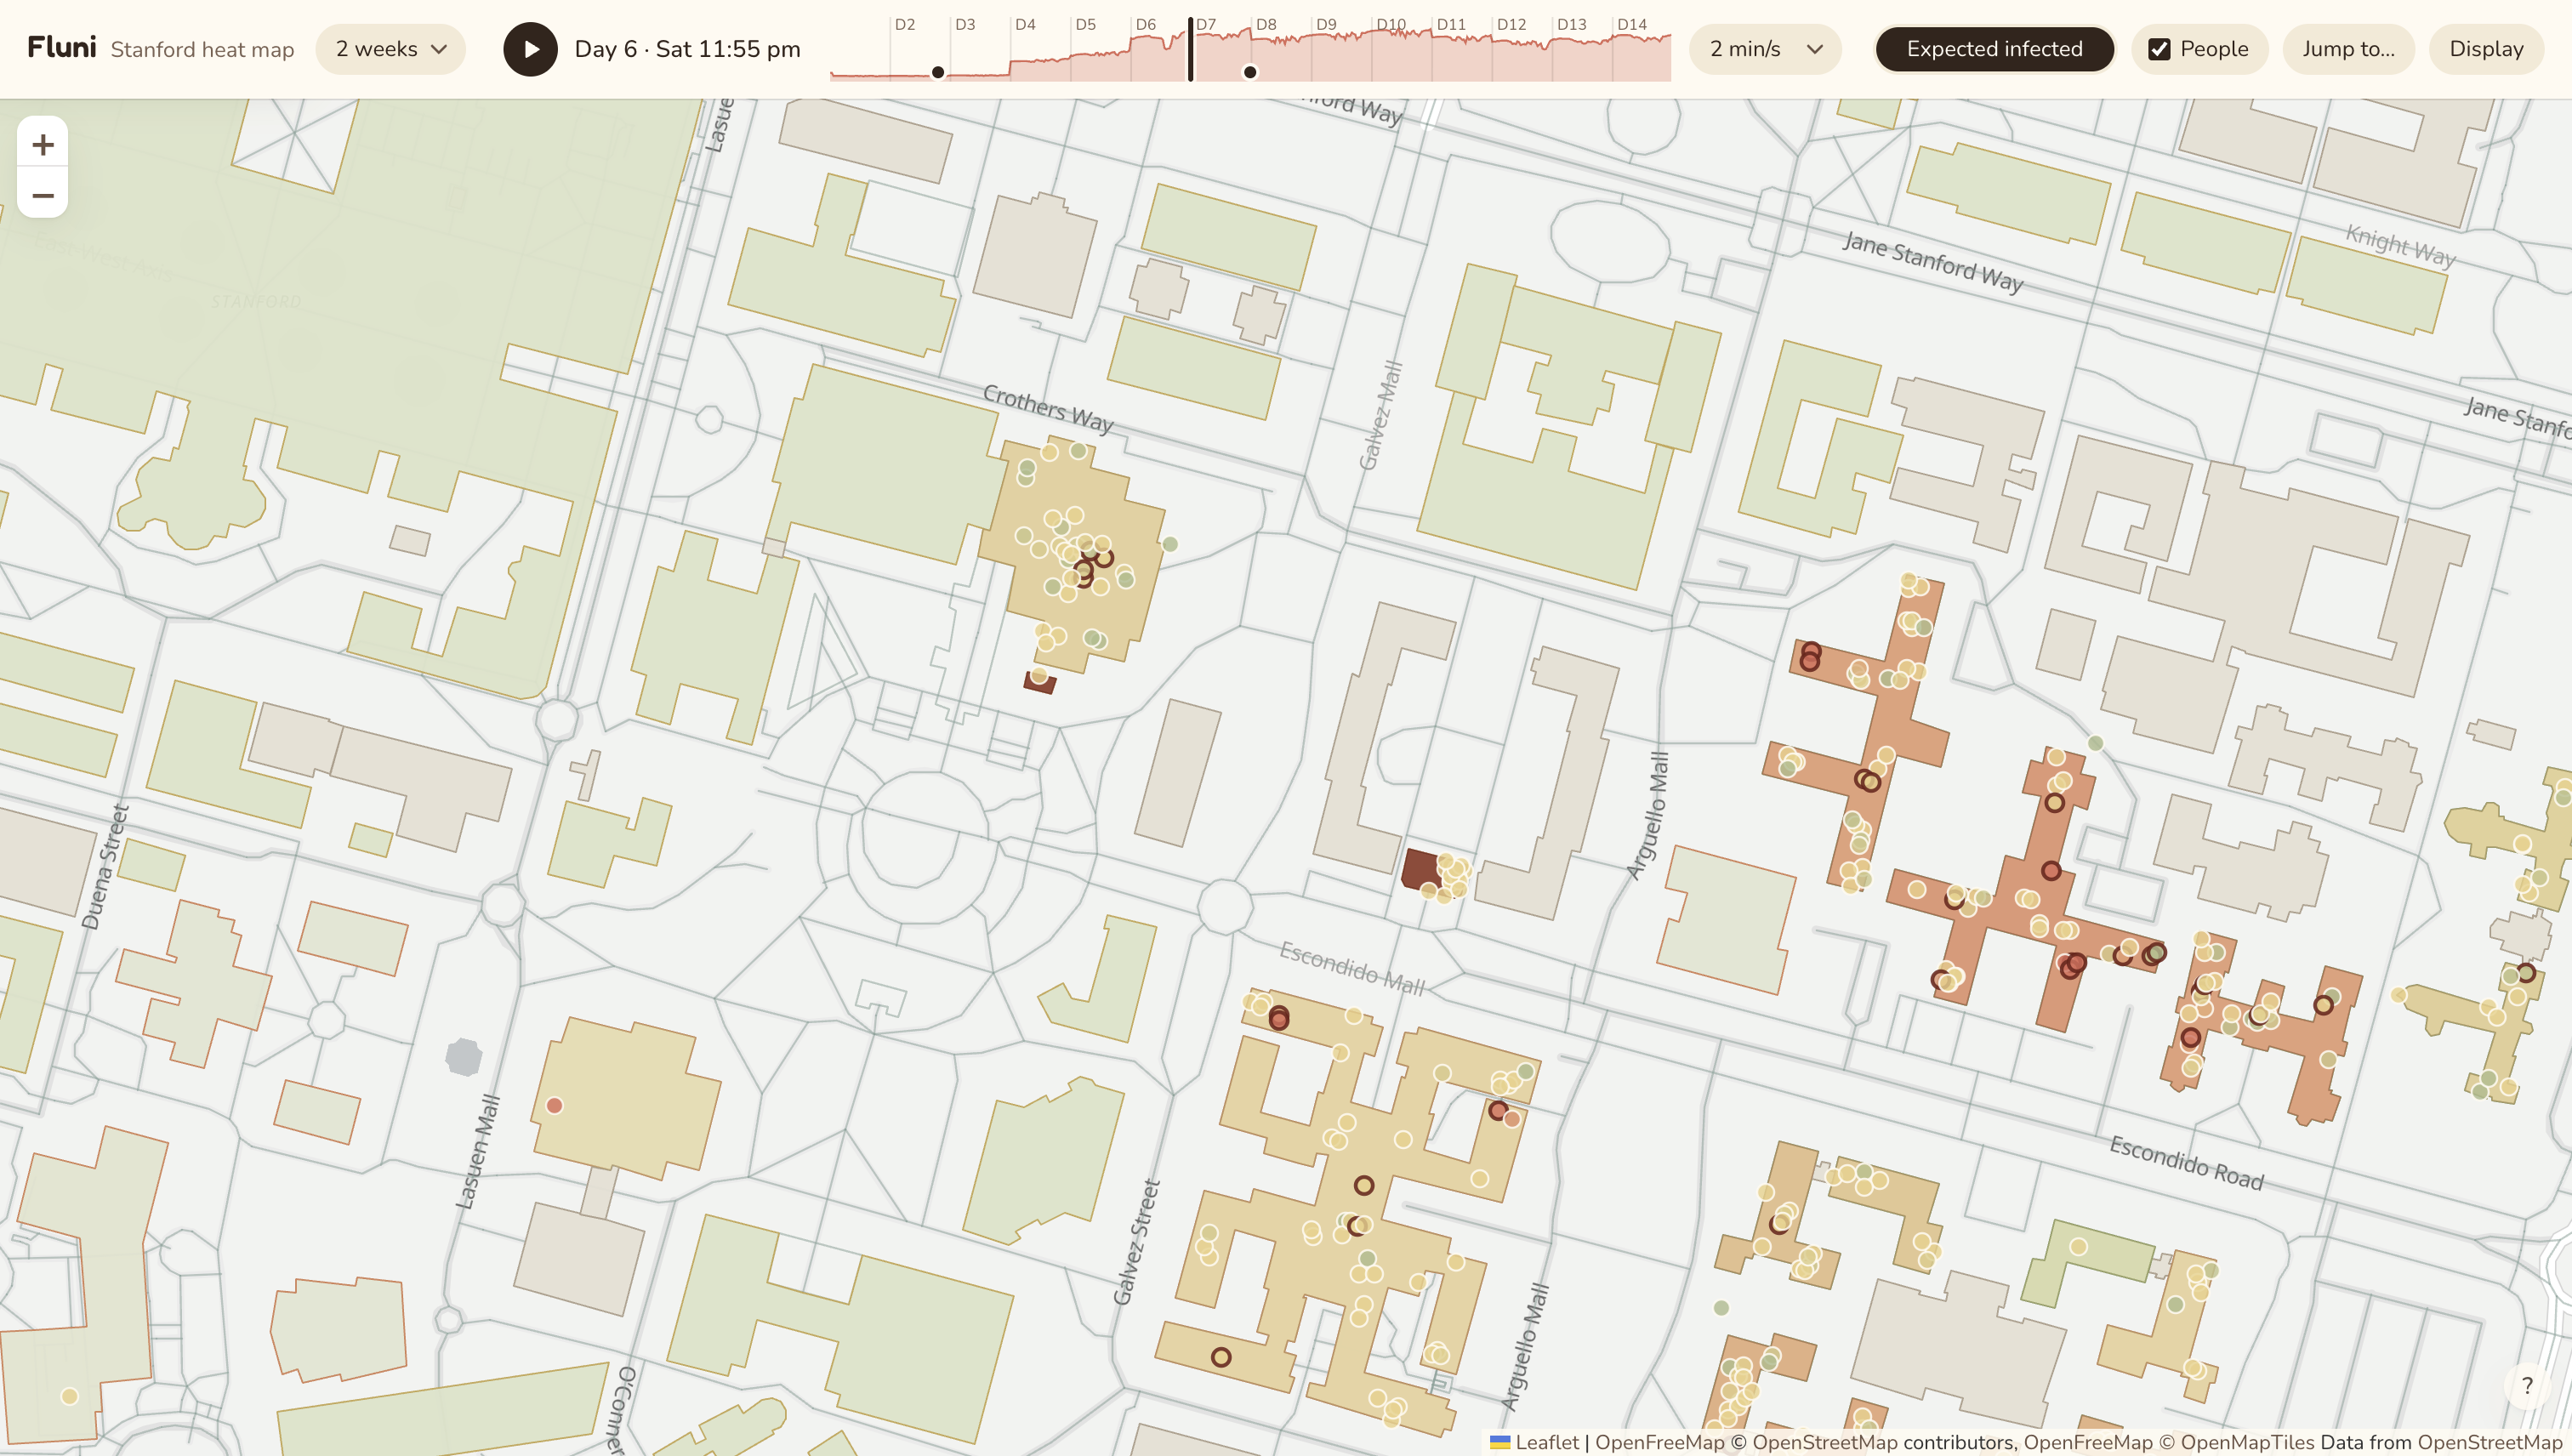
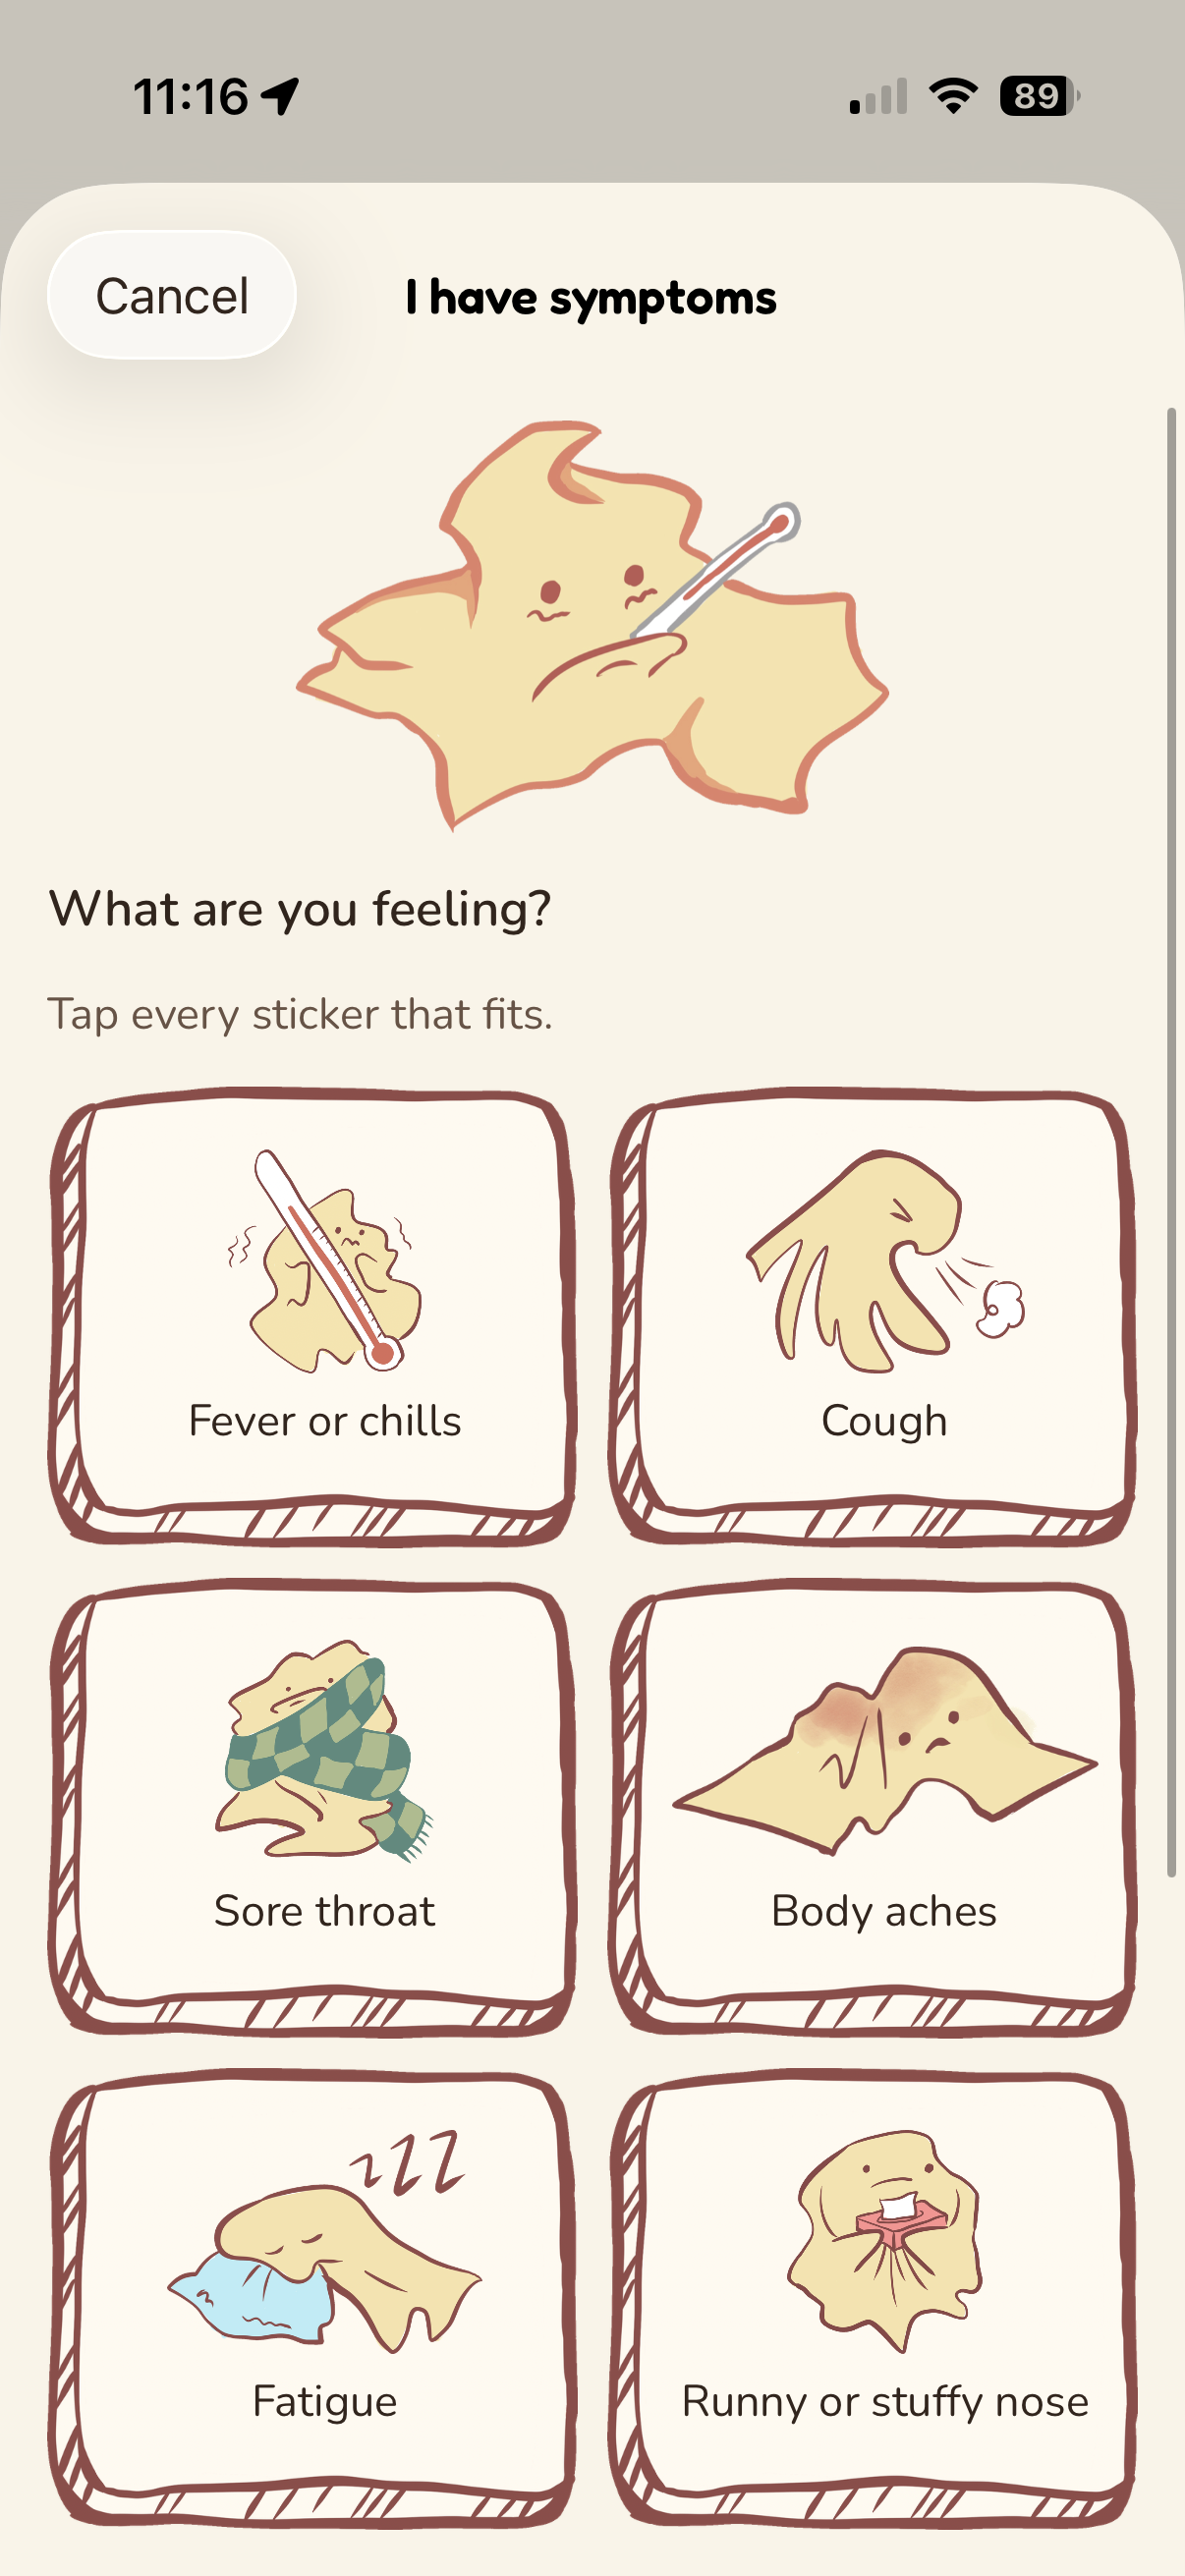
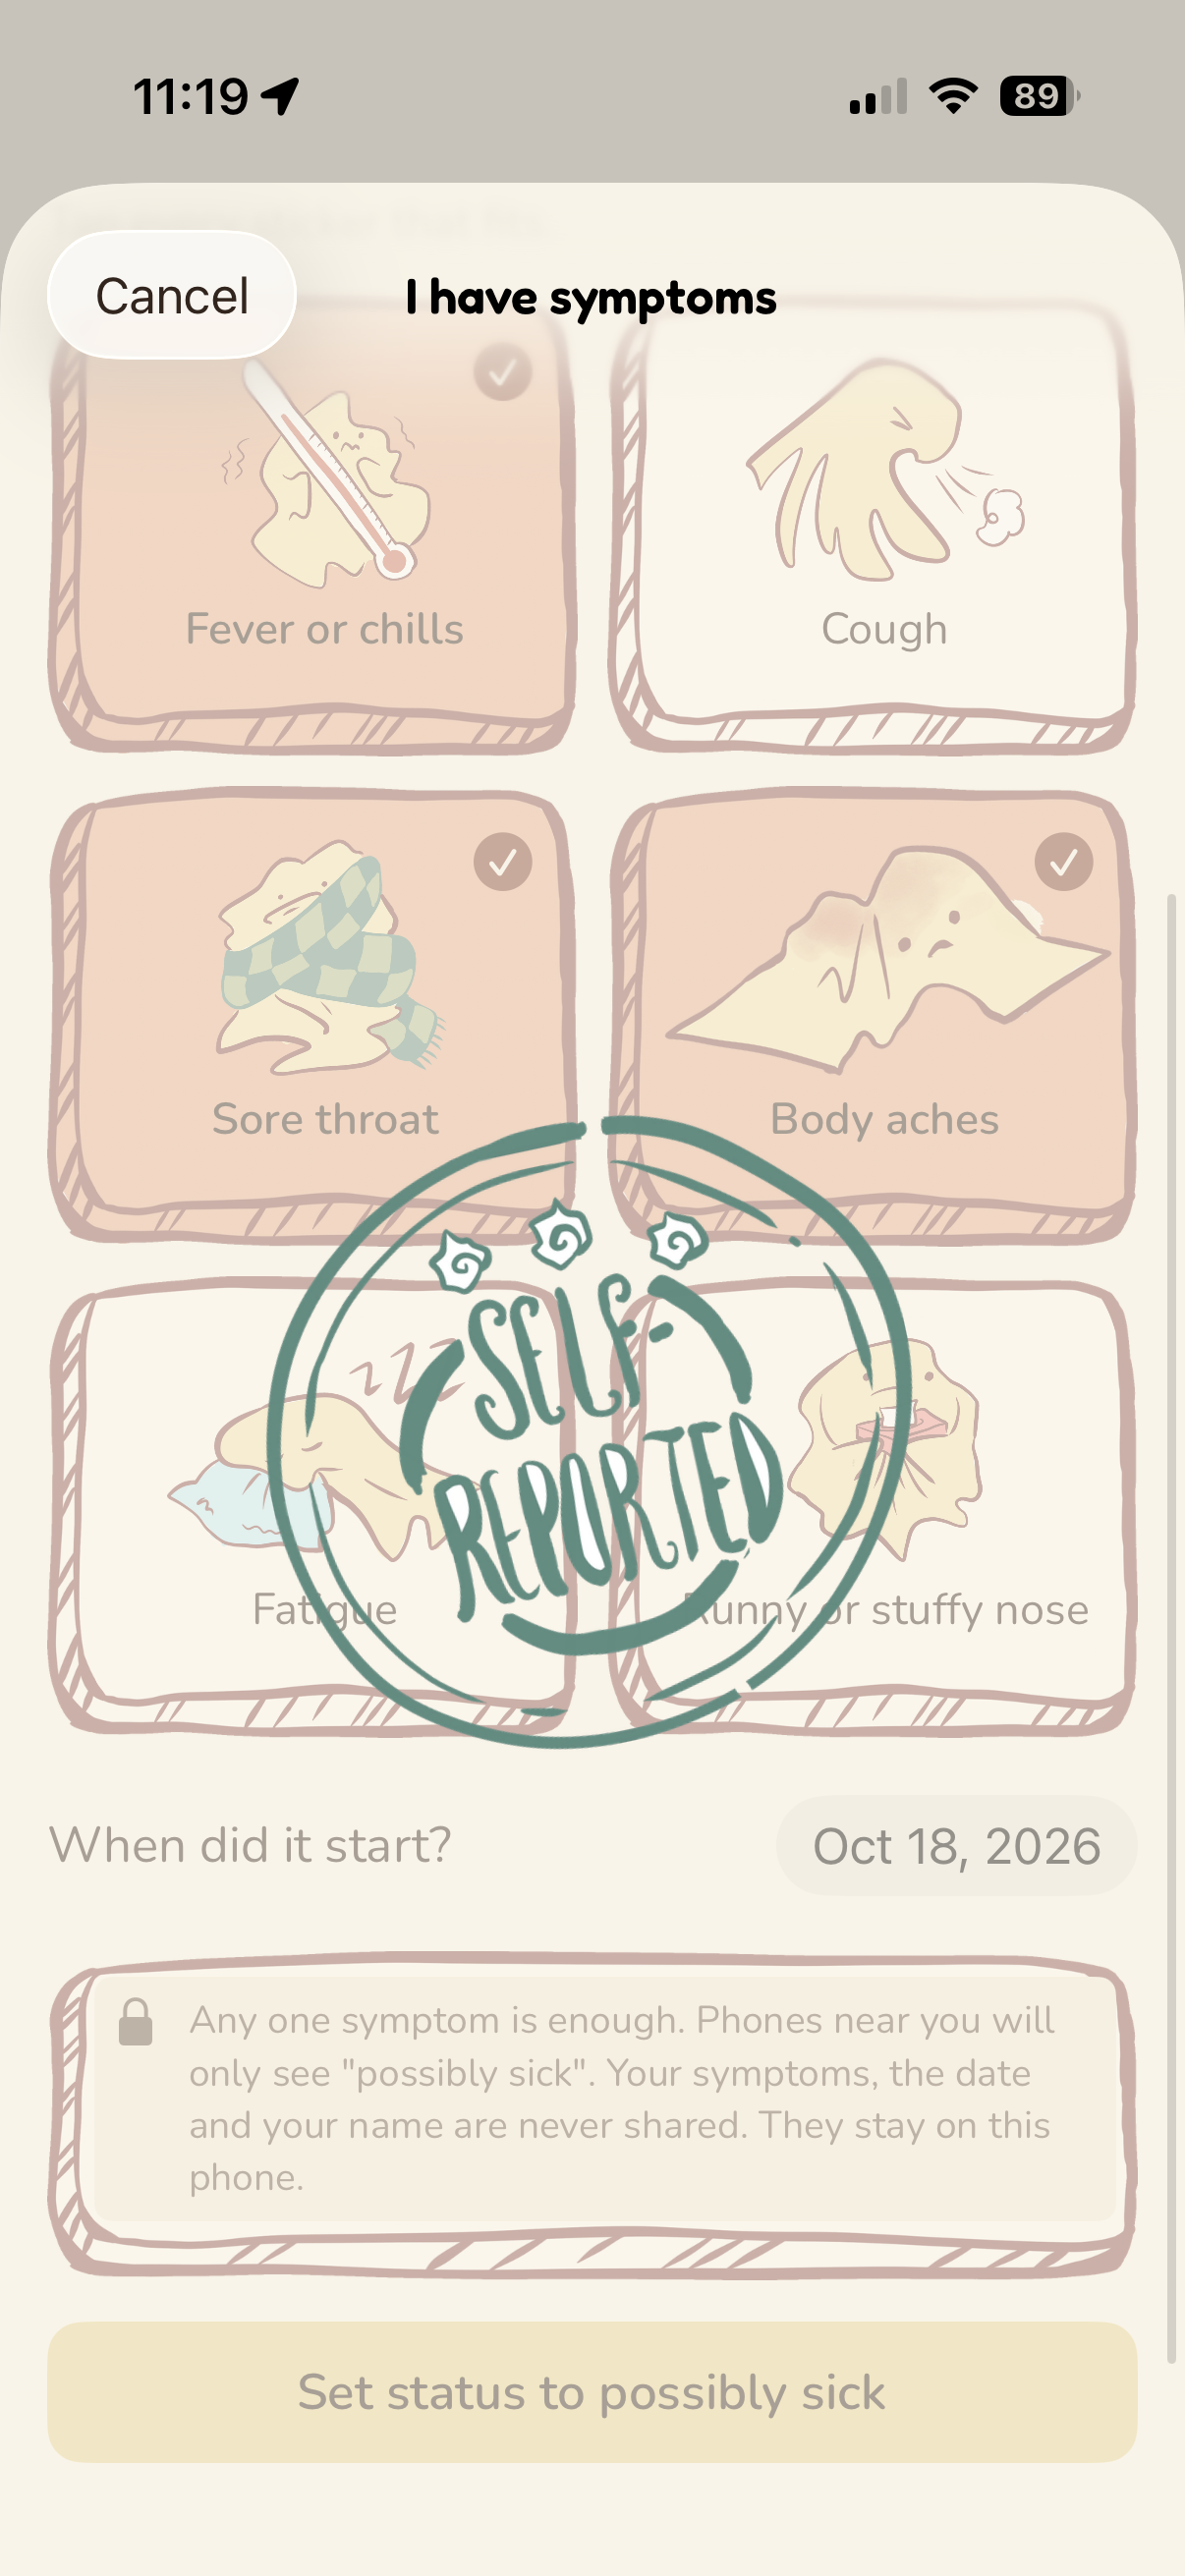
The app has three main primary functionalities. The middle includes a heat map from the user’s perspective, based on interactions of other individuals on the map. By referencing this map, users can know which areas to avoid. Users can also self-report their health status by reporting symptoms and test results to help other users avoid getting sick.
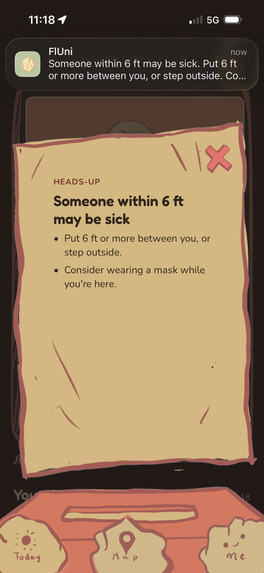
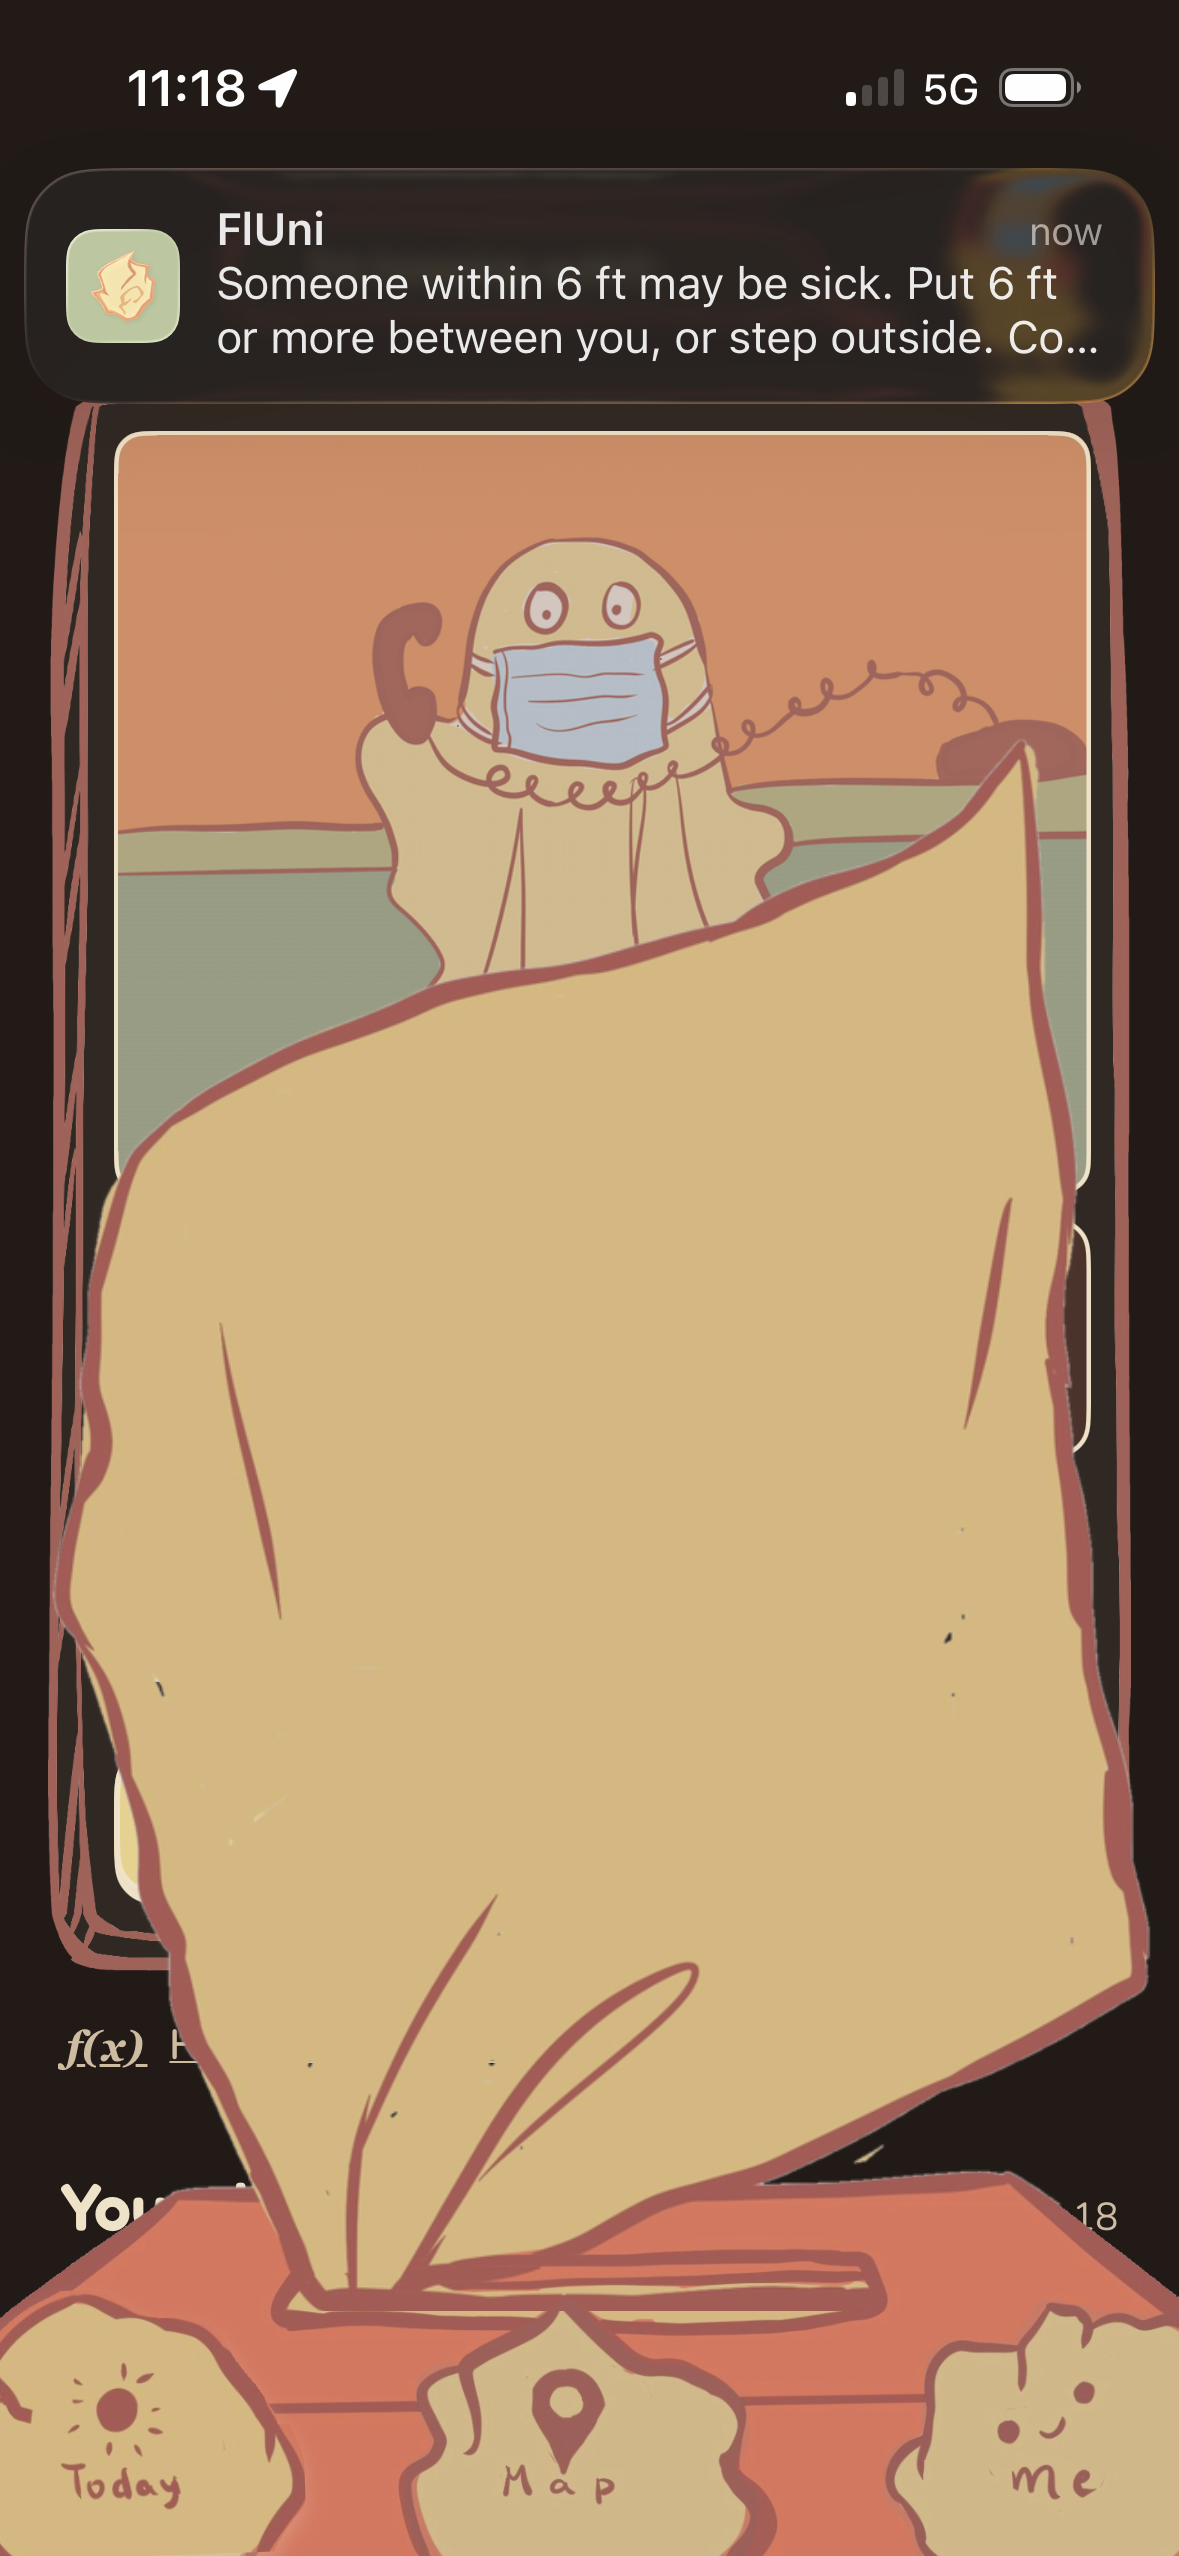
We also used Bluetooth, Ultrawide Band, and GPS to detect when two phones with the apps installed are next to each other. If one of the users is sick, the other one will be alerted that there’s an infected or contagious person nearby.
For the UI design, we used Procreate with the help of Paper to integrate our tissue mascot in various configurations. The color palette was designed to be cozy and soothing, not overly vibrant, so that users are focused on health and recovery instead of being alarmed.
We create a synthetic community of agents that let us (and the university) test how effective various contagion intervention strategies are. There have been many products and theoretical frameworks for preventing disease spread, but historically they have been tested only through math models (e.g. Erdos-Reyni graphs) or empirical tests (e.g. South Korea’s Corona Map, Po Shen Loh’s NOVID). Recent studies have started to use LLM-based agents to simulate human behavior and interaction. We take this a step further by creating agents that simulate Stanford students’ behavior, training our agents on Stanford’s course listing, culture, and study/hangout spaces.
We use our community of agents (scaled up to 7,500 students over 14 days) to test our various technical features. Our main technical feature is the probability algorithm, which determines the probability that every person on campus has been infected by the flu at any point in time. Based on the circumstances of each interaction between a pair of people in the simulation, we used two distinct methods to calculate the probability. The first is an explicit probability calculation using Bayesian inference, while the second is a neural network that we trained on simulations. We implement a Graph Attention Network and a simple MLP+ReLU network. This is novel because no widely-adopted contact-tracing app gives users the probability that they are infected instead of a binary indicator.
How We Built It
We first built our map from OpenStreetMap. Our first iteration of agents were not LLM-based and instead relied on various archetypes. After we had data from our agent simulations, we built a heat map and probability model on top of it.
We built the functionalities of the app after mapping a structure on Paper visually. Every visual element started as a Procreate drawing in a four-color “campfire” palette (sage, sun, ember, fire). We turned the palette into CSS design tokens and checked every text pairing against WCAG AA contrast. The drawings went through a Python/PIL pipeline that removes the white background with flood fill, crops each asset, and exports it as a transparent PNG. The tissue alert is a frame-by-frame animation. The home screen uses two-frame flipbook scenes for each state, swapped with CSS steps() and frozen for users who turn on Reduce Motion. For night mode, I generated a “lamp-lit” variant of every asset by remapping colors in OKLab. An issue we ran into was a race condition in how the iPhone app tracked its lifecycle, so the opening animation was stuck. We fixed it by removing the complicated hold-and-cover logic and went back to the simple intro and added a failsafe to prevent the intro from staying on screen for more than a few seconds.
An issue we encountered was determining which variables to include in the probability calculation. When an infected person meets an uninfected person, the probability that the uninfected person gets infected depends on a variety of factors, but some of them cannot be determined or tracked by a smartphone. For example, even though we can obtain the sizes of the buildings where people meet, we cannot see the size of the individual room where they are meeting. This meant that we excluded the size of the building from our calculation altogether, among other variables.
Another issue we encountered was that the GNN trained on these features was not outperforming the default method of guessing a constant probability. Even after many adjustments, it was not working, so we instead trained a deep MLP with ReLU activations. We hypothesize that there is not enough data for GNNs to learn non-obvious traits of the problem like “I haven’t seen Rio in a while, so he must be sick.” Our MLP ended up training better on the LLM agent generated data (Frankenstein) as opposed to the fixed data. This is encouraging, as it shows our agent data had more latent properties to learn.
What’s Next?
Going forward, we would like to integrate our app within the Stanford Vaden health app, which has useful information about vaccination history and location. It is also used by almost all Stanford students, so adoption would not be as large of an issue. We will advertise our app on Fizz and create content to promote it.
From the technical side, we would like to continue generating better synthetic data for Stanford. This not only lets us test features for our app, but it can simulate the impact of infectious diseases on the community. We hope that with more data, we can train models with more parameters (e.g. GATs and Transformers) to predict infections with more accuracy.
Long term, we hope we can bring a specific app to more college campuses.


Log in or sign up for Devpost to join the conversation.