-
-
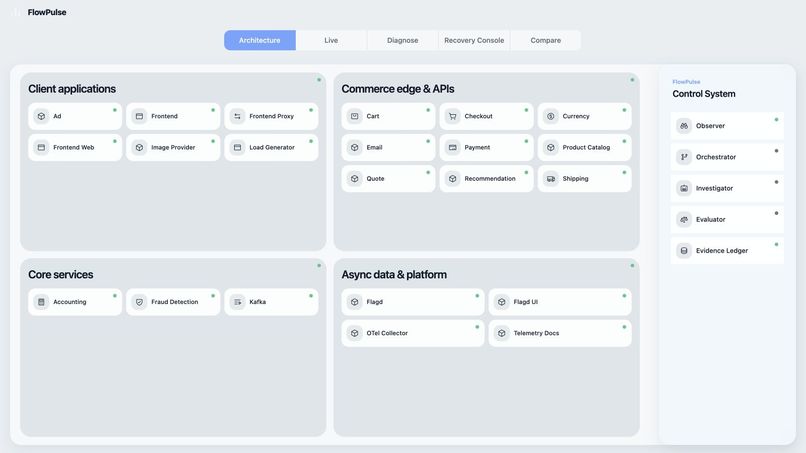
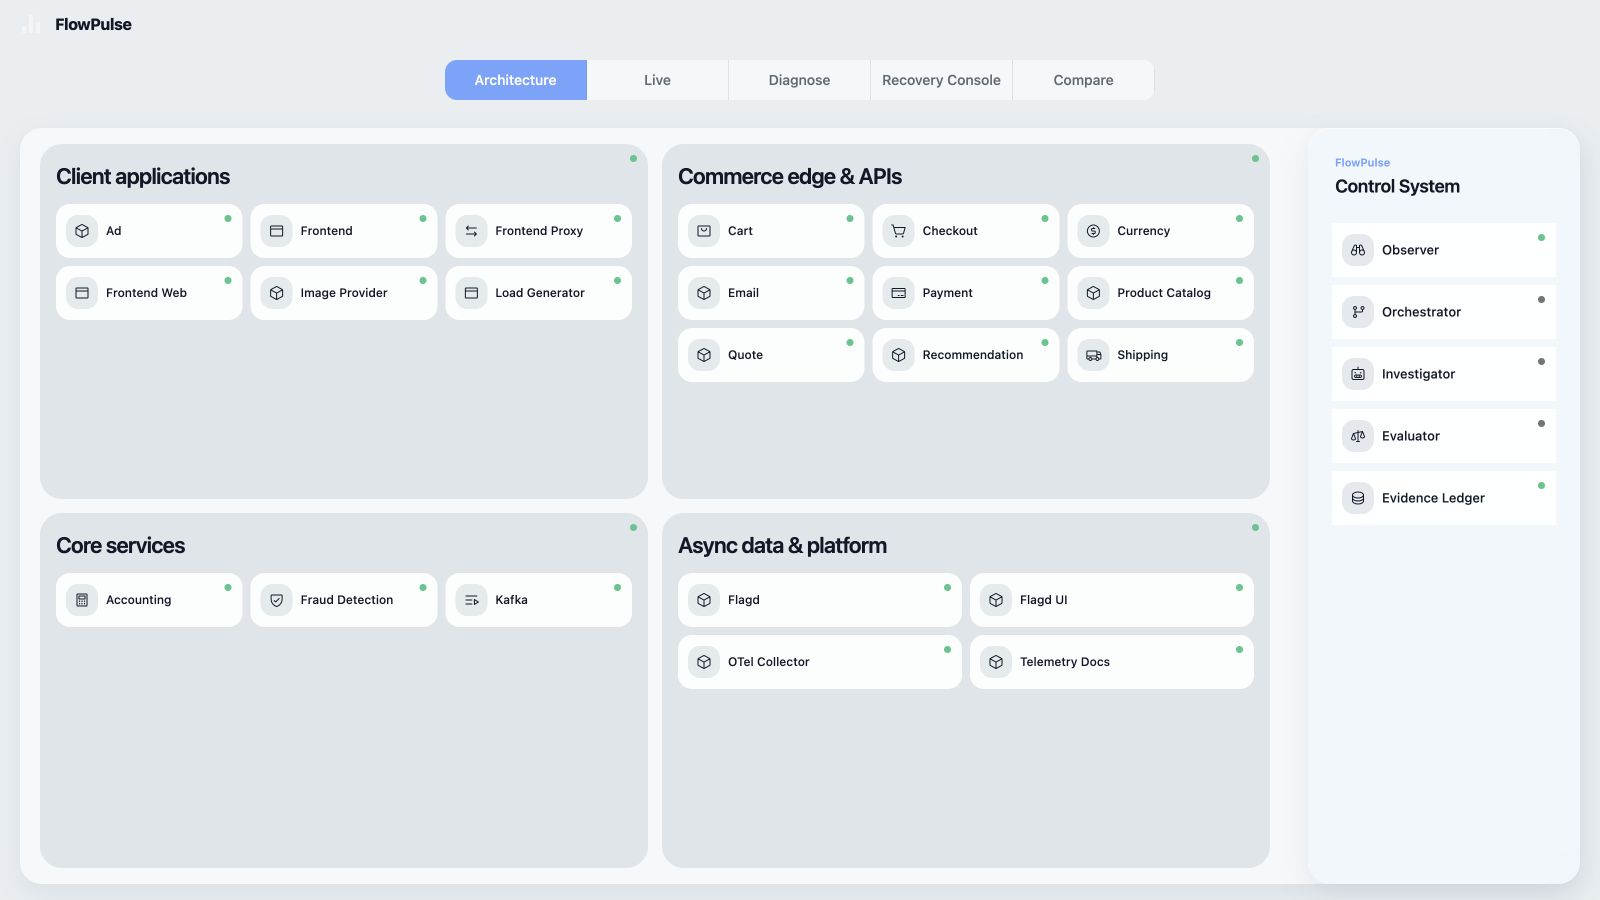
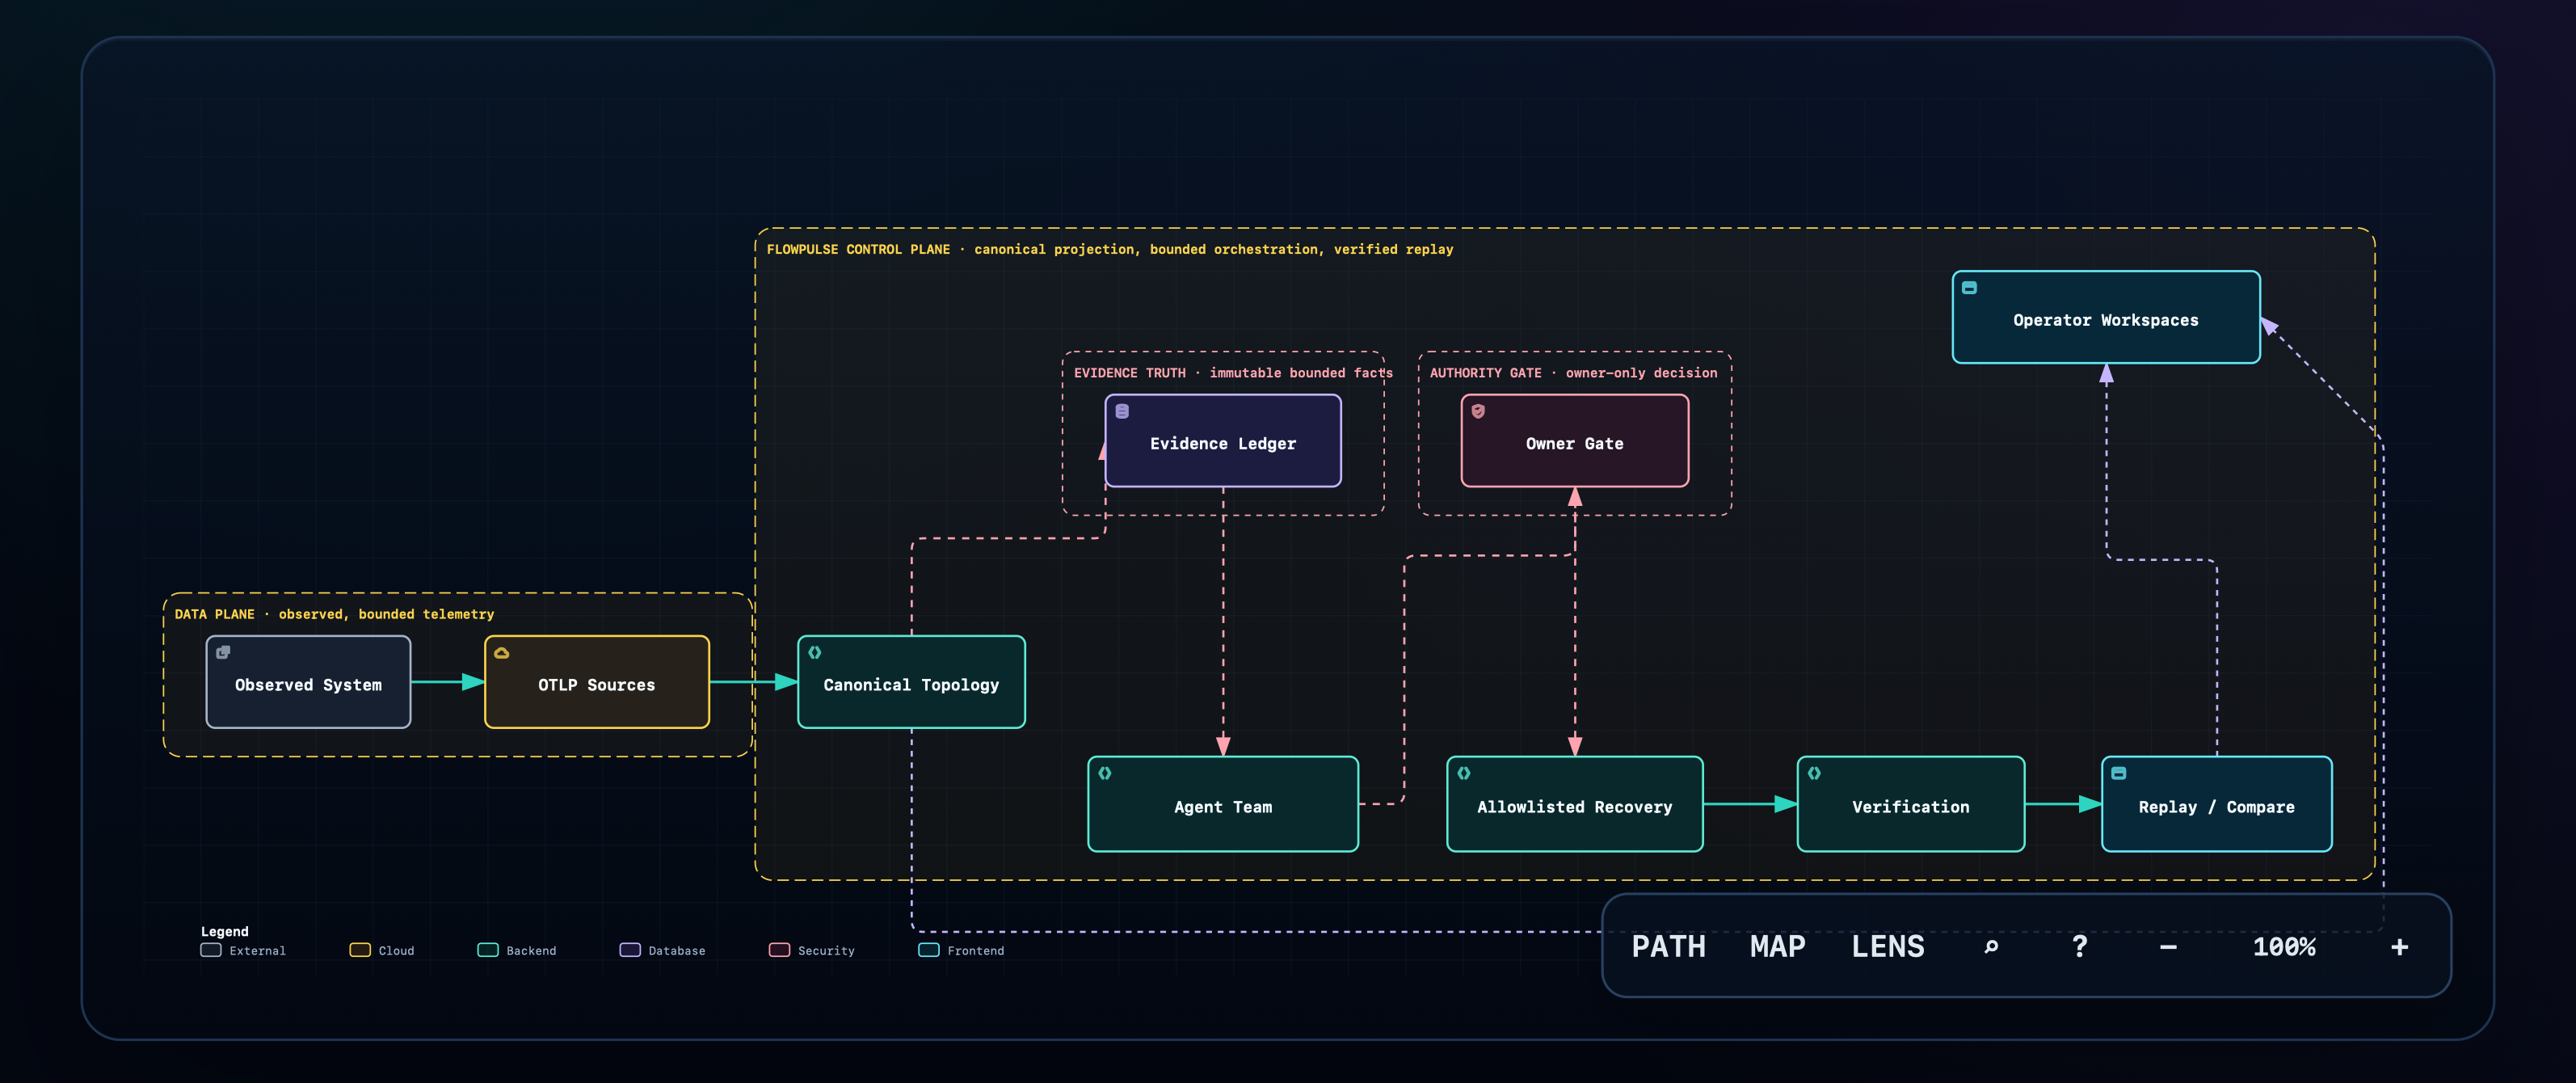
FlowPulse maps the observed system and its agent control plane before an incident begins.
-
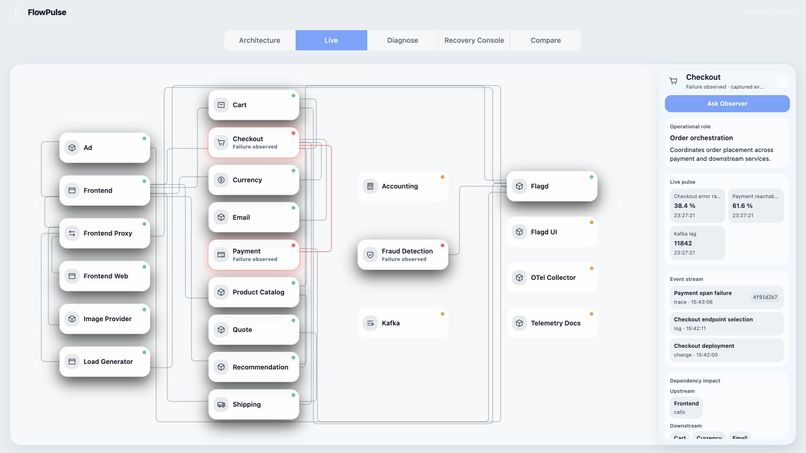
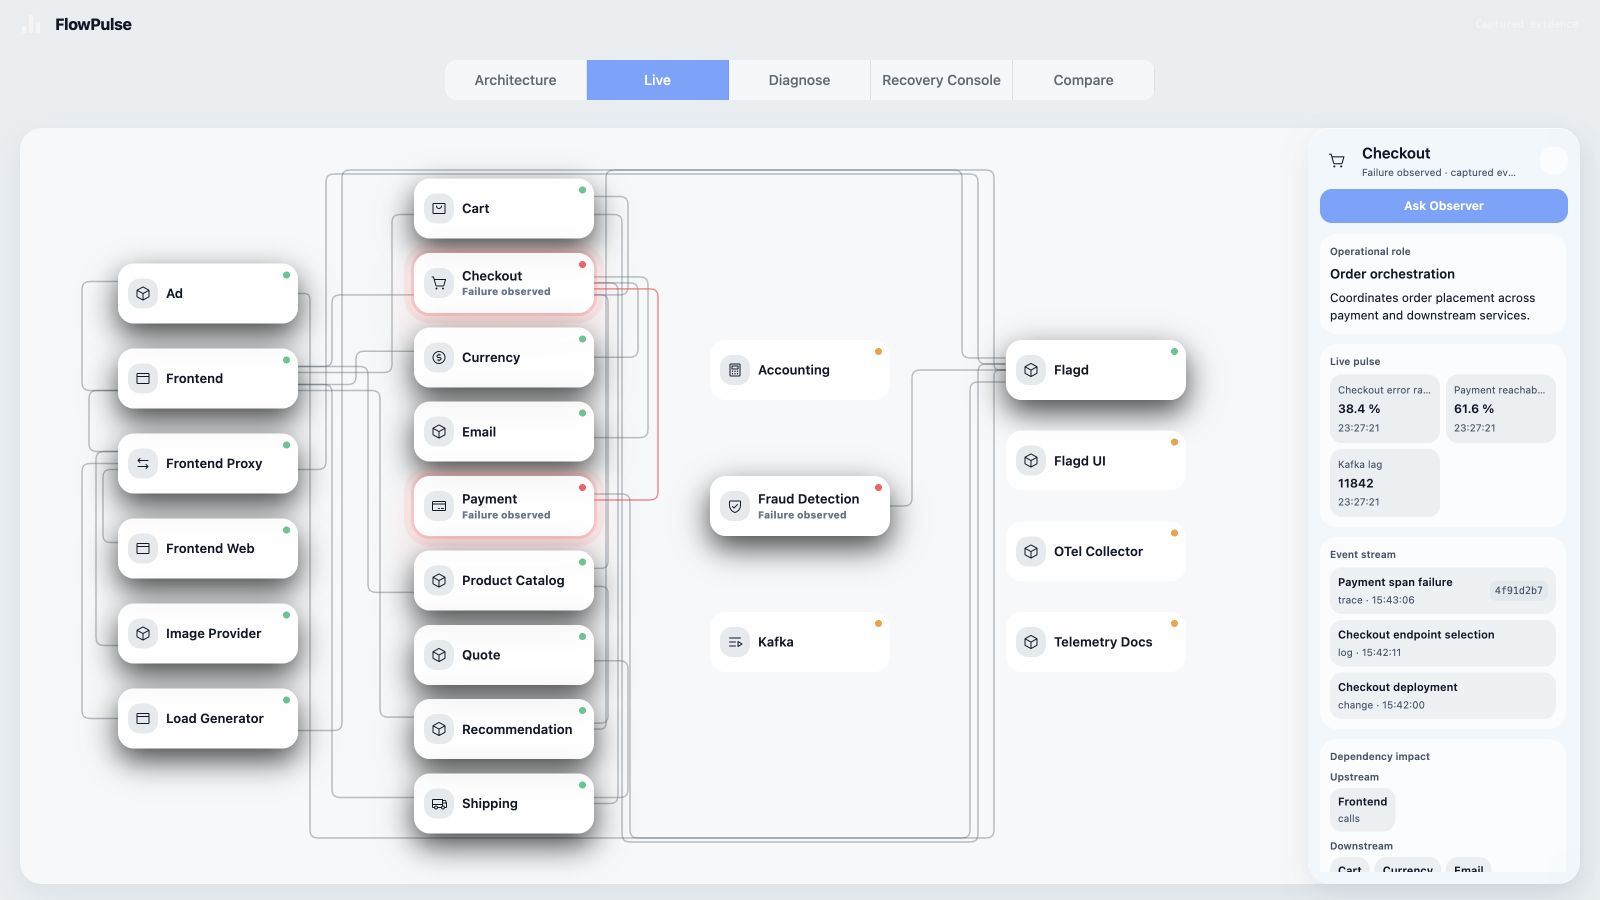
Real-time health and metrics reveal the affected checkout path as evidence arrives.
-
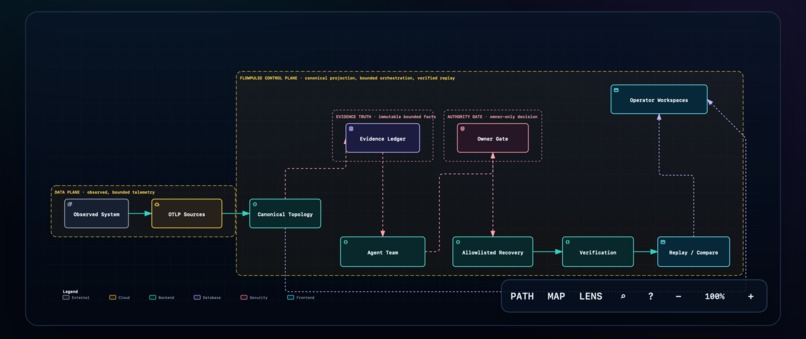
One evidence stream drives observation, investigation, evaluation, recovery, and verification
-
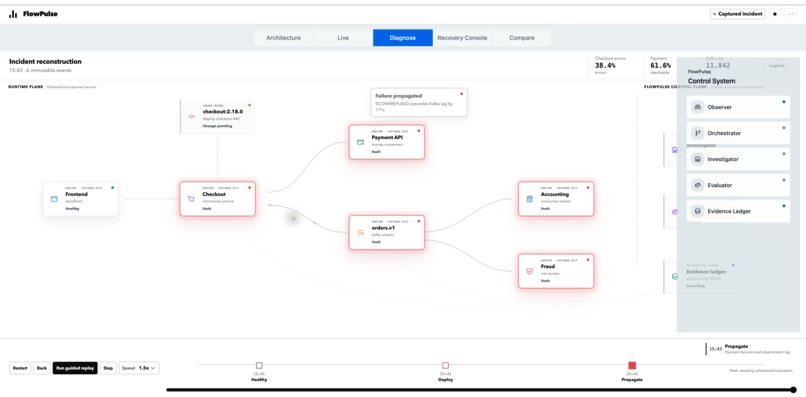
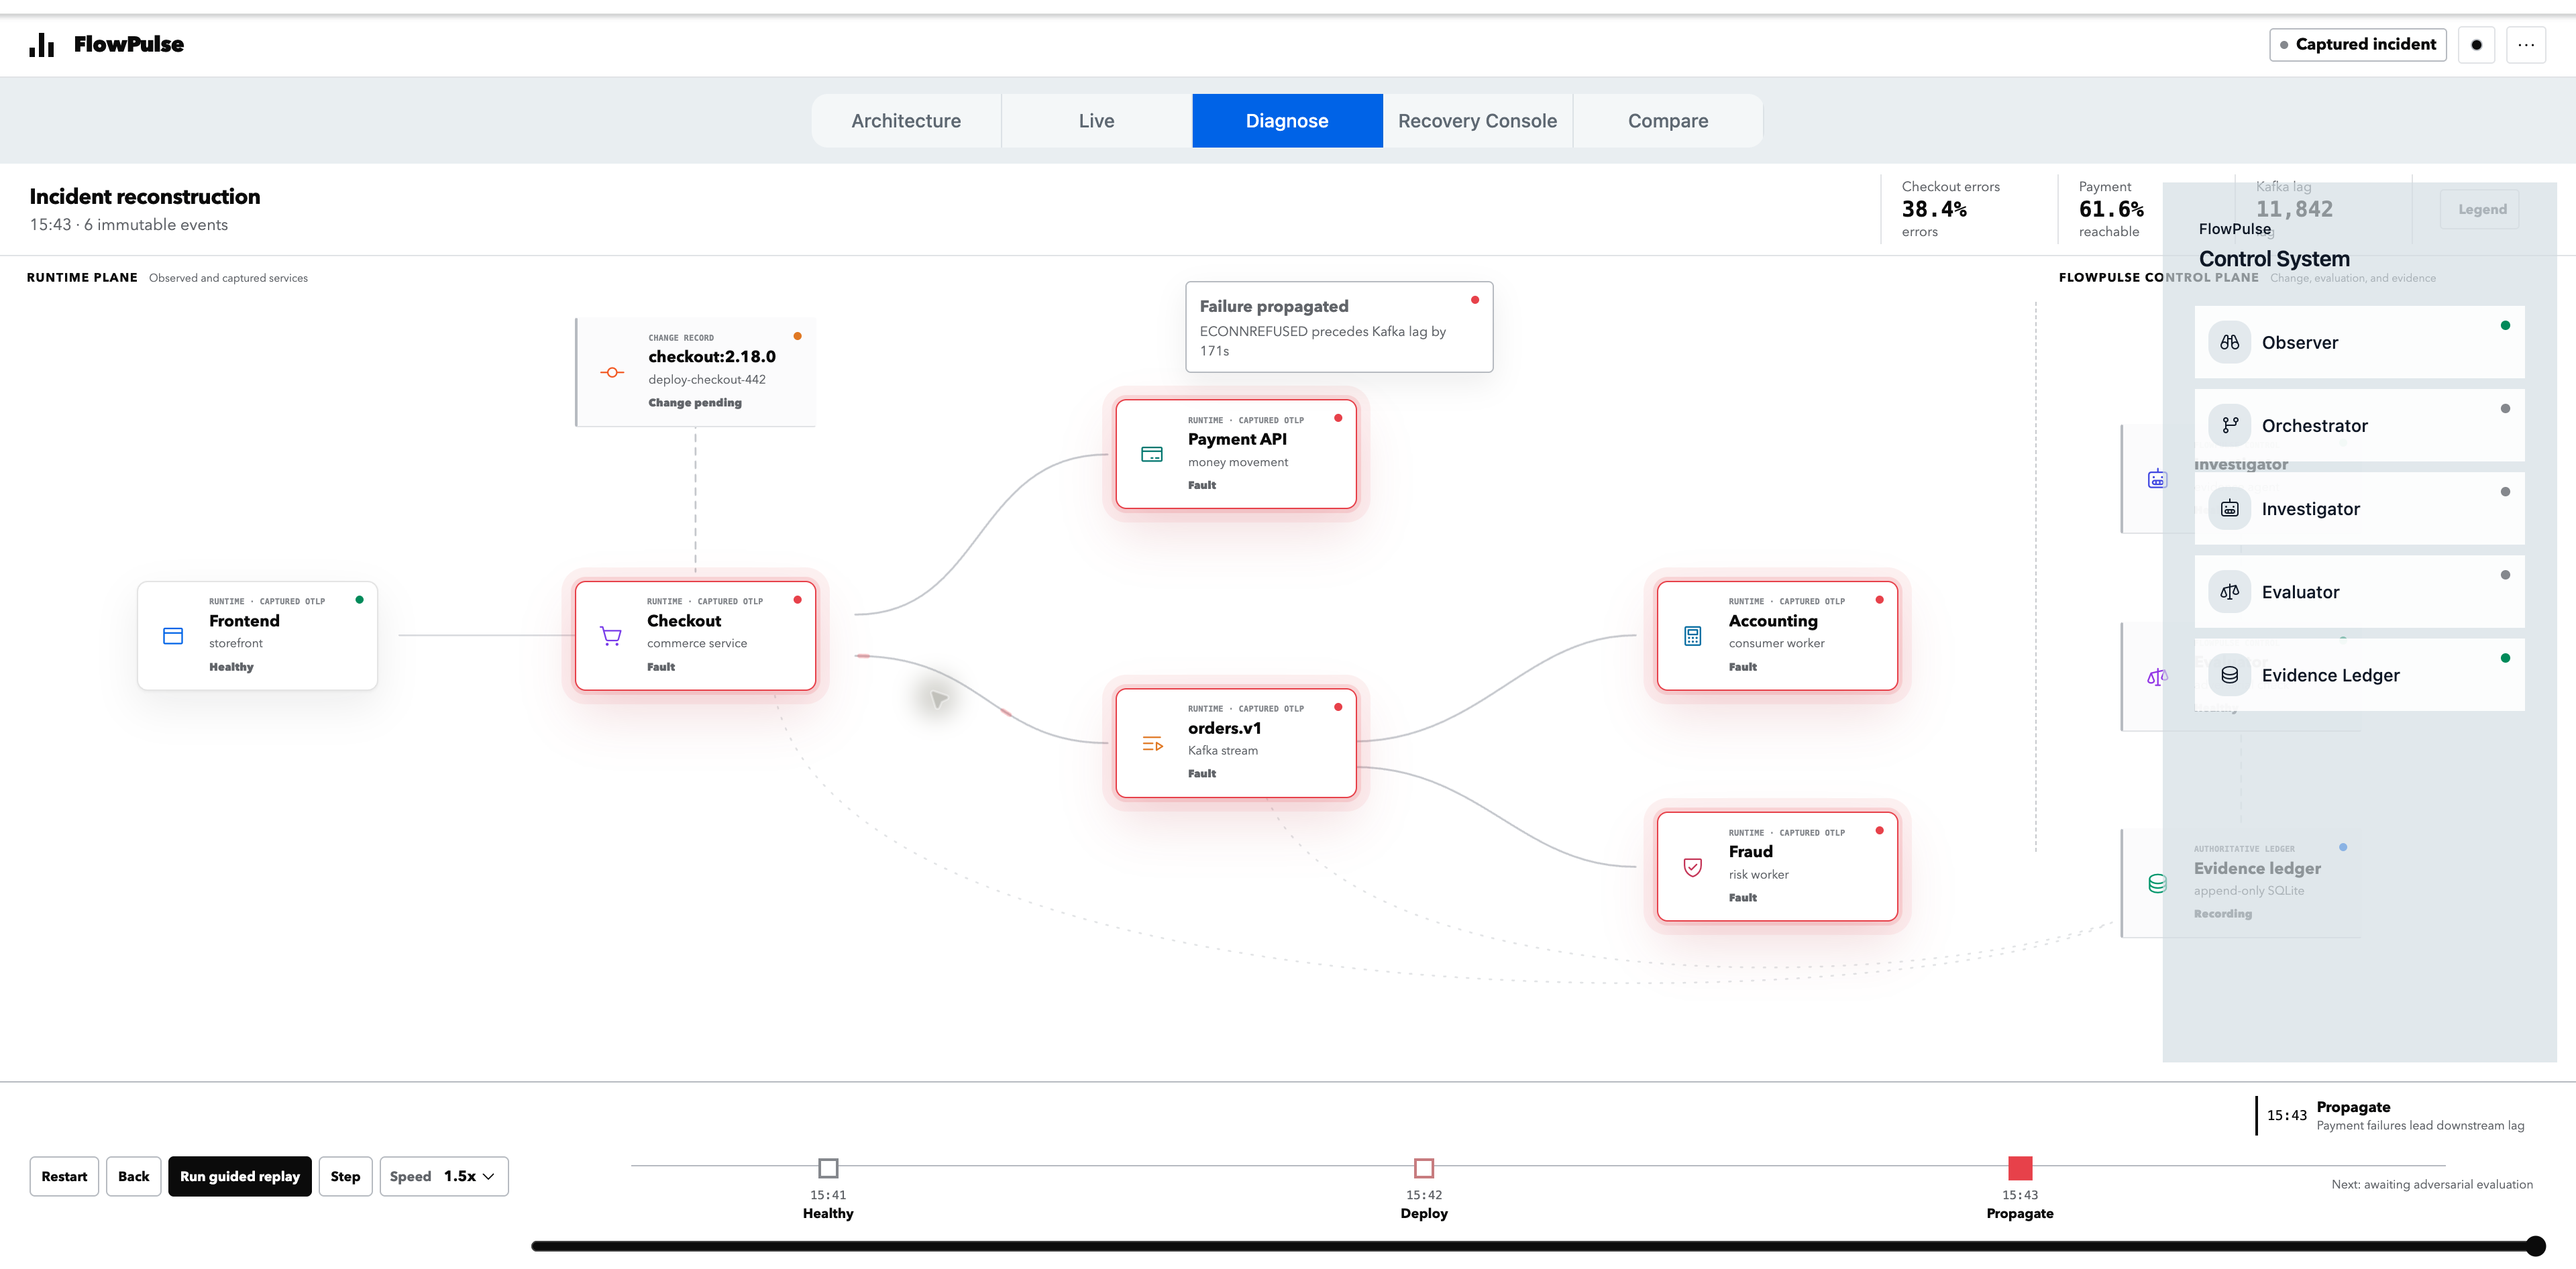
FlowPulse reconstructs the incident path and highlights failures propagating through Kafka to downstream services.
-
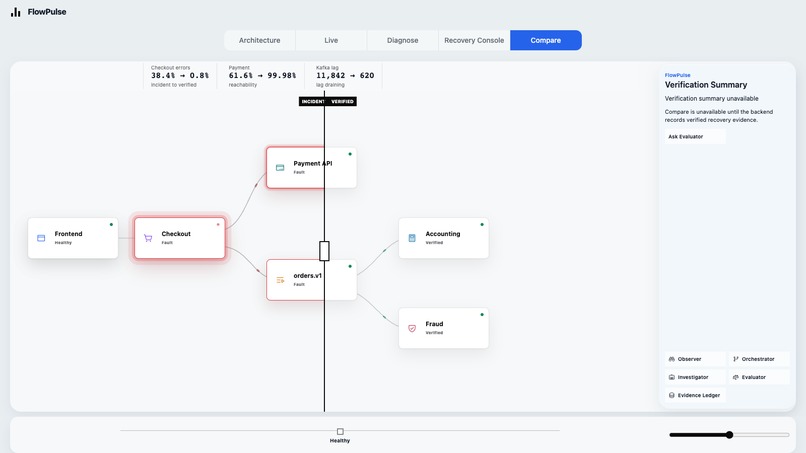
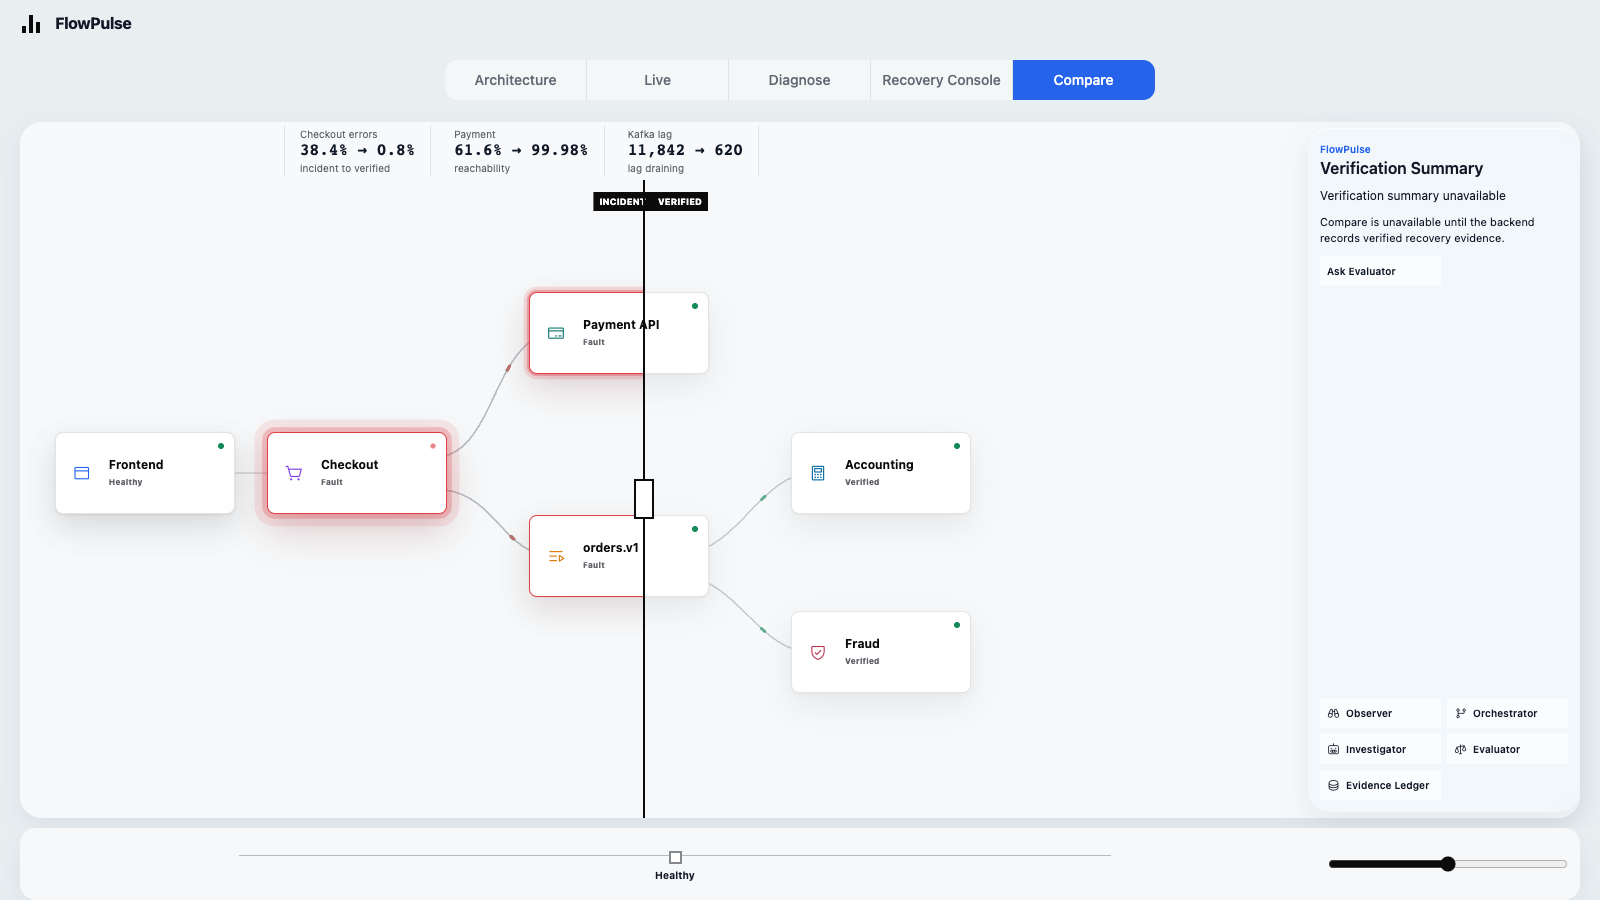
Incident and verified states are compared only after fresh telemetry proves recovery.
-
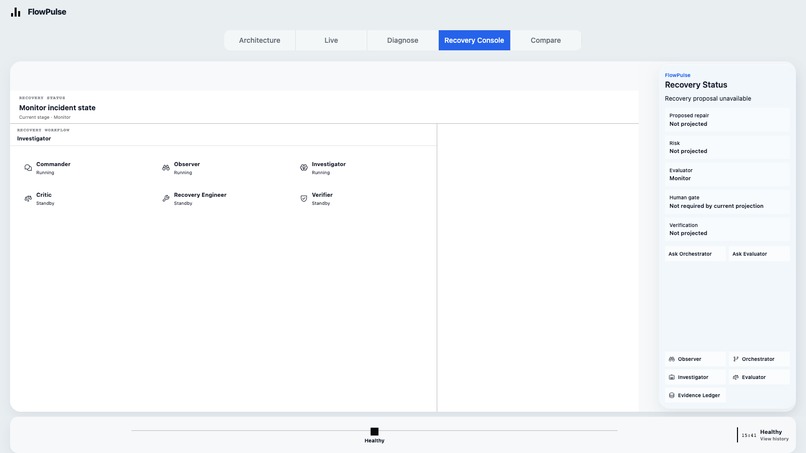
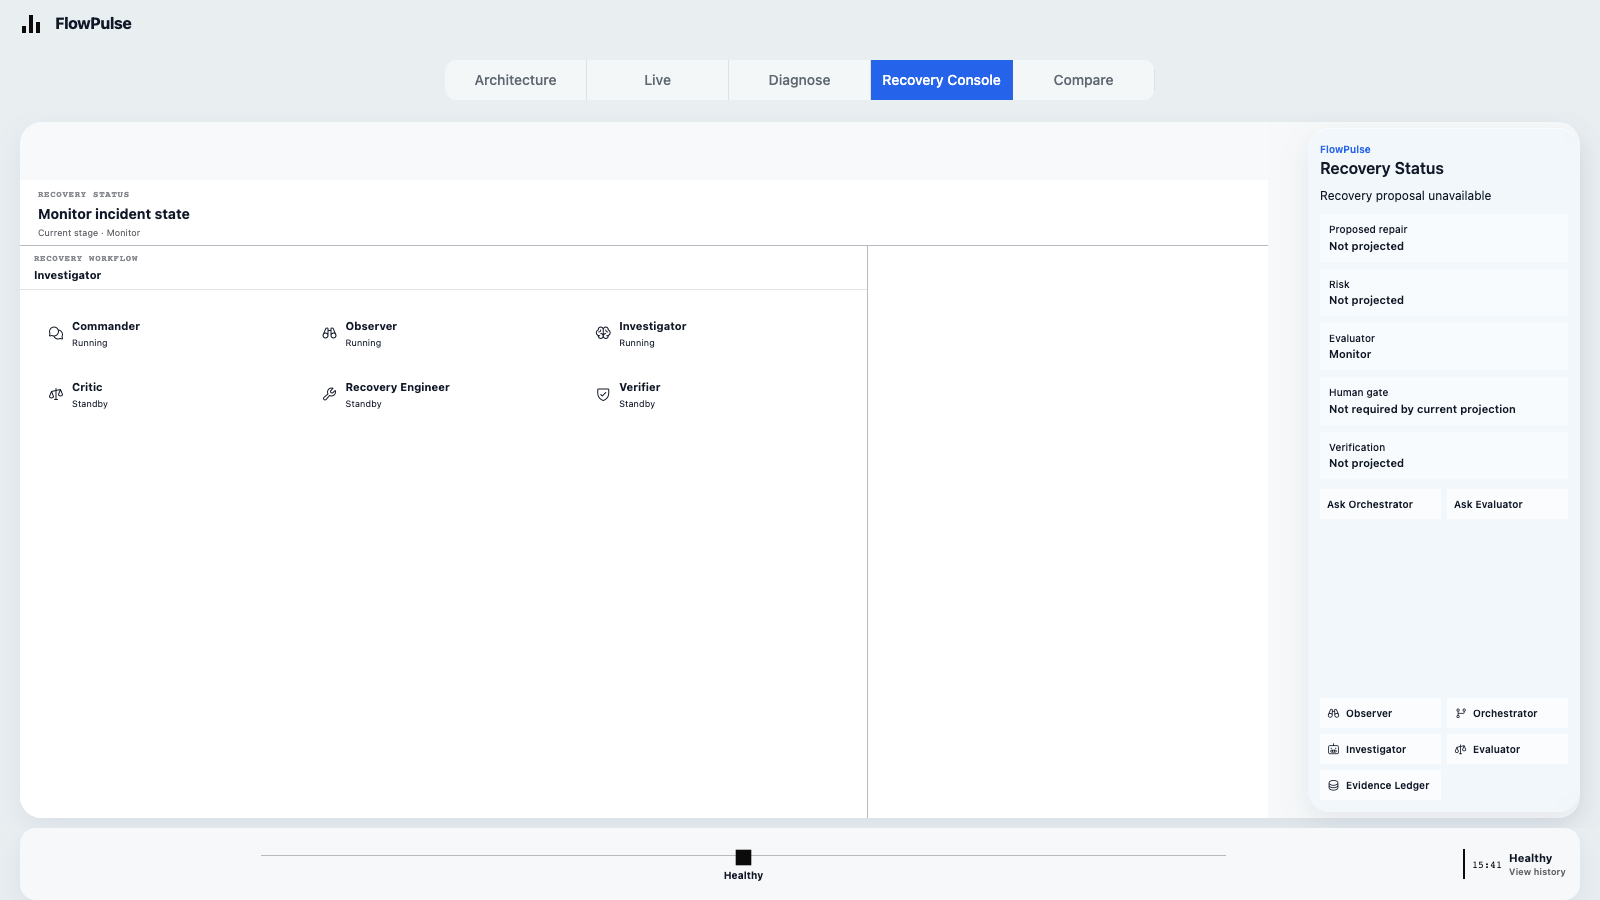
Specialized agents coordinate a bounded repair behind an owner gate, with every action recorded.
Inspiration
Production incidents are hard because the evidence is split across services, telemetry tools, deployment records, and people. An engineer often has to reconstruct the same timeline by hand while every tool shows only one part of the failure.
We built FlowPulse to give the whole incident one shared, inspectable workspace.
What it does
FlowPulse connects to a running system and builds a live view of its services, dependencies, health signals, and incident evidence.
When a failure appears, FlowPulse keeps the same system graph and moves it through a complete operating loop:
- Detect the affected path.
- Collect fresh logs, metrics, traces, and change evidence.
- Ask specialized agents to investigate and challenge the leading explanation.
- Present a bounded recovery plan.
- Require owner approval before a consequential change.
- Verify recovery with fresh telemetry.
- Compare the incident state with the verified state.
The interface is designed for an engineering manager or incident owner. It shows what is happening, what the agents know, which evidence supports the diagnosis, and which decision still needs a human.
Demo scenario
Our live demo uses the OpenTelemetry Astronomy Shop.
FlowPulse first captures a healthy checkout baseline. A controlled runtime configuration change then makes the payment service unreachable. The checkout path turns unhealthy, new telemetry arrives, and the incident appears in the same live graph.
The Observer gathers the evidence. The Investigator tests possible causes. The Evaluator rejects conclusions that are not supported by the evidence. The Orchestrator keeps the workflow moving and routes decisions to the right role.
The user can ask questions in the Agent Chat and receive an answer grounded in the selected component, the current incident, and cited evidence. A recovery is proposed only after the diagnosis passes its gates. The owner approves the bounded action, FlowPulse restores the configuration, and fresh OpenTelemetry data must prove that checkout can reach payment again.
The live scenario proves the Checkout to Payment path. A separate captured replay demonstrates a wider propagation path that includes Kafka, Accounting, and Fraud Detection. We keep those two evidence modes clearly separated.
How we built it
FlowPulse is a Node.js application with a single server and a shared event stream for Live, Agent Chat, Diagnose, Recovery, and Compare.
An append-only SQLite ledger stores evidence, agent activity, decisions, approvals, execution records, and verification results. Every screen is projected from the same run and incident state, so the interface cannot quietly invent a recovered result that the backend has not verified.
OpenTelemetry provides the live traces, metrics, and logs. The demo includes adapters for the Astronomy Shop runtime and a deterministic replay path for a reliable judge experience.
The agent team uses explicit roles and bounded tools. Codex provides the local, evidence-aware advisory interface used in the product. It receives the selected node, page, run context, and relevant evidence, then returns a role, tool activity, handoff, answer, and citations. The repair path remains deterministic and allowlisted. Codex is not the final repair authority.
We also exercised a GPT-5.6 provider path. When a response did not satisfy the required structured contract, FlowPulse failed closed instead of turning an uncertain model answer into a production action. That behavior shaped the evaluator, owner gate, and verification design.
Codex was also the main engineering environment for implementation, testing, debugging, visual iteration, and the final integration workflow.
Challenges
The hardest problem was maintaining one source of truth across the entire product. Live, Diagnose, Recovery, Compare, replay, and chat all had to agree on the same run, incident, topology, and ordered event history.
The second challenge was separating a useful AI recommendation from an authorized operational action. We solved that with evidence requirements, explicit role boundaries, adversarial evaluation, an owner gate, an allowlisted recovery action, and fresh verification.
The third challenge was making a technical system understandable in a short demo. We kept the graph stable across stages and moved detailed explanations into contextual panels and Agent Chat.
What we are proud of
- A real OpenTelemetry-backed incident path
- One canonical run and event stream across the full interface
- Evidence citations for agent answers and diagnosis
- Adversarial evaluation before recovery
- Human approval for consequential actions
- Deterministic, allowlisted remediation
- Fresh telemetry verification before Compare shows a recovered state
- A reproducible local judge path without requiring an API key
What we learned
An operations agent should not be judged by how confidently it explains a failure. It should be judged by whether it can show its evidence, survive a challenge, stop when the evidence is weak, respect the human decision boundary, and prove that the system recovered.
What is next
Next we would package the connector interface for additional OpenTelemetry environments and add integrations for incident management, source control, data platforms, and workflow systems. We would also expand the regression corpus so teams can test new policies against previous incidents before promotion.

Log in or sign up for Devpost to join the conversation.