-
-
-
-
-

whats next live data feed for real-time race information


Inspiration
“Be water, my friend.” — Bruce Lee
Racing isn’t just about speed — it’s about mindset in motion. Flow Performance reimagines telemetry as philosophy, decoding how a driver thinks, adapts, and flows on track. Inspired by Bruce Lee’s Jeet Kune Do (“The Way of the Intercepting Fist”), this system transforms raw racing data into seven mindset metrics — Aggression, Smoothness, Consistency, Focus, Adaptability, Strategy, and Composure — revealing the psychology behind every lap. It’s not just how fast you drive; it’s how you become one with the race. Racing, like martial arts, is a form of flow. Every movement — throttle, brake, steering — reveals the driver’s inner tempo. The Racing Way
There is a clear need for tools that could help a driver identify areas for improvement.to dig into the telemetry, lap times, and sensor data from past Toyota victories to build something out of the box.
What it does
A Bruce Lee–inspired “driver mindset profile” built entirely from telemetry. Utilize the Lap Timing Telemetry Data which includes high precision event timestamps, lap times, and vehicle IDs, essential for mapping detailed movement and performance. Every channel input — throttle, brake pressure, steering angle, GPS — is reimagined as a signal of human intent: throttle → aggression, steering smoothness → flow & composure, lap consistency → discipline, adaptability → decision-making under pressure, This approach flips traditional motorsports analysis on its head: Telemetry becomes a psychological canvas.
It’s part racing, part neuroscience, part philosophy, part art. No other tool uses racing data to build a Jeet Kune Do–inspired mental performance model — that is truly out-of-the-box.
How It Works
The app takes in high-frequency telemetry data — throttle, brake, steering, lap distance, and GPS — and transforms it into a psychological performance profile.
Each driver’s lap becomes a zoom lens into their decision-making under pressure.
🧩 Data Ingestion
Reads a 1.5GB telemetry CSV ,R1 and R2 Barber sessions containing over a million time-stamped sensor readings per session.
Exploratory Data analysis: Uses Pandas and NumPy to filter data by vehicle_id, telemetry_name, and session.
Converts every row (throttle, brake, steering, etc.) into synchronized timelines ,one json for each driver for feature extraction.
Feature Computation
Extracts core behavioral features:
- mean_throttle → average driver aggression
- mean_brake → braking discipline
- steering_variability → car control precision
- lap_distance_max → track coverage and endurance
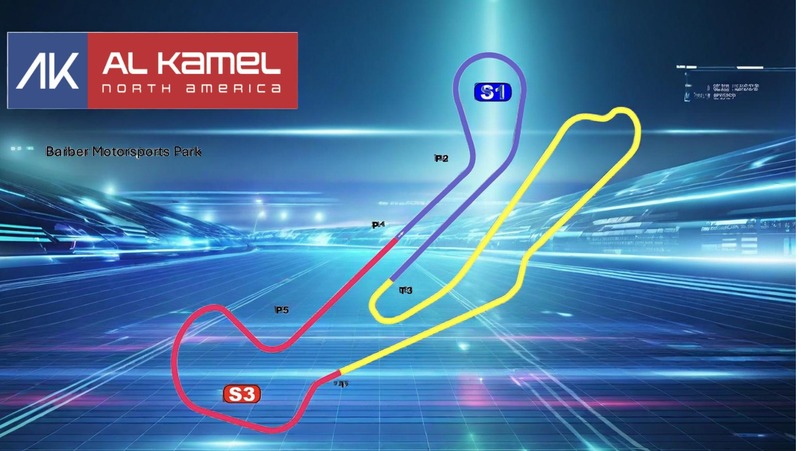
GPS (VBOX_Lat_Min, VBOX_Long_Minutes) is mapped to reconstruct a miniature track layout.
Mindset Metrics Calculation
Each feature is normalized (0–1) and combined into seven mindset metrics:
Aggression –> derived from throttle intensity
Smoothness – inverse of steering variability
Consistency – based on lap repeatability
Focus – derived from lap completion and distance
Adaptability – AI-learned change in inputs under variable conditions
Strategy – braking + throttle modulation balance
Composure – small variance reduction under stress
JSON Profiling & Dashboard Integration
- Outputs a compact JSON schema per driver:
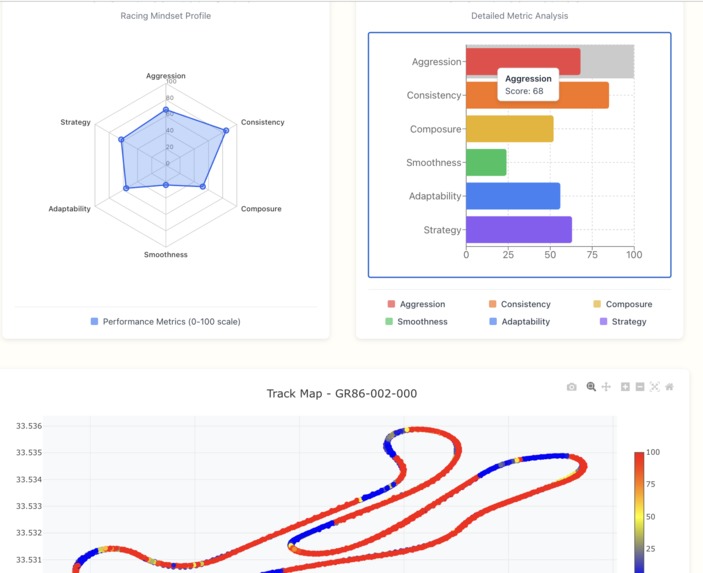
{
"vehicle_id": "GR86-002-000",
"scores": {
"aggression": 0.74,
"smoothness": 0.75,
"consistency": 0.62,
"focus": 0.93,
"adaptability": 0.68,
"strategy": 0.93,
"composure": 0.85
},
"overall_profile": "Strategic Driver"
}
Each JSON feeds directly into a React dashboard, visualizing:
- A radar chart for mindset balance
- A mini GPS track heatmap showing throttle intensity by color
- An AI-generated “Racing Persona” label (e.g., Strategic Driver, Aggressive Driver, etc.)
Scalable Architecture
- Runs as a modular Google Collab (or Jupyter) Notebook pipeline for local processing.
- Future-ready for serverless deployment (Vertex AI / AWS Lambda) to analyze entire race weekends in real time.(just upload your 1.5GB CSV)
Dynamic Driver Leaderboard: ranked by overall composite score
Export Report: download Racing mindset report
- Full/ summary / Chart
How we built it
Built with Data & Machine Learning
🐍 Python — core data processing and analysis
🧮 Pandas / NumPy — telemetry aggregation, feature engineering
🤖 *Scikit-learn * — for future driver-type clustering and modeling
📊 Matplotlib / Plotly — radar, track, and mindset visualizations
Frontend Visualization
⚛️ React — for the Racing Way Dashboard
🎨 Recharts — interactive radar and telemetry map overlays
🌍 Plotly — mini- track heatmap for lap races with throttle intensity coloring
Data Pipeline & Storage
☁️ CSV / JSON schema — compact analytics format for multi-driver insights
🧠 AI Mindset Engine — transforms telemetry → psychology via seven metrics: Aggression, Smoothness, Consistency, Focus, Adaptability, Strategy, Composure
Challenges we ran into
Selecting and Structuring the Dataset
Our first challenge after choosing the dataset was choosing which telemetry channels truly reflect driver mindset. We narrowed down thousands of data points to a focused psychological set:
Throttle (APS), Brakes (PBrake_F / R), Steering_Angle, Lap Distance, and GPS —
signals that could mirror aggression, control, and flow without overwhelming the model.
We also had to handle 1.5GB of CSV data per session,cleaning and reshaping it efficiently for per-driver aggregation.
Translating Physics into Psychology
Telemetry shows how someone drives — not who they are.
Our biggest conceptual challenge was designing mindset metrics that could bridge this gap.
We experimented with mathematical mappings (e.g., throttle variance → aggression, steering stability → smoothness)
until the system produced profiles that felt human intuitive. the data started to tell stories — each lap a reflection of the driver’s focus, composure.
Accomplishments that we're proud of
Interactive dashboard in posts. How to build a psychometrics analytic. Development of seamless experience transforms raw racing data to driver mindset in devvit
What we learned
Python Pandas insights into building driver mindset with its limitations and forte
Telemetry data: support for creating leaderboard and charts
We realized that telemetry isn’t just numbers — it’s a human fingerprint in motion.
A spike in throttle isn’t just acceleration; it’s emotion, instinct, and decision-making captured in milliseconds.
By blending psychology and engineering, we learned that data can reveal the mindset behind the vehicle.
Why It’s Innovative
The Racing Way reimagines telemetry — not just as data, but as digital psychology. It treats every lap as a behavioral pattern, not just a performance metric. While traditional race analytics focus on lap times, corner speeds, and vehicle setup, The Racing Way focuses on the mindset behind the motion — decoding how a driver thinks through the steering wheel.
What's next for Flow Performance Index
The next step is to turn mindset analytics into real-time feedback — a driver’s inner GPT.
future development for the Racing Line Visualization App will focus on leveraging the remaining high-stakes racing data to evolve the tool from post-event analysis into a Predictive model to do Lap simulation.
This project shows that telemetry can reveal not just lap performance, but the mindset, flow, and decision-making of the driver in the heat of competition — transforming data into a human story.
Why This Project Matters
This project redefines what racing data can be. It shows that telemetry is not only about lap times — it can reveal mindset, intention, and flow. It bridges engineering and humanity, turning a driver’s motion into a story. By turning telemetry into a psychological and philosophical profile, Flow Performance opens a new dimension of motorsport data
Log in or sign up for Devpost to join the conversation.