Inspiration
Flooooooooow was inspired by the difficulty of understanding data flow in code. Traditional debuggers show step-by-step execution, but don’t visualize how data moves between functions and variables. We wanted a tool that shows:
- How values flow through code
- Function call relationships
- Variable transformations over time
- An interactive, animated timeline of execution
The goal was to make code execution visible and intuitive, especially for learning, debugging, and code reviews.
What it does
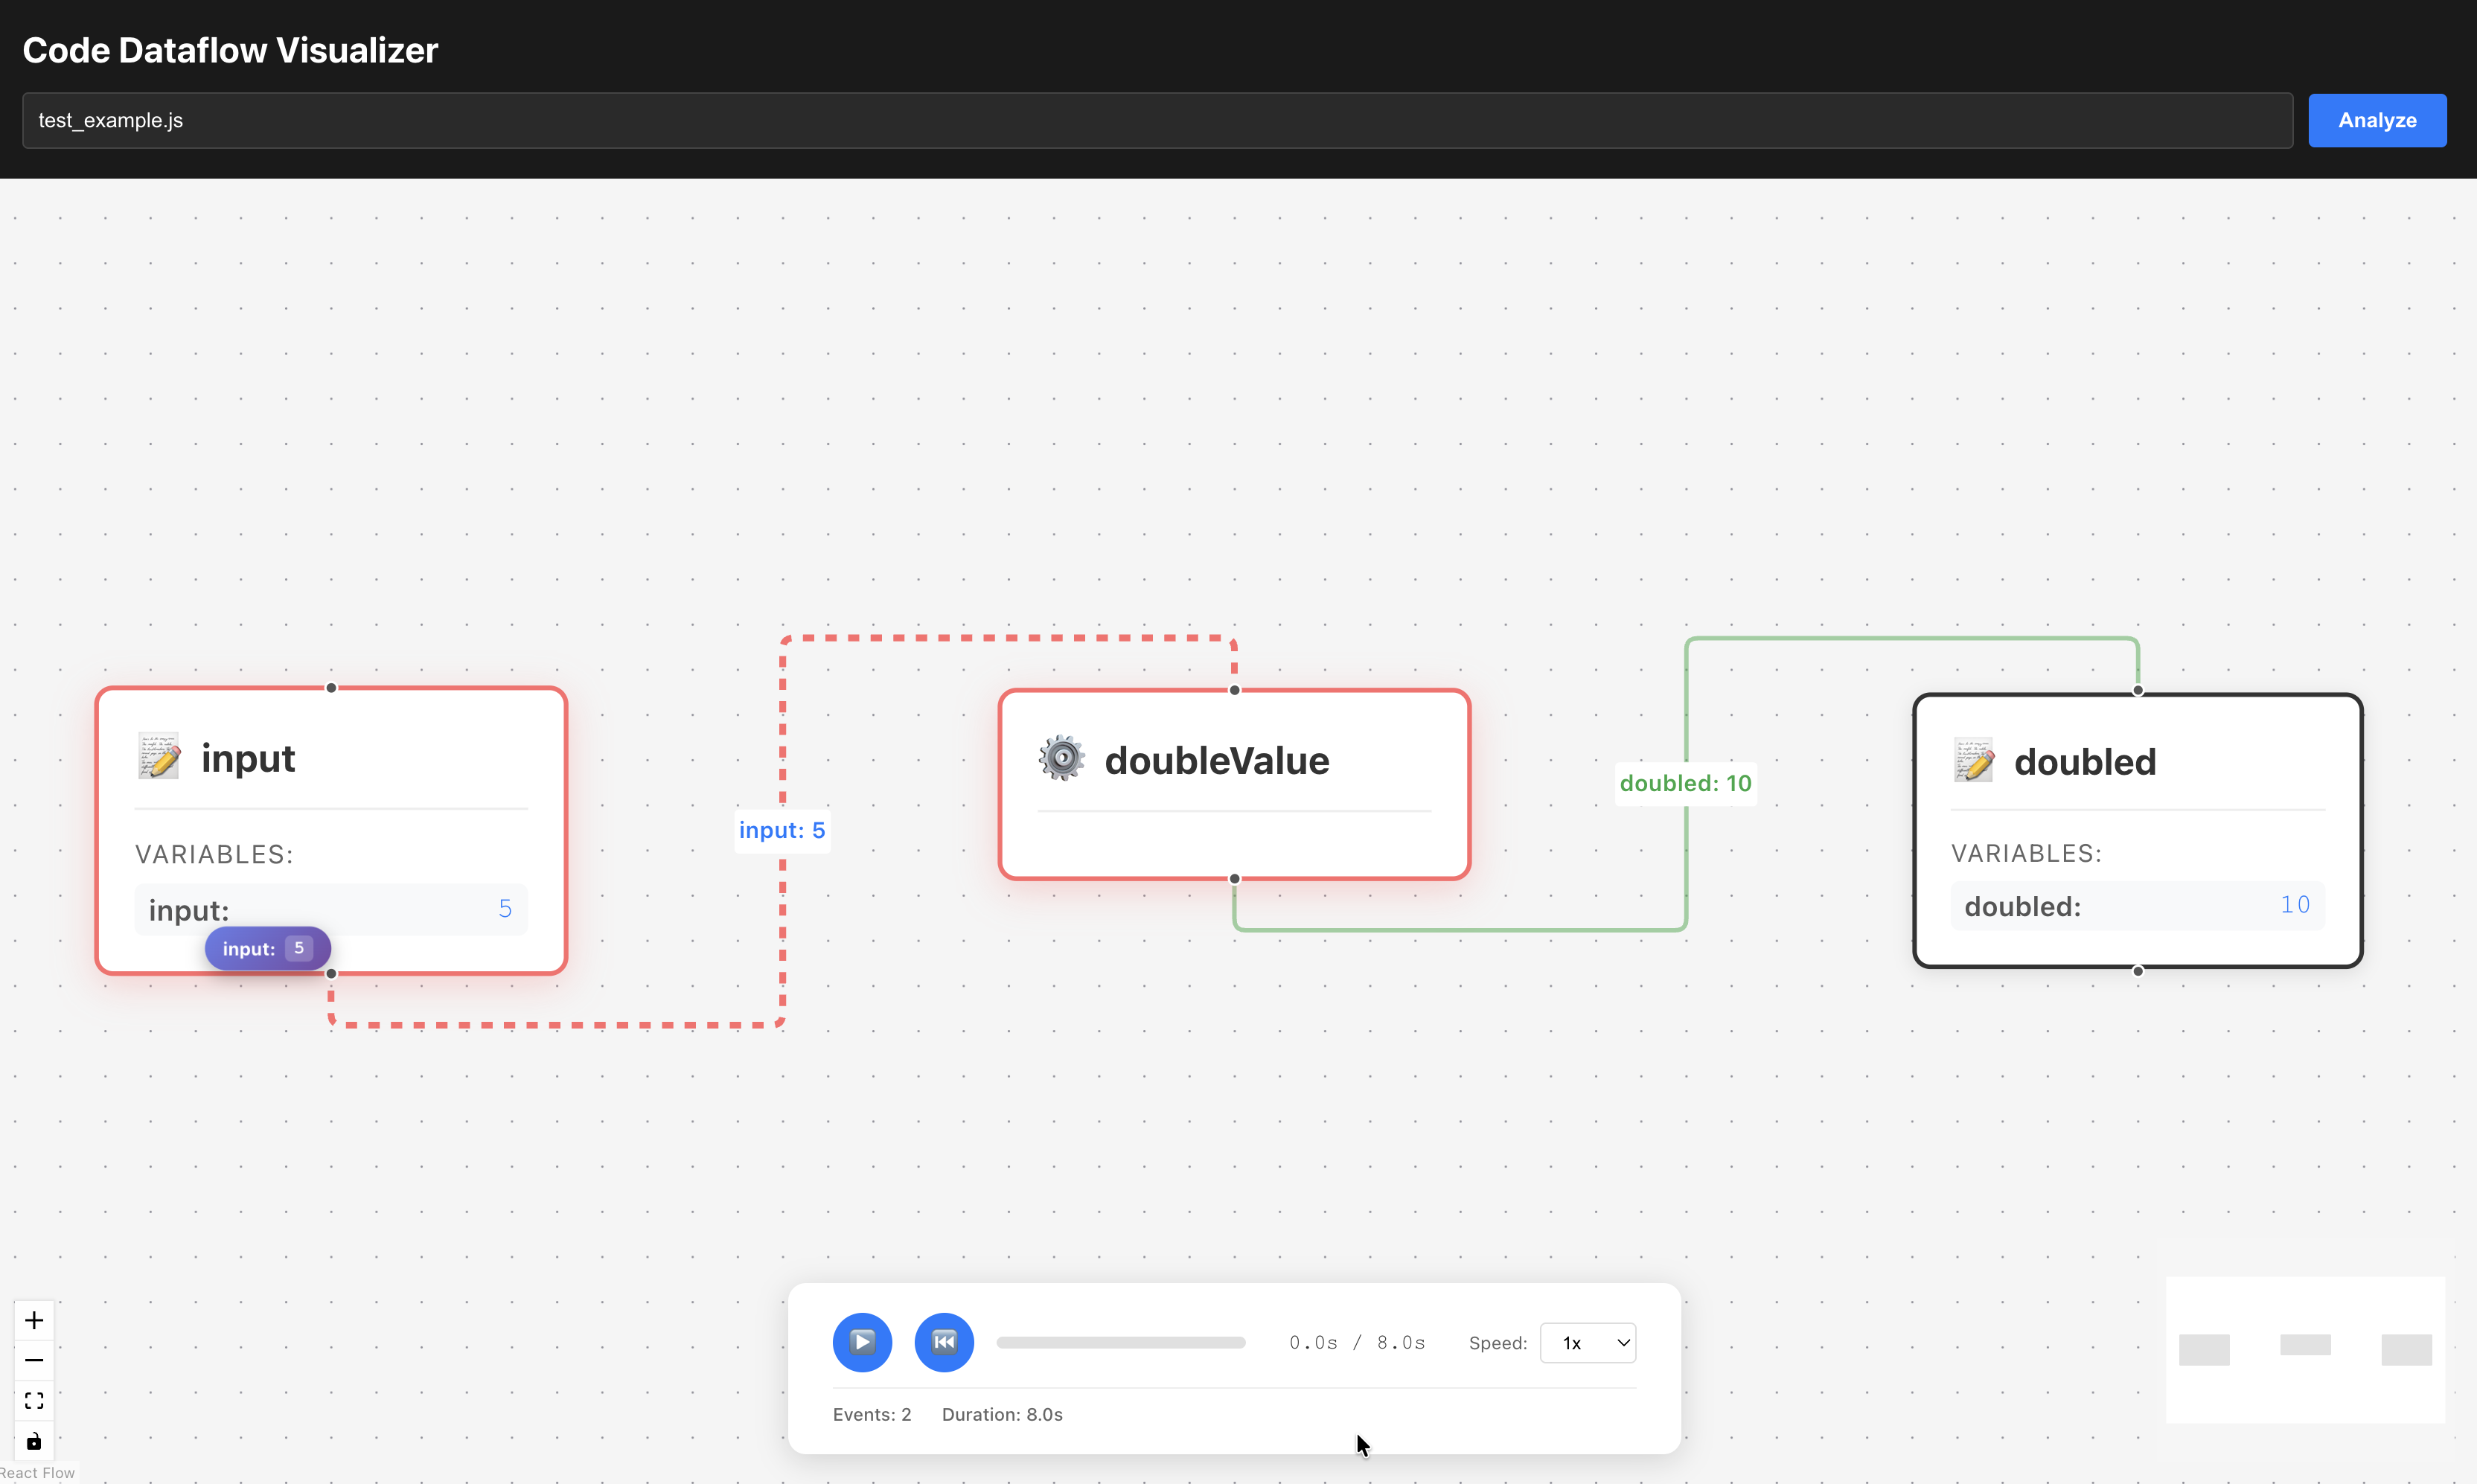
Flooooooooow is a code dataflow visualizer that combines static analysis and runtime tracing to create an interactive visualization of program execution. It:
- Analyzes source code to extract the AST, functions, and variables
- Executes the code with instrumentation to capture runtime events
- Merges static structure with runtime data
- Visualizes the flow as an interactive graph with:
- Nodes for functions and variables
- Edges showing data flow
- Animated value markers moving along edges
- Timeline controls for play/pause/seek
- Real-time value display as data moves
Users can see how values like 5 flow from input → doubleValue() → doubled (10), with smooth animations showing the transformation.
How we built it
Architecture Overview
The system has three layers:
- Backend (Rust): Static analysis, code instrumentation, and execution
- API Layer (Rust/Axum): REST API serving enriched AST and timeline data
- Frontend (React): Interactive visualization with React Flow
Detailed Build Process
1. Static Analysis with Tree-sitter
We use Tree-sitter to parse JavaScript/TypeScript and build an AST:
// Parse source code into AST
let tree = parser.parse(source_code, None)?;

// Extract AST nodes, functions, and variables using Tree-sitter queries
let ast_nodes = extract_ast_nodes(&tree, source_code, file_path)?;
let function_definitions = extract_functions(&tree, source_code, file_path)?;
let variable_declarations = extract_variables(&tree, source_code, file_path)?;
Tree-sitter queries identify:
- Function declarations (name, parameters, location)
- Variable declarations (name, scope, location)
- AST node structure (parent-child relationships)
This creates a static view of the code structure.
2. Code Instrumentation (Our Custom AST-Based Approach)
We instrument the code using the AST to add tracing hooks. This is the core of our approach:
Step 1: AST-guided instrumentation
- Use the AST to find function definitions, variable declarations, and return statements
- Map line numbers to function names for return statement instrumentation
- Create lookup sets for functions and variables
Step 2: Line-by-line instrumentation For each line of source code, we:
a) Instrument return statements:
// Original: return doubled;
// Instrumented: return __tracer__.functionReturn('doubleValue', doubled, 7);
We detect return statements within function bodies using the function-to-line mapping.
b) Instrument function calls:
// Original: const doubled = doubleValue(input);
// Instrumented:
//   __tracer__.functionCall('doubleValue', [input], 18);
//   const _temp_18 = doubleValue(input);
//   const doubled = __tracer__.variableWrite('doubled', _temp_18, 18);
We:
- Find function call patterns using AST-identified function names
- Parse argument expressions
- Wrap calls to log arguments
- Capture return values and assign them with variable write tracking
c) Instrument variable assignments:
// Original: const input = 5;
// Instrumented: const input = __tracer__.variableWrite('input', 5, 17);
We detect const, let, and var declarations and wrap the assignment.
The instrumentation preserves:
- Original code semantics
- Indentation and formatting
- Variable scoping
- Function call order
3. Code Compilation and Execution with QuickJS
We execute the instrumented code using rquickjs (Rust bindings for QuickJS):
Step 1: Initialize JavaScript tracer
// Create a tracer object in JavaScript that collects events
const __tracer__ = {
    events: [],
    startTime: 0,
    functionCall: function(name, args, line) { /* log event */ },
    functionReturn: function(name, returnValue, line) { /* log event */ },
    variableWrite: function(name, value, line) { /* log event */ },
    getEvents: function() { return JSON.stringify(this.events); }
};
Step 2: Execute instrumented code
// Execute the instrumented JavaScript code
ctx.eval::<Value, _>(instrumented_code.as_bytes())?;

// Retrieve collected events
let events_json = ctx.eval::<String, _>("__tracer__.getEvents()")?;
Step 3: Parse and process events
- Parse JSON events from JavaScript
- Convert timestamps (microseconds → milliseconds)
- Map events to Rust structures
- Sort by timestamp
4. AST Enrichment
We merge runtime events back into the AST:
// Merge runtime events into AST nodes by location (line number)
let enriched_ast_nodes = merge_runtime_into_ast(
    &ast_nodes,
    &runtime_events,
    &file_path
);
Each AST node gets a runtime_events array containing events that occurred at that location, combining static structure with runtime behavior.
5. Timeline Creation
We create a chronological execution timeline:
let timeline = ExecutionTimeline {
    events: timeline_events,  // Sorted by timestamp
    total_duration_ms: max_timestamp
};
This provides the sequence of events for visualization.
6. Frontend Visualization
The React frontend:
a) Transforms data:
- Converts timeline events into React Flow nodes and edges
- Creates nodes for functions and variables
- Creates edges based on data flow (variable → function → variable)
b) Animation system:
- Calculates which edge is active based on timeline progress
- Animates value markers along edges
- Updates node highlights as data flows
- Shows current values at each step
c) Timeline controls:
- Play/pause/seek
- Speed control
- Progress visualization
Key Technical Decisions
- Tree-sitter for parsing: Fast, incremental parsing with language support
- Custom instrumentation: Full control over what we capture
- QuickJS for execution: Lightweight, embeddable JavaScript engine
- AST-based instrumentation: Uses static analysis to guide where to instrument
- React Flow for visualization: Built for node-based diagrams
Challenges we ran into
Code instrumentation complexity
- Challenge: Correctly instrumenting function calls, returns, and variable assignments without breaking code semantics
- Solution: AST-guided approach with careful string manipulation and validation
Capturing all runtime events
- Challenge: Some events (like function returns) weren't being captured
- Solution: Refined instrumentation logic to handle edge cases (nested calls, return statements, variable scoping)
Timestamp precision
- Challenge: Getting accurate timestamps for event ordering
- Solution: Used
performance.now()with microsecond precision, converted appropriately
Frontend animation synchronization
- Challenge: Smoothly animating value markers along edges while maintaining correct timing
- Solution: Calculated edge progress based on timeline position, with proper state management
Data flow edge detection
- Challenge: Determining which variables flow into which functions
- Solution: Analyzed timeline event sequence, matching argument values with variable values
Accomplishments that we're proud of
- Custom AST-based instrumentation: Building our own instrumentation system that uses static analysis to guide runtime tracing
- Seamless integration: Combining Tree-sitter (static) with QuickJS (runtime) in a unified pipeline
- Interactive visualization: Creating a smooth, animated visualization that makes data flow intuitive
- Real-time value tracking: Showing actual values (like
5→10) as they flow through the code - Timeline-based replay: Allowing users to scrub through execution and see data transformations at any point
What we learned
- AST manipulation: Deep understanding of how to use ASTs for code transformation
- JavaScript engine internals: How QuickJS executes code and how to instrument it effectively
- Code instrumentation trade-offs: Balancing instrumentation coverage with code complexity and performance
- Data flow analysis: Techniques for tracking how values move through programs
- Visualization design: How to make complex execution data understandable through animation and interaction
What's next for Flooooooooow
Enhanced event capture
- Improve instrumentation to capture all function returns and nested calls
- Add support for control flow (if/else, loops)
- Capture object property access and mutations
Multi-language support
- Extend beyond JavaScript/TypeScript to Python, Java, Go
- Language-specific instrumentation strategies
Advanced visualization features
- Multiple execution paths (branches)
- Call stack visualization
- Variable state history at each step
- Performance metrics overlay
Real-time debugging integration
- Live code execution with breakpoints
- Step-through debugging with visualization
- Integration with VS Code/Cursor
Educational features
- Code explanation generation
- Learning mode with guided tours
- Export visualizations as videos/GIFs
Performance optimizations
- Faster instrumentation
- Efficient event collection
- Large codebase support
Collaboration features
- Share visualizations
- Collaborative code review with data flow
- Team analytics on code execution patterns
The foundation is solid and combining AST analysis with runtime instrumentation and we're excited to expand Flooooooooow into a comprehensive tool for understanding code execution.
Built With
- javascript
- react
- rest
- rust
- vite
- websocket

Log in or sign up for Devpost to join the conversation.