-
-
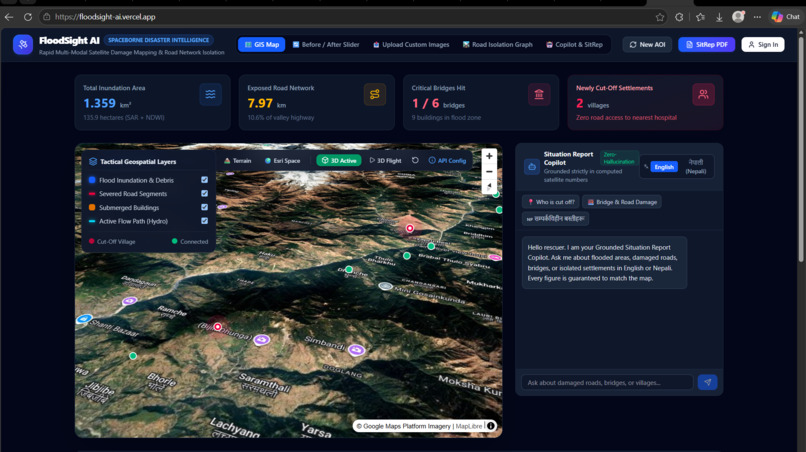
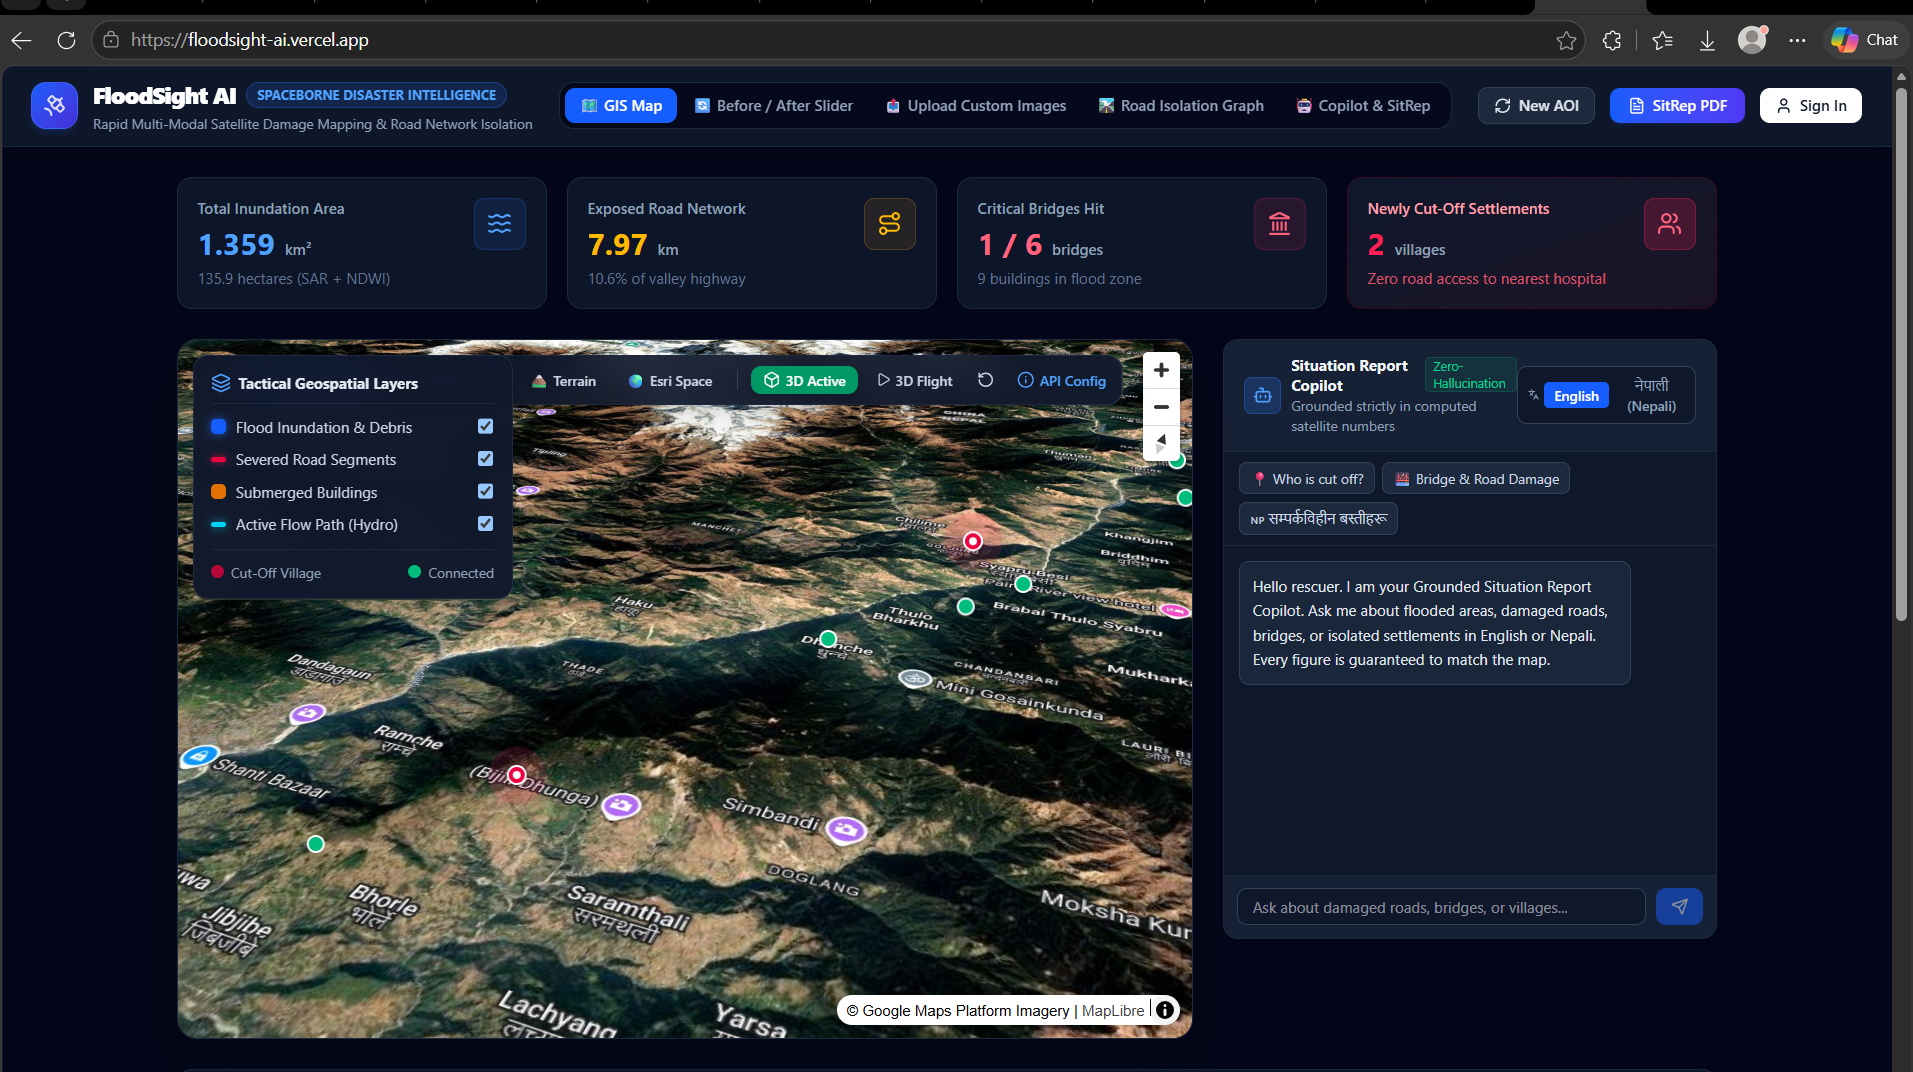
landing page where user can see the danger zone place
-
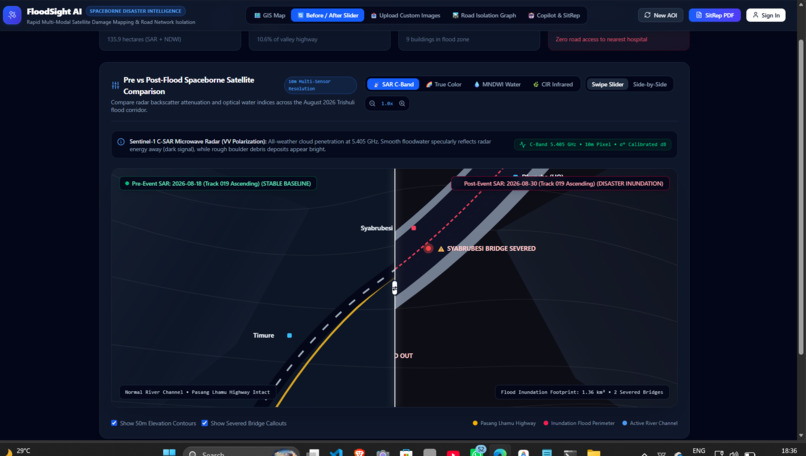
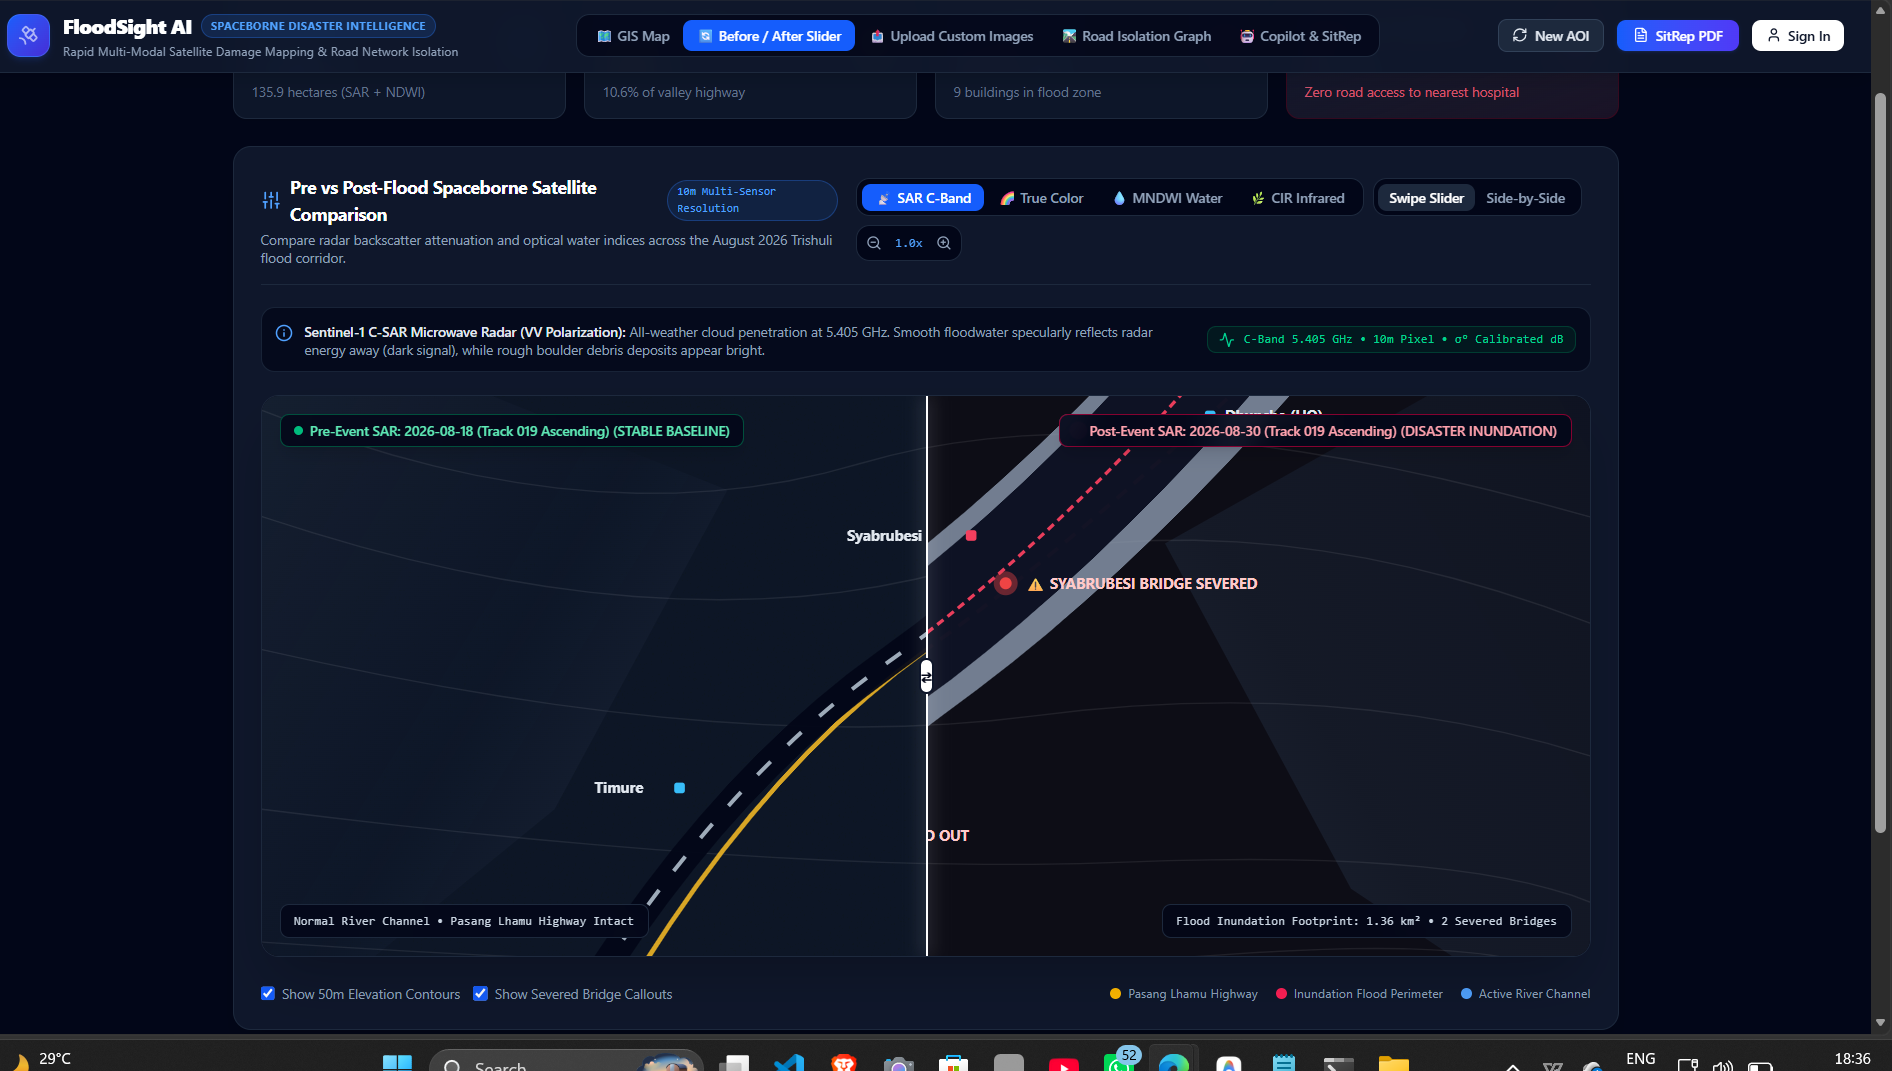
heatmap and comparsion from before and after
-
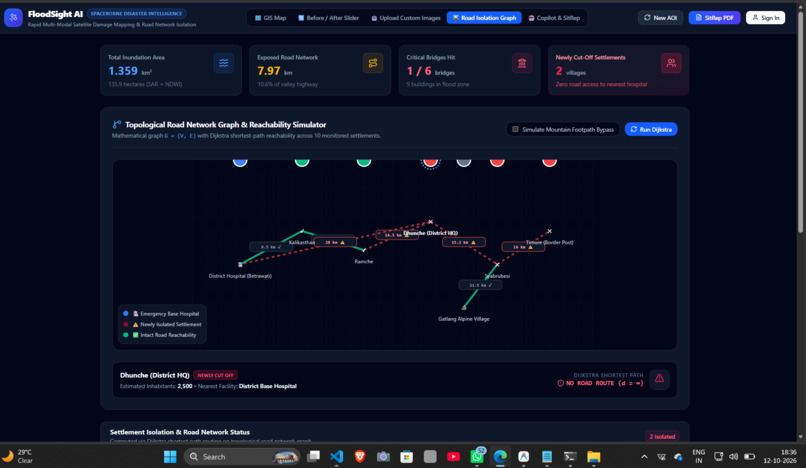
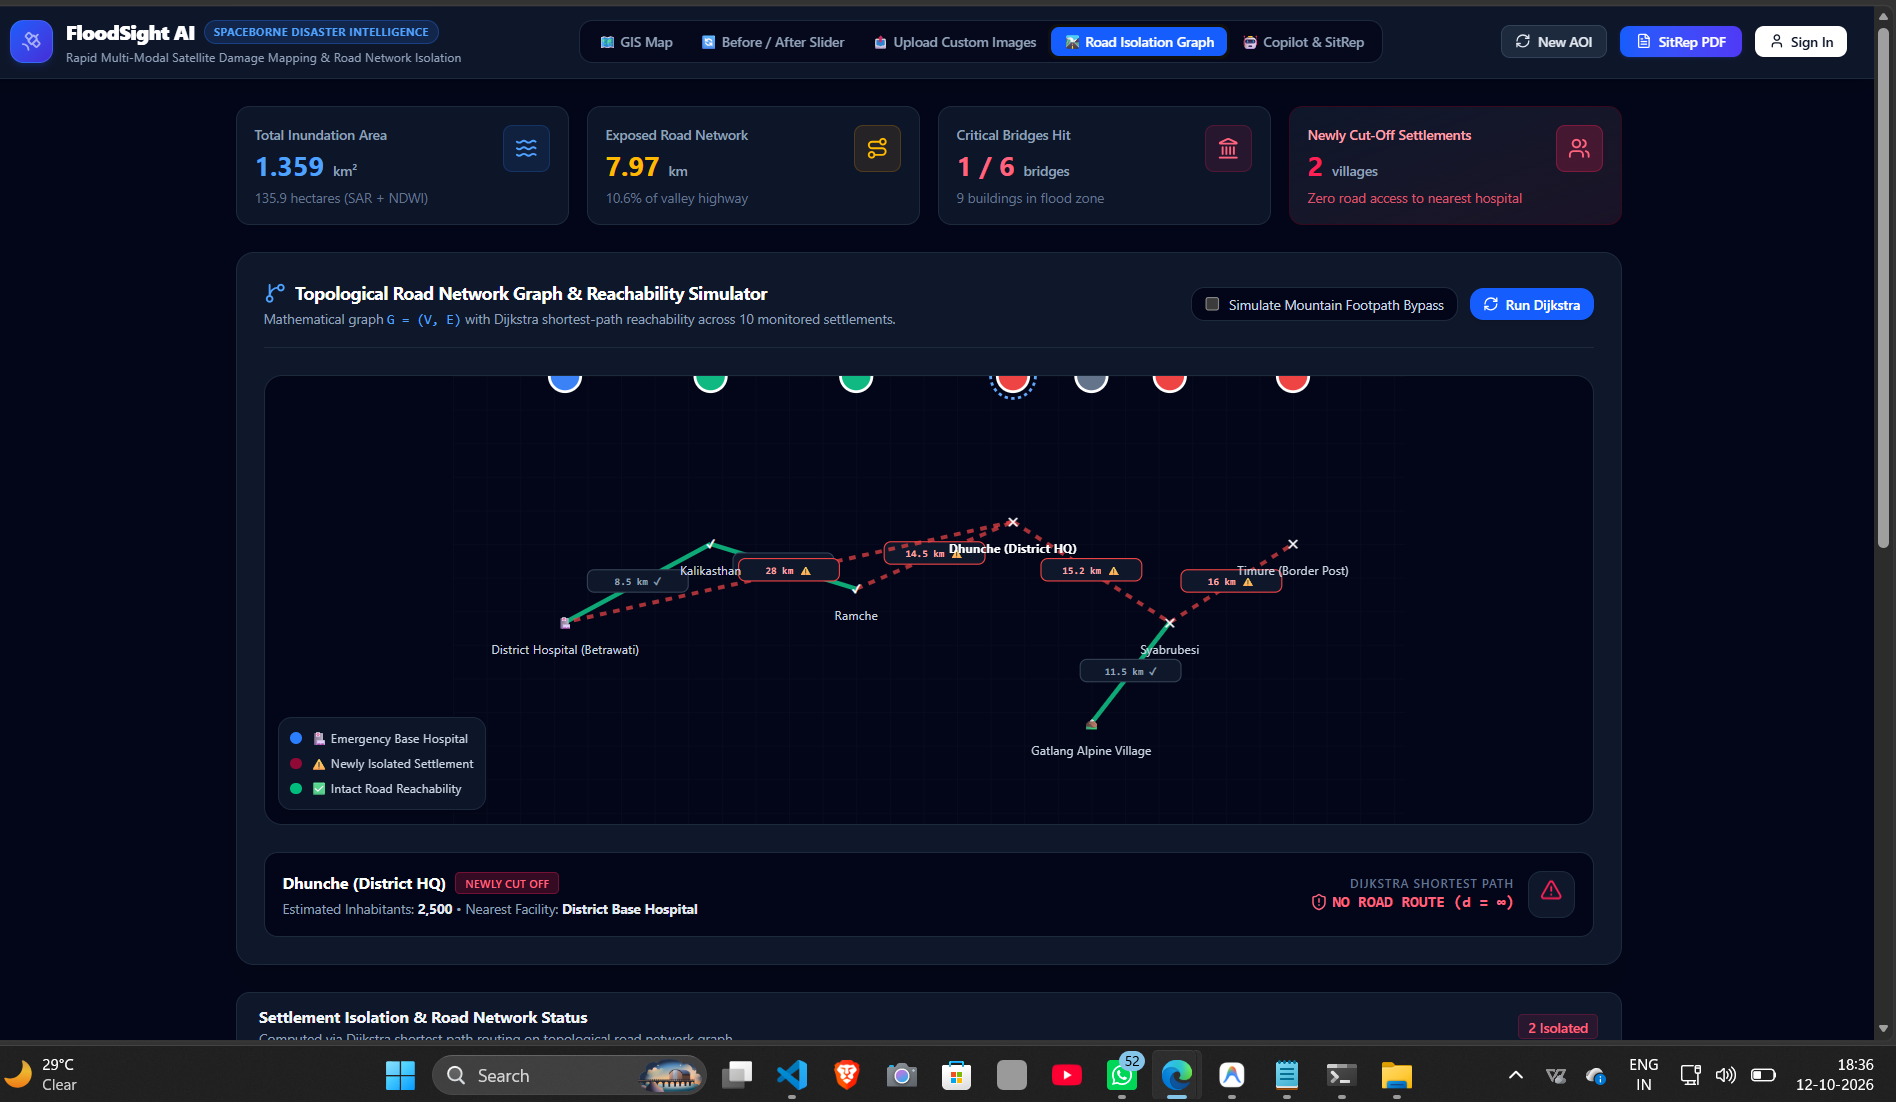
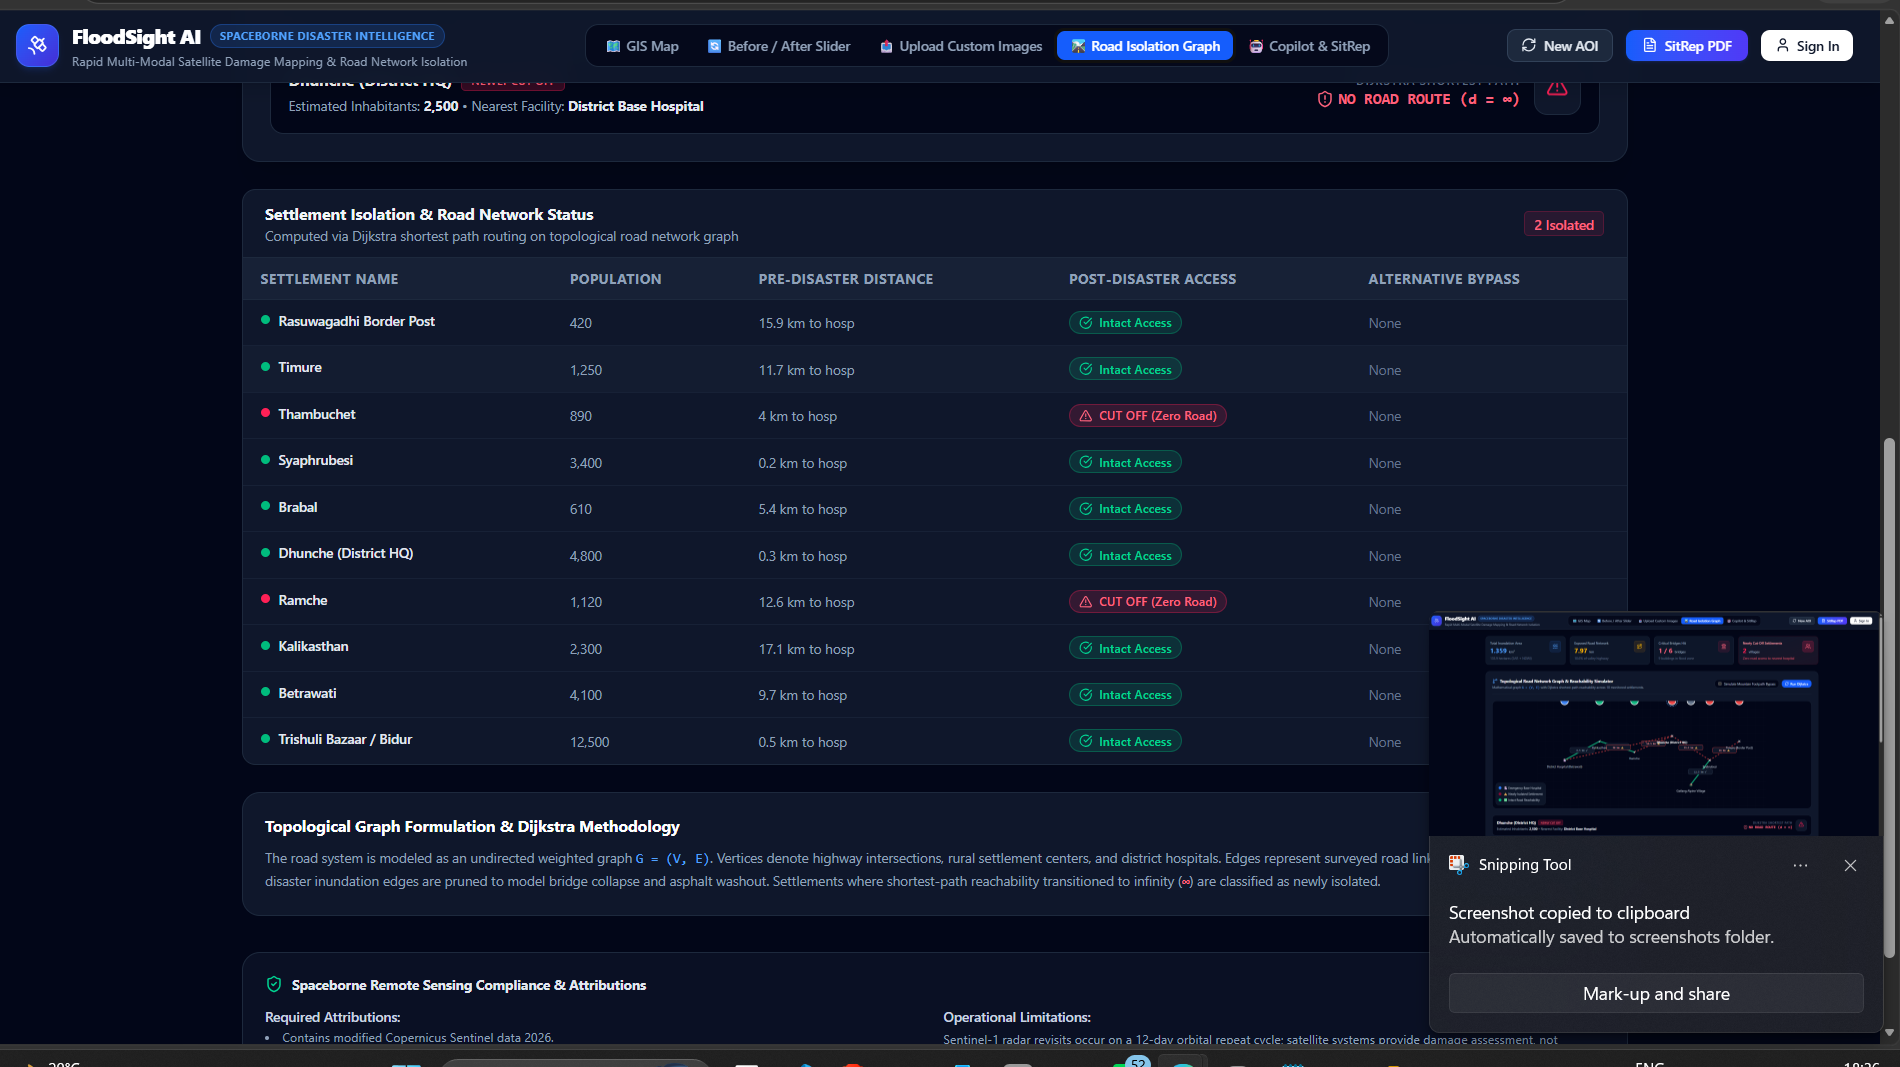
brigdes connection data
-
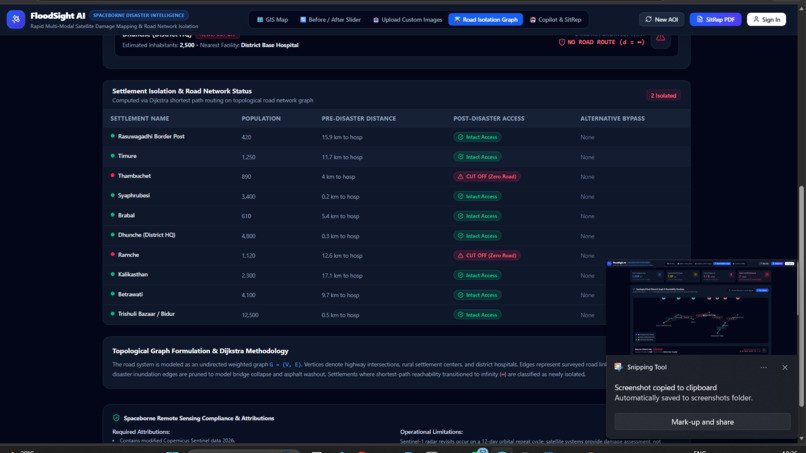
road and building damage details
-
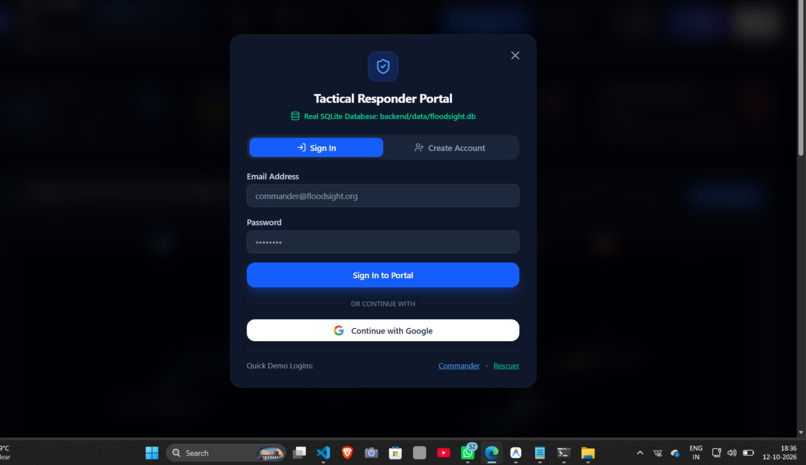
login and signup
💡 Inspiration
During catastrophic mountain flash floods and cloudbursts, optical satellites can become ineffective under 90%+ cloud cover, while washed-out bridges can cut off remote villages without warning. We built FloodSight AI to transform all-weather, spaceborne radar data into actionable ground intelligence — detecting flooded roads and isolated communities before critical relief windows close.
🛰️ What It Does
- All-Weather Flood Mapping: Uses Sentinel-1 SAR C-band microwave radar (5.4 GHz) to detect flooding through clouds, rain, and nighttime darkness.
- Topographic Terrain Gating: Integrates 30m Digital Elevation Models (DEM) to reduce false alarms caused by mountain radar shadows.
- Road Network Reachability: Models road and bridge networks as a graph (G=(V,E)), identifies links intersecting flood zones, and simulates route accessibility using Dijkstra's algorithm.
- Multi-Sensor Comparison: Provides an interactive swipe slider comparing SAR radar, Sentinel-2 optical RGB, MNDWI water index, and CIR infrared imagery.
- Custom Image Upload & Computer Vision: Enables segmentation of uploaded drone or satellite images, generating binary water masks and flooded-area metrics.
- Grounded Copilot & PDF Situation Reports: Offers a bilingual English/Nepali assistant grounded in calculated pipeline metrics and generates automated, one-page official situation reports.
🛠️ How We Built It
1. SAR Radar Calibration & Lee Filter
Reduced coherent speckle noise while preserving riverbank edges using the Lee filter:
[ \hat{I}=\bar{I}+W(I-\bar{I}) ]
Candidate water pixels are identified using a calibrated backscatter threshold:
[ \sigma^0 \leq -18\text{ dB} ]
2. DEM Slope Gating
Reduced false flood detections caused by steep cliffs and terrain shadows using a slope-based filtering rule:
[ \theta=\arctan\left(\sqrt{z_x^2+z_y^2}\right) ]
Candidate water pixels on terrain with:
[ \theta>15^\circ ]
are rejected, subject to the limitations of the terrain and radar geometry.
3. Graph Reachability Engine
Represented roads and bridges as a weighted graph:
[ G=(V,E) ]
Road segments intersecting the flood footprint (F) are flagged or removed from the traversable graph:
[ e\cap F\neq\varnothing ]
Dijkstra's algorithm computes shortest paths from a hospital or relief base (s). If a village (v) becomes unreachable:
[ d_{\text{post}}(s,v)=\infty ]
the system flags it as a potentially cut-off village.
Tech Stack
Backend: FastAPI, OpenCV, NumPy, NetworkX, ReportLab, SQLite
Frontend: React 19, TypeScript, Tailwind CSS, MapLibre GL
Mapping & Visualization: 3D gorge terrain visualization and Google Maps Platform tiles
🧗 Challenges We Faced
- Radar Speckle and Gorge Shadows: Mountain cliffs can appear as dark regions in SAR imagery, resembling water. We integrated DEM-based slope filtering to reduce false positives.
- Preventing AI Hallucinations: Constrained the Copilot to calculated pipeline metrics and verified outputs to reduce unsupported disaster-reporting claims.
- Field Network Resilience: Designed a dual-engine architecture with a client-side HTML5 Canvas computer-vision fallback for image analysis when the server connection is unavailable.
🧠 What We Learned
- SAR Physics vs. Optical Imaging: Learned why microwave backscatter (\sigma^0) is valuable for flood monitoring when optical imagery is obscured by clouds.
- From Pixels to Lives: Water segmentation estimates the flooded area, but graph connectivity (G=(V,E)) helps identify potentially isolated communities and inaccessible relief routes.
- Decision Support Under Pressure: Combining satellite imagery, terrain analysis, road connectivity, and grounded AI can turn raw geospatial data into more actionable disaster-response information.
FloodSight AI — Turning all-weather satellite intelligence into actionable flood-response insights.

Log in or sign up for Devpost to join the conversation.