-
-
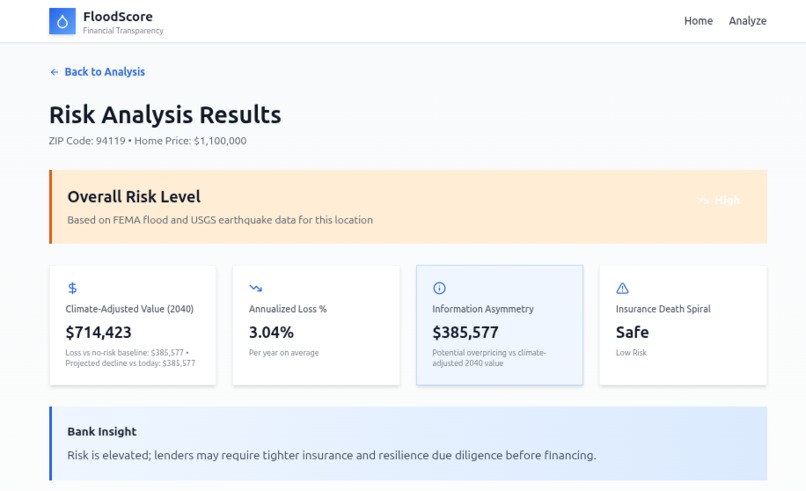
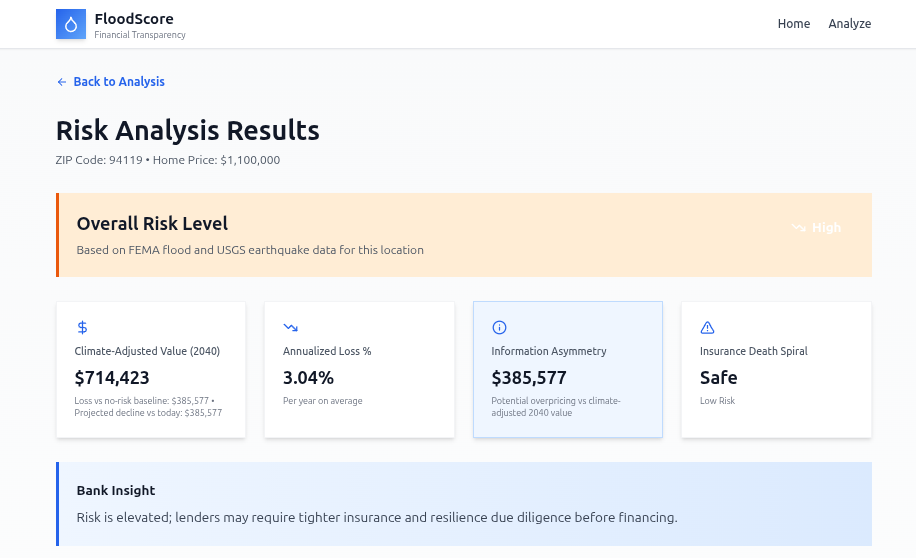
Analysis page
-
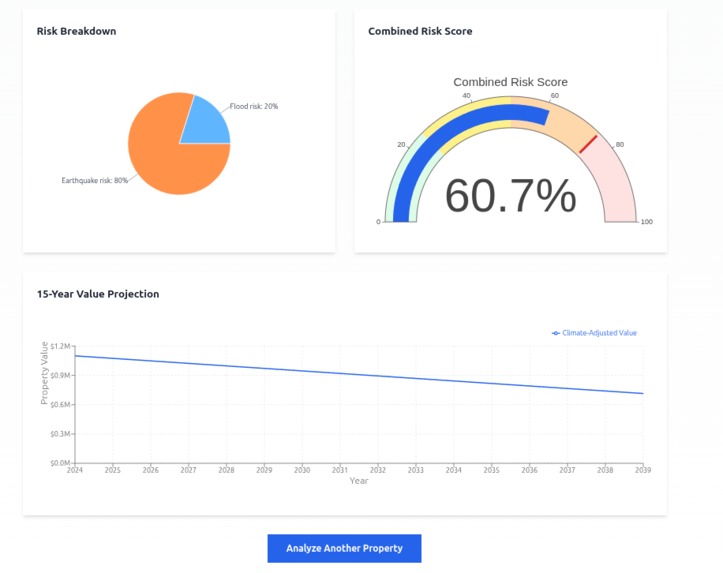
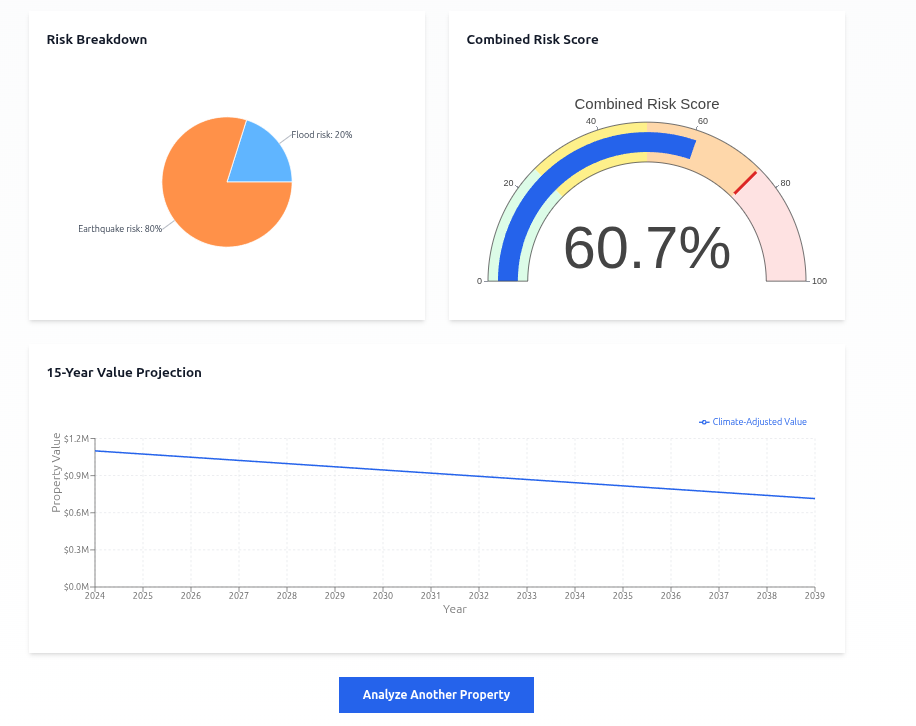
Analysis breakdown graphs
-
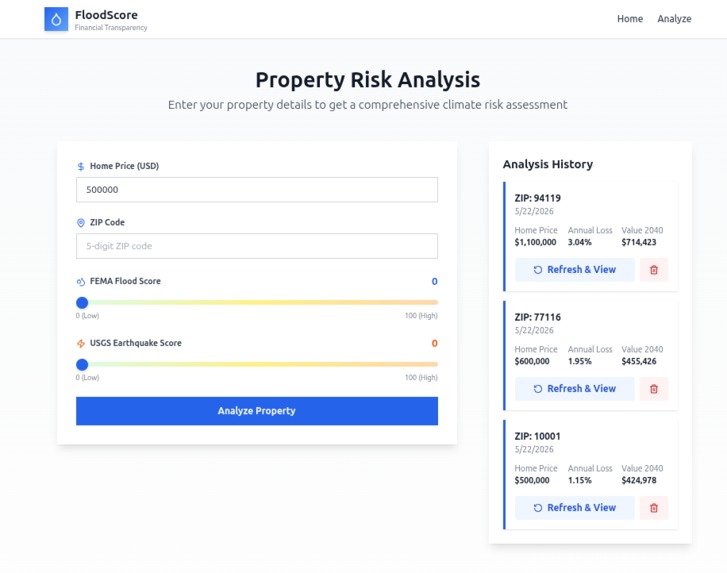
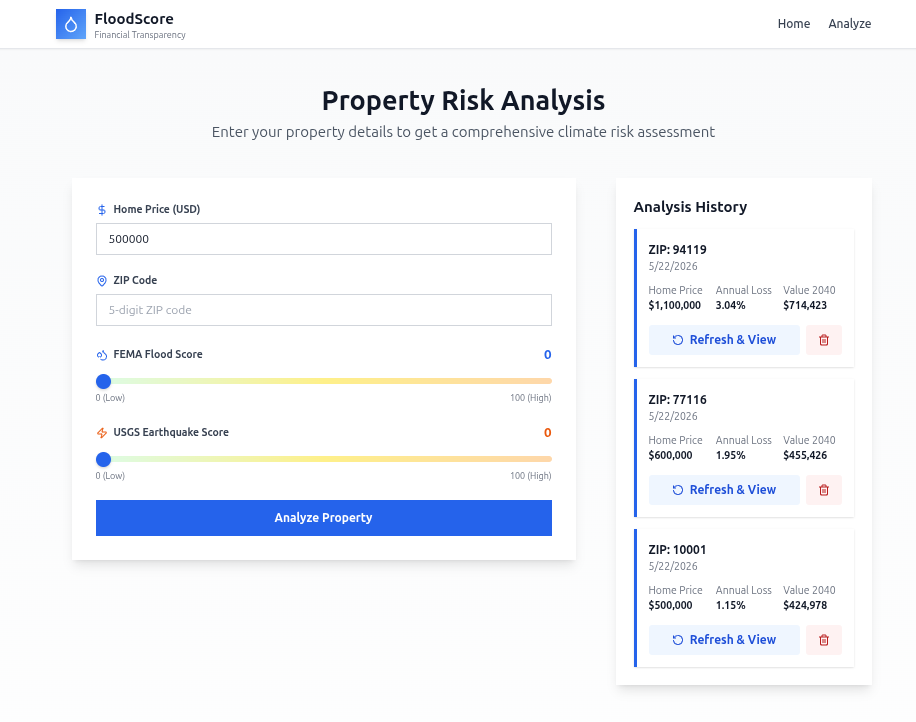
Main webpage
-
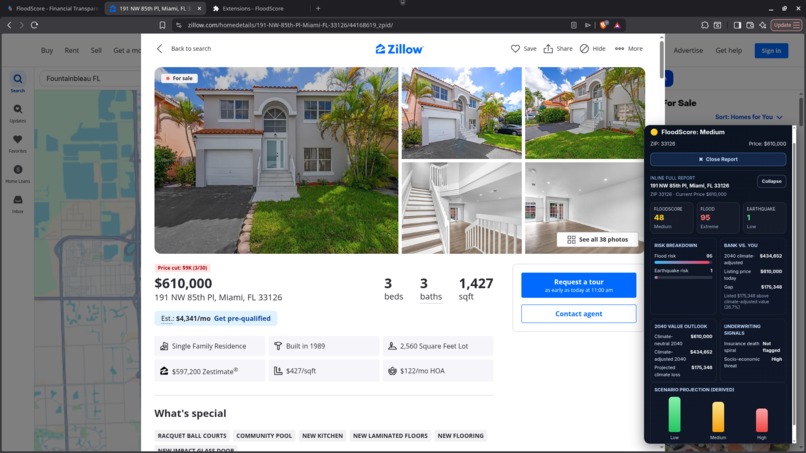
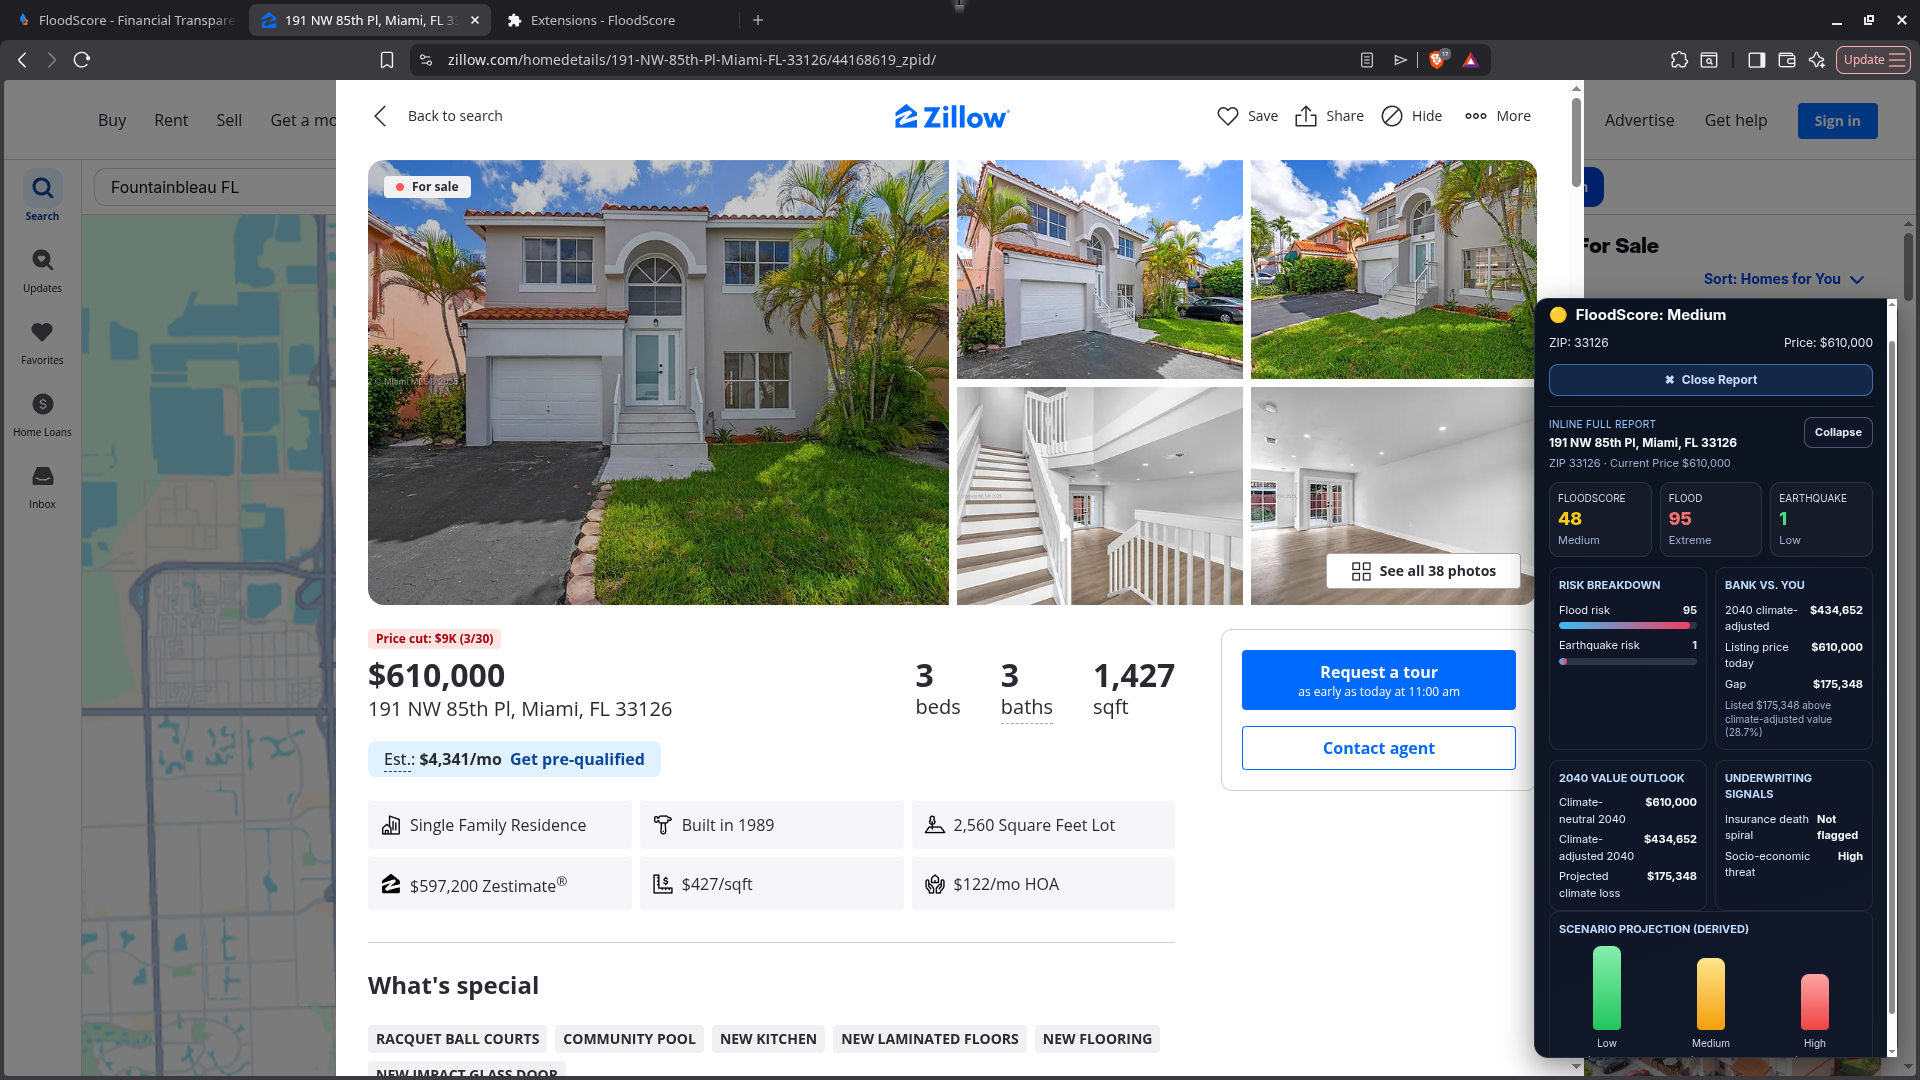
Chrome extension when expanded
-
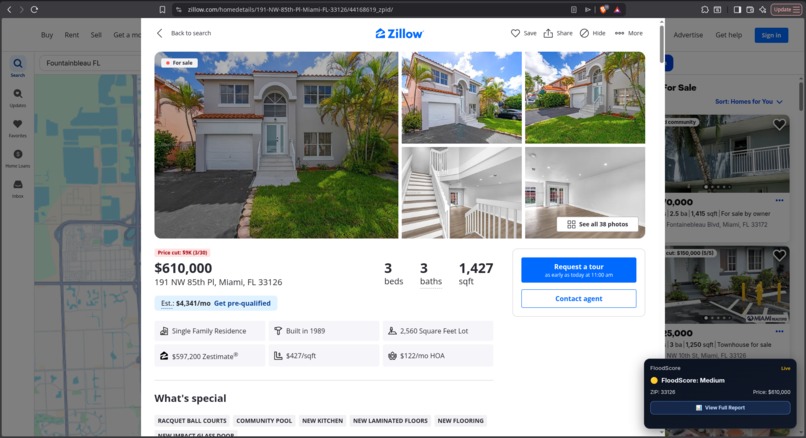
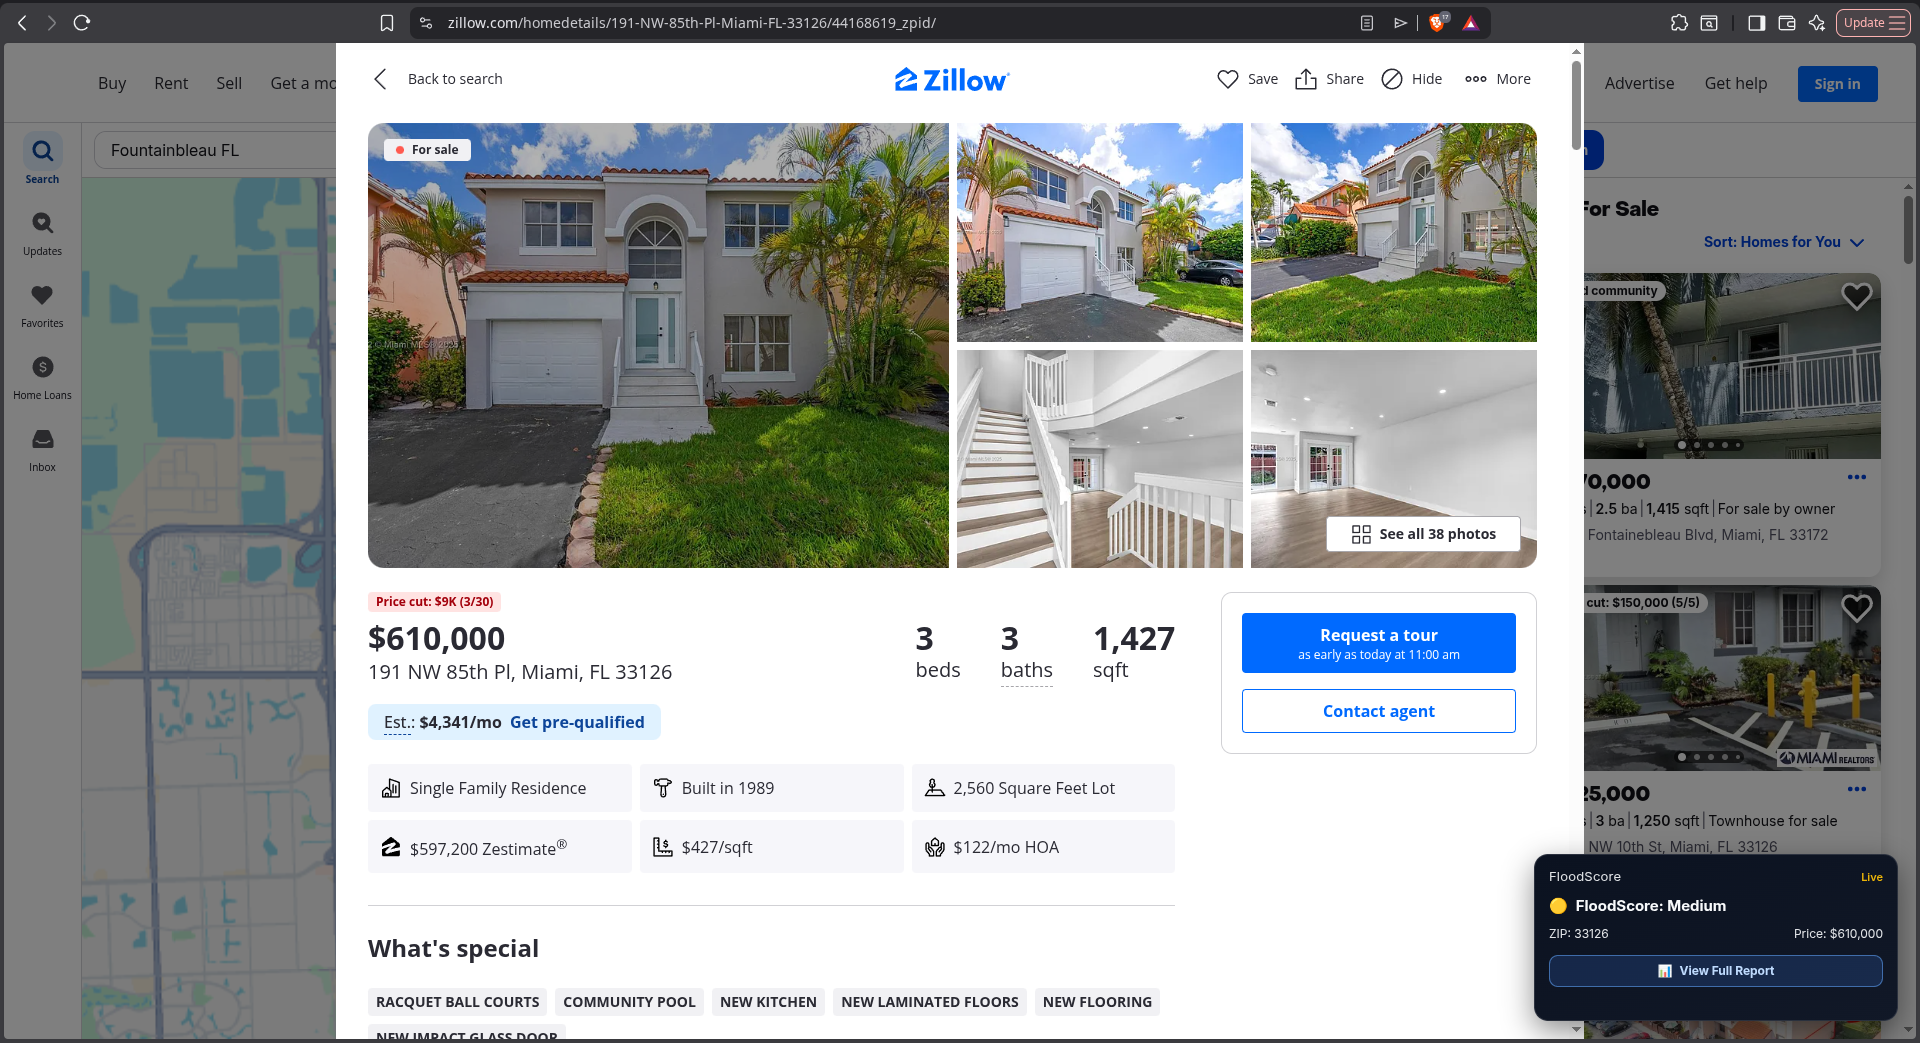
Chrome extension automatic popup on Zillow
Inspiration
I kept coming back to one uncomfortable fact. When someone signs a thirty-year mortgage, almost everyone involved in the deal has already modeled the property's climate risk. The bank has. The insurance company has. There are entire firms that do nothing but sell climate risk scores to big institutional clients. The one person who usually doesn't have any of that information is the buyer, who is also the person taking on the debt. They find out about the risk later instead. Premiums go up, or coverage gets dropped, or the home just quietly stops keeping pace in value. I wanted to build something that hands that information back to the person who actually needs it, before they sign, not after.
What it does
Using a ZIP code and home value, FloodScore identifies significant climate-related threats to the property. The FloodScore site provides flood risk, earthquake risk, an estimated 2040 home value (with price adjusted using hazard exposure), an estimated dollar loss, and a risk level with clear explanations. Most existing tools focus on simply measuring the riskiness of a location. FloodScore goes further by translating that risk into financial terms, showing the gap between a home's market price and its climate-adjusted value, so a buyer can see what the risk is actually worth before making an offer. I built the product in a way that would enable individuals to navigate to the site easily and have the risk data delivered to them as they browse for homes. This includes a web app for looking up specific properties and a Chrome extension that delivers the analysis directly while browsing real estate listings, rather than asking them to go to another location to access the information.
How we built it
FloodScore consists of three components, namely an API, a Chrome extension, and a web interface. The API is written in Python using Flask and is backed by a pandas database of risk scores. In the startup phase of the application, a ZIP-level risk file is read into memory and each ZIP code is reformatted to ensure all codes are consistently laid out as five-digit numbers. Each score is also checked to ensure that it is a number between 0 and 100, and duplicates are dropped. A lookup table is created in memory so that requests can be serviced quickly. A significant amount of effort was put into making sure this component was difficult to break; if an expected file is missing, a column is missing from the file, or a provided ZIP code does not exist in the database, then the API will not crash. Instead, it will return an estimated profile for that ZIP code, clearly labeled as an estimate. Regarding the risk data used to build FloodScore: the FloodScore application was developed to run entirely on FEMA's National Risk Index, and therefore the schema of the FloodScore lookup database directly matches that of the FEMA National Risk Index database. However, FEMA's complete risk databases are many gigabytes in size, and it is unfeasible to transport and upload such a large file within the timeframe of the hackathon. Consequently, a smaller example database with the same schema was used to develop the application. The application code is not tied to the example database, and if the application is pointed to the actual FEMA database, it will work the same way, with many more ZIP codes available. The main endpoint runs a few calculations. Combined hazard is the flood score plus the earthquake score. The climate-adjusted value takes the purchase price and applies a penalty based on the property's combined hazard score. The formula is returned inside the API response itself, so the model is transparent instead of being a black box. The model has three different endpoints. The first analyzes a property by providing a ZIP code and price. The second is a quick score lookup by ZIP code, which auto-fills forms once you enter a ZIP code. The third is a health check, which also reports on the status of the data source. All input is validated, and all errors are returned as clean JSON with the correct HTTP status codes. Both the web app and the Chrome extension call the API directly, with CORS enabled. The web app allows you to view a specific property and its calculated risks in detail, and with the Chrome extension, the same calculated risks appear next to a real estate listing on-page while the user searches for homes.
Challenges we ran into
The most difficult thing was making decisions. Not just writing code, the difficulty laid in judging the weightings built into that code. How steeply should hazard discount a home's value? Should social vulnerability count as much as physical hazard? I repeatedly needed to remind myself that these fixed values would ultimately affect how people read their own conditions. Another constraint was the amount of data required as input. I wanted accurate measurements from the entire FEMA dataset, but unfortunately the entire dataset is just too large to load and would dramatically slow down operations during routine demonstrations and testing. Therefore, I made the conscious decision to build the model using the actual FEMA schema, but with a smaller representative sample. This meant operations would be performed rapidly while still being built around real FEMA data. I also had issues with missing data. Originally, if an input ZIP code was missing from the database, the entire transaction would fail. I fixed this by reconstructing the loading logic to provide estimates for missing data. A tool whose primary reason for existing is to close an information gap cannot silently invent data to fill in, so every estimate is clearly labeled as an estimate.
What we learned
The project demonstrated to me that decisions can be as complicated and difficult to make as writing code. Evaluating factors against each other to determine the weight of each one, and turning raw scores into something people can act on, is a process with many "what ifs." There are multiple ways of doing exactly the same thing, and thus many potential choices involved, so these choices are as important as the actual implementation. Scoping your project accurately and being honest with yourself about what you can do is very important. I had too much data to be able to develop everything in the time I had available, so instead I built a portion of it based on a limited sample. Learning to be comfortable with this trade-off, proving the concept of the project rather than trying to develop a complete one, was another lesson learned. Finally, I learned that there is a large amount of effort associated with the parts of a project the general public does not typically see: validation of bad input, graceful failure of code, and keeping code in sync as the project is modified. These turned out to require significantly more work and effort than building the visible features themselves.
What's next for FloodScore
The next logical step is to run FloodScore with the entire FEMA National Risk Index dataset. The code has already been built to utilize that schema; I just need the correct data and some data migration to get there. I also want to adapt the FloodScore Chrome extension to cover more listing sites, which will provide a more seamless experience when analyzing homes. Longer term, I want to develop FloodScore's risk-compounding model across a thirty-year loan and produce a portfolio view for lenders and lawmakers to identify areas with a high concentration of risk.


Log in or sign up for Devpost to join the conversation.