-
-
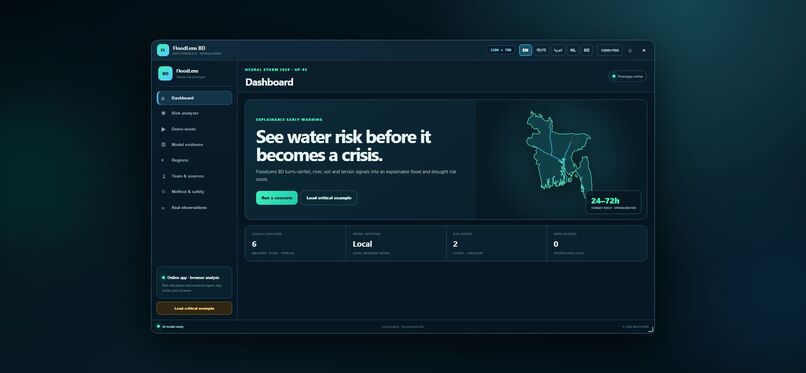
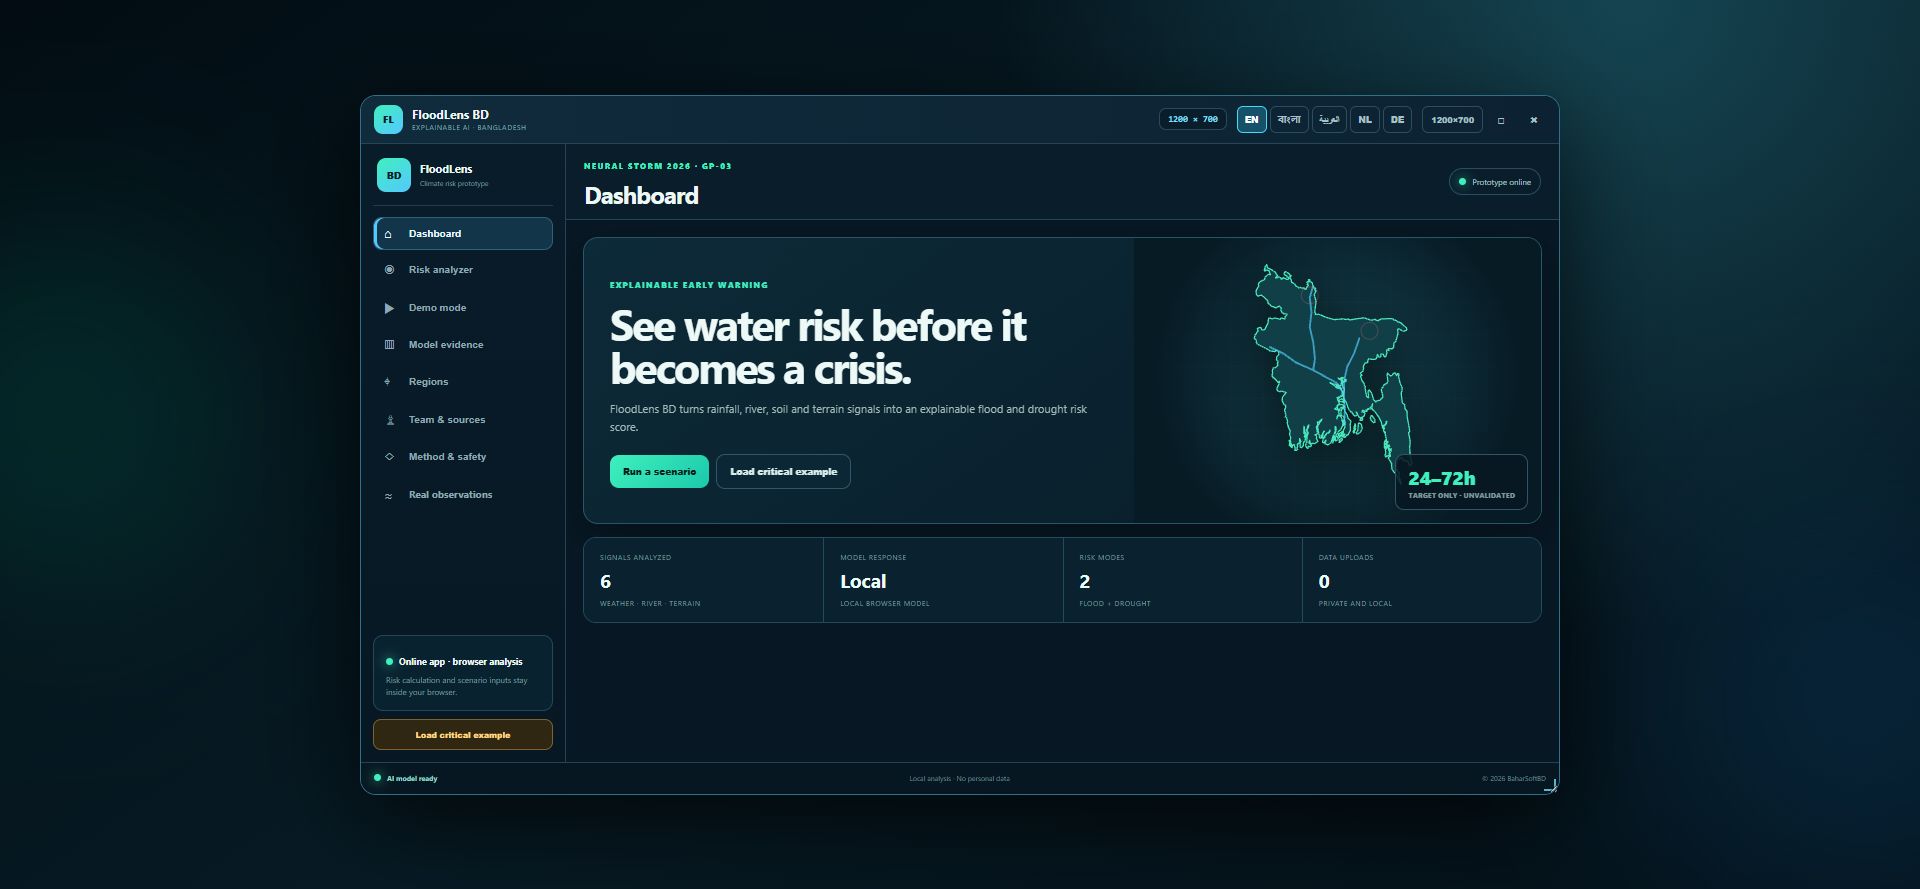
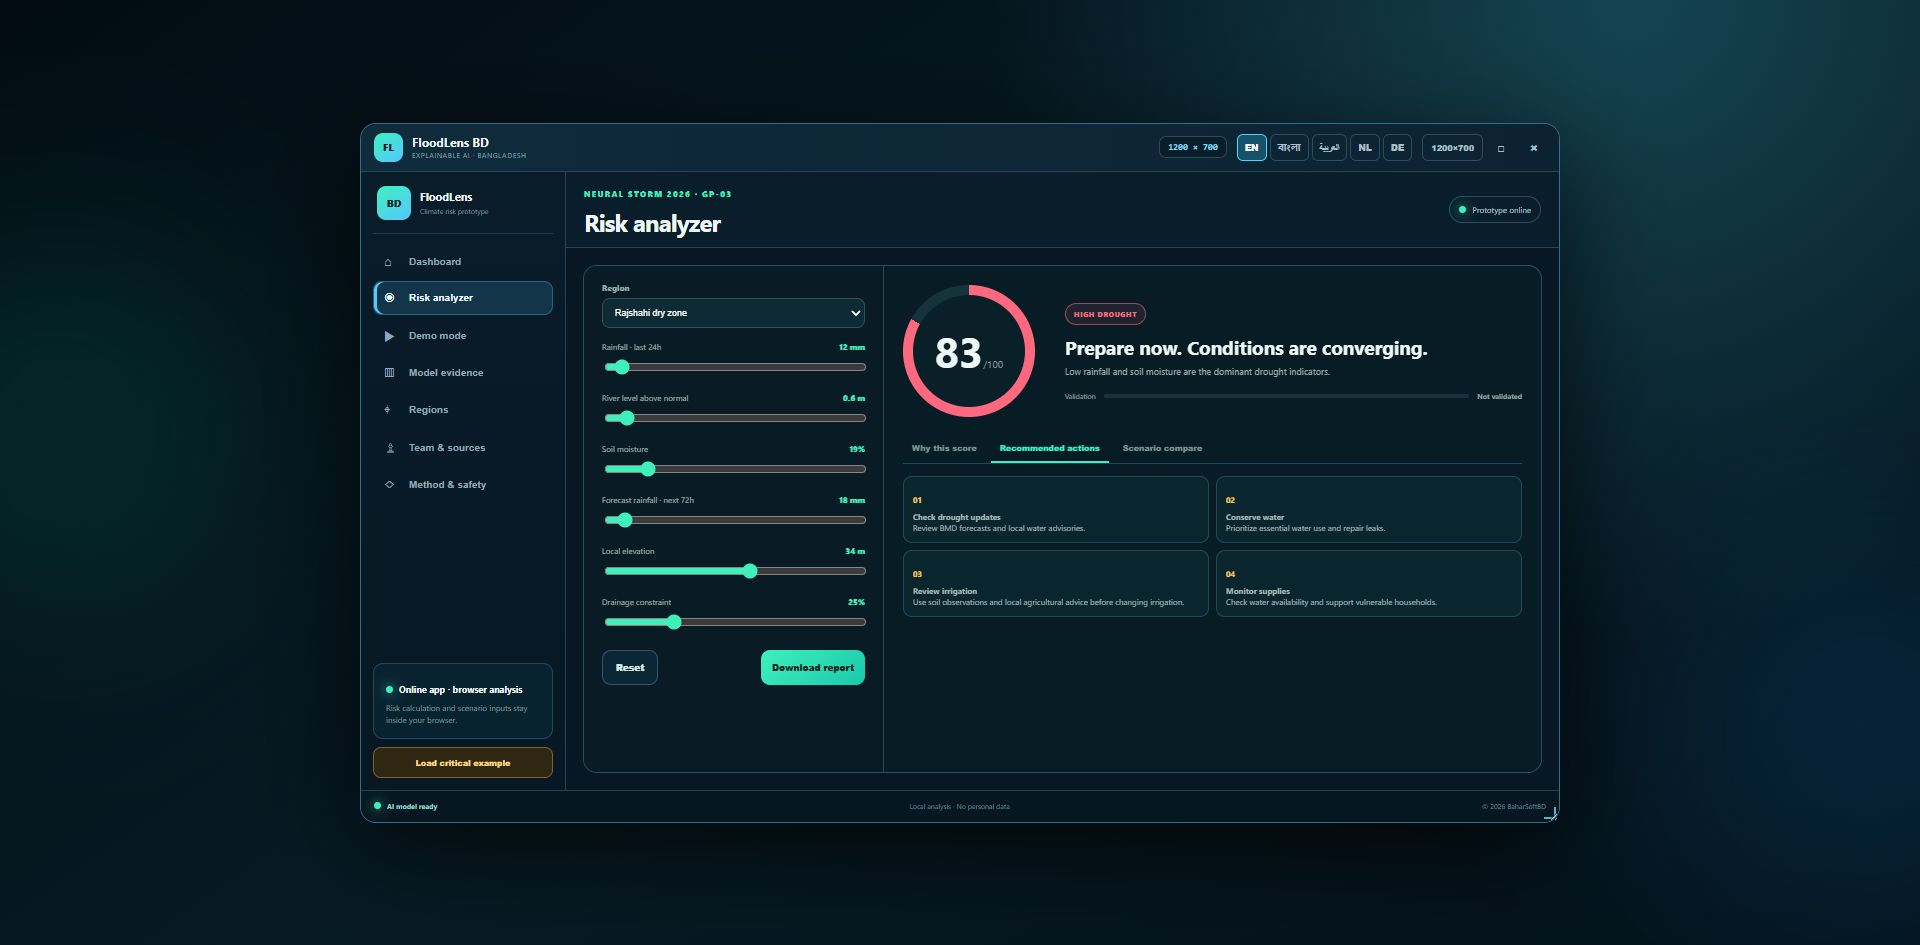
FloodLens BD dashboard with a geographic Bangladesh outline and interactive scenario sandbox.
-
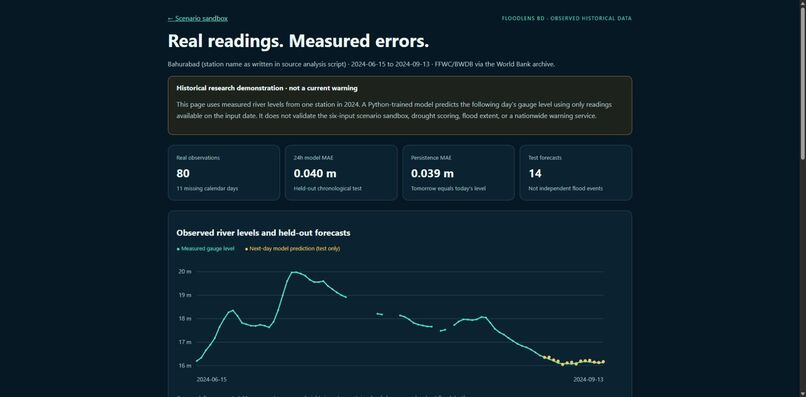
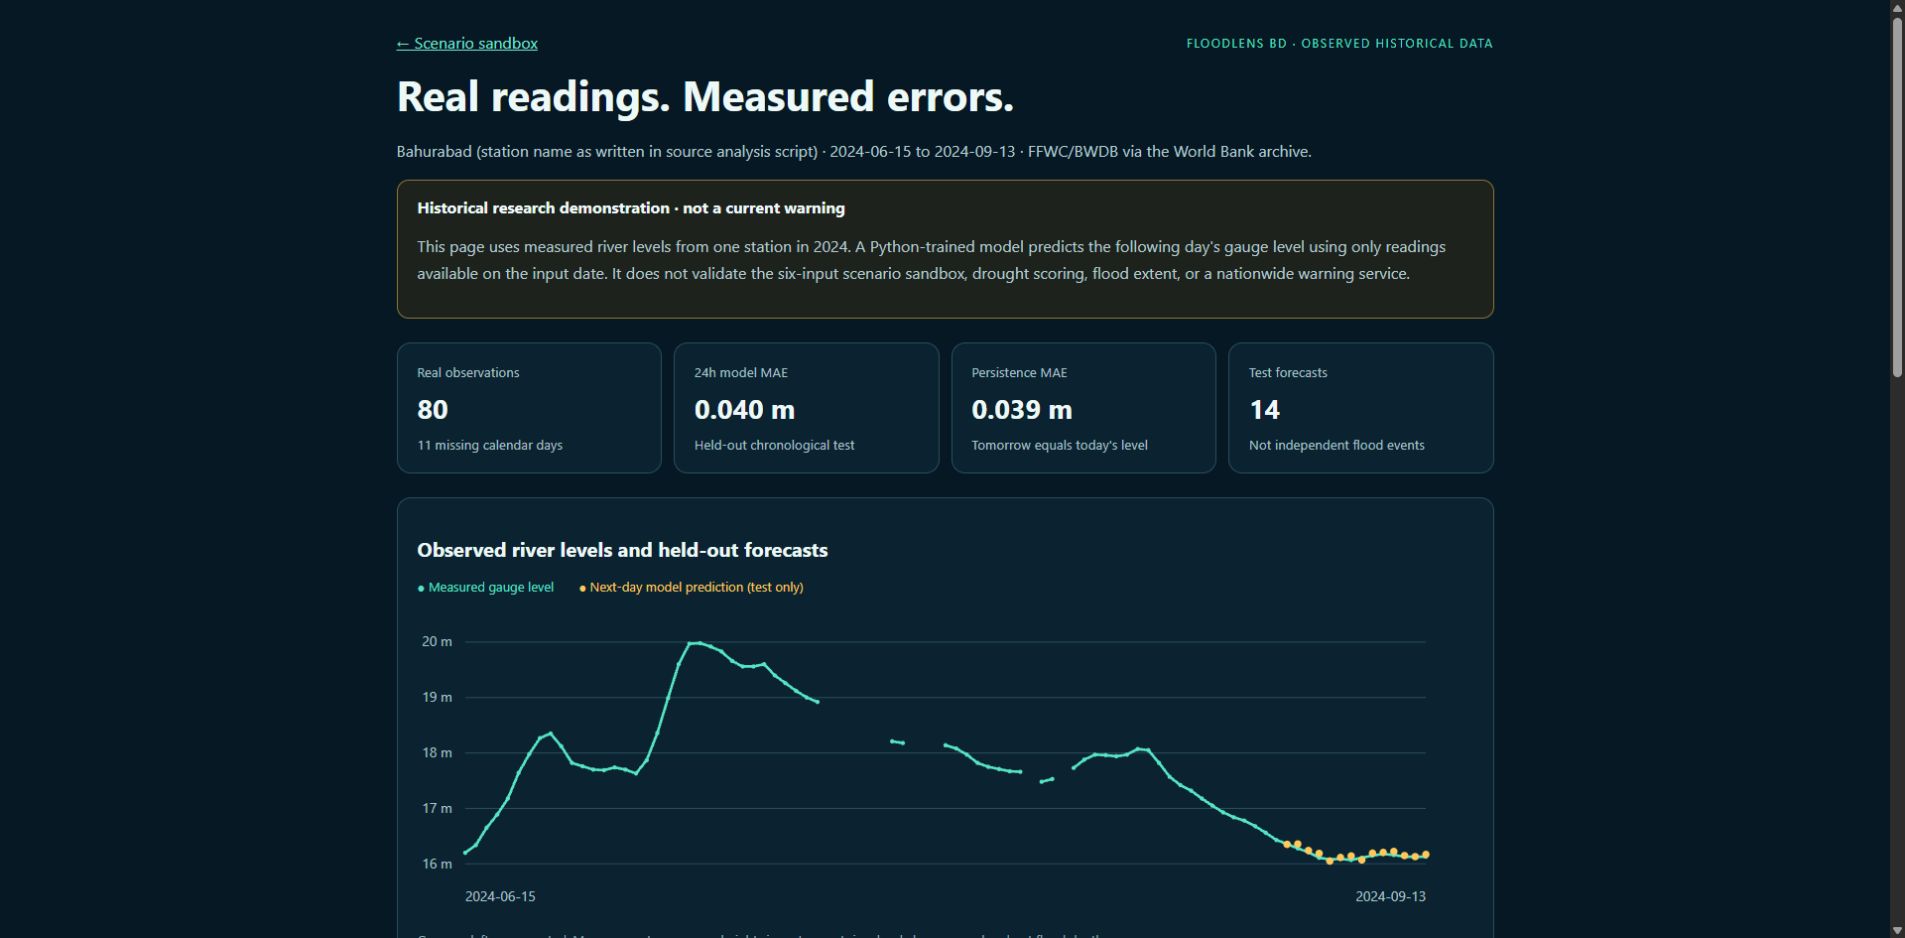
80 real historical river readings and held-out Python model forecasts, with baseline comparisons.
-
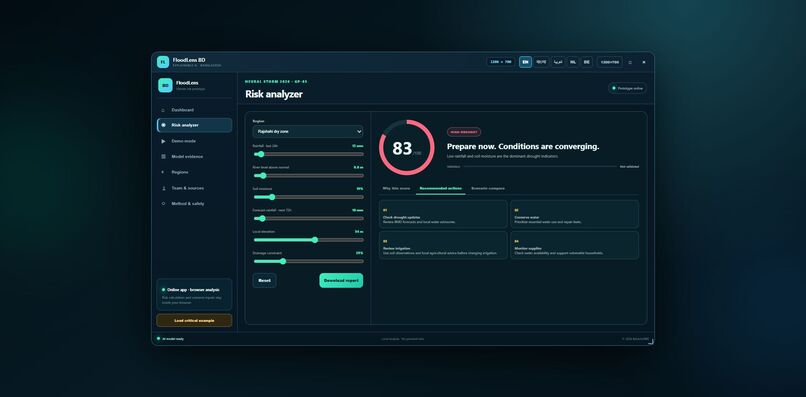
Illustrative drought scenario with hazard-specific water-conservation guidance.
Inspiration
Bangladesh's flood and drought risks are easier to discuss when people can see which environmental signals influence an assessment. I built FloodLens BD to explore understandable risk explanations alongside reproducible evidence, rather than presenting a score without context.
What it does
FloodLens BD addresses Neural Storm's Green Planet track, GP-03: Flood & Drought Early Warning System. It has two distinct modes:
- Scenario sandbox: six adjustable inputs—rainfall, river level, soil moisture, forecast rainfall, elevation and drainage—produce illustrative flood and drought scores, hazard-specific explanations, preparedness guidance and downloadable reports. Regional presets and demo scenarios support comparisons. Main interface translations include Bengali, English, Arabic, Dutch and German; some detailed content remains in English.
- Real observations: a separate historical demonstration uses 80 measured Bangladesh river-level observations from June 15 to September 13, 2024, sourced from FFWC/BWDB through World Bank reproducibility package RR_BGD_2025_385v2. It shows an observed-level chart, held-out next-day predictions, baseline comparisons and downloadable observations/model results.
How I built it
I developed the interface with HTML, CSS, JavaScript and SVG. The dashboard uses a geographic Bangladesh boundary derived from Natural Earth; its river strokes and animated markers are illustrative, not live hazard indicators.
The historical model is trained in Python using pandas, NumPy and scikit-learn. Ridge regression predicts next-day gauge height from the current reading and one-day/two-day changes. The pipeline requires consecutive calendar observations, leaves 11 missing dates unfilled and produces 67 valid forecasting examples. I use 40 chronological training examples, 13 validation examples and 14 final test examples. Ridge strength is selected using validation data; final fitting uses train plus validation only. The browser displays the exported historical results.
Results and what I learned
On the 14 held-out days:
| Method | MAE (meters) | RMSE (meters) |
|---|---|---|
| Python-trained ridge regression | 0.0401 | 0.0468 |
| Persistence | 0.0386 | 0.0486 |
| One-day linear trend | 0.0293 | 0.0371 |
The learned model does not beat the simple baselines in MAE. This small test block covers a late-season recession, not independent flood events. Showing these results taught me why chronological evaluation, data provenance and baseline comparisons matter more than an impressive accuracy claim.
The sandbox's separate legacy synthetic benchmark is explicitly labeled synthetic. Its 82.85% accuracy is only slightly above an always-positive baseline of 81.85%, with specificity of 20.11%. It must not be presented as observed disaster-forecasting performance.
Challenges and accomplishments
I corrected hazard-specific advice and contribution explanations, removed unsupported confidence percentages, added transparent baseline reporting, and built a reproducible Python pipeline with eight passing checks. Direct FFWC API access was unavailable, so I used the publicly downloadable World Bank archive and retained source attribution and its redistribution license. No security restrictions were bypassed.
Safety and limitations
This is an educational research prototype, not an official warning service. Scenario scores are illustrative and are not calibrated disaster probabilities. The historical evaluation covers one station and one season; it does not validate nationwide flood risk, flood extent, drought prediction or the six-input sandbox. The 24–72-hour sandbox horizon is an unvalidated target. Follow FFWC, BWDB, BMD and local authorities for decisions.
Development and AI-tool disclosure
Solo participant: MD Zakir Hossain, responsible for concept, design, engineering, Python/AI implementation, evaluation, documentation and presentation.
The project began as pre-hackathon preparation; hosting files showed October 28, 2026 modification dates. November 3 work added corrections, historical-data integration, Python training/evaluation, documentation and publication. I disclose this prior work separately from event-period development; organizer confirmation of build-period eligibility remains pending. I do not claim the entire project was created during the official 48-hour window.
OpenAI Codex assisted with review, implementation, data integration, evaluation and documentation. Earlier AI-tool usage is not fully documented. The README retains this disclosure.
What's next
Expand historical coverage across gauges, seasons and flood peaks; obtain verified observation metadata and outcome labels; evaluate models that consistently outperform simple baselines; and separately validate drought screening before making forecasting claims.
Links and sources
- Live demo: https://floodlens.baharsoftbd.com/
- Historical demonstration: https://floodlens.baharsoftbd.com/real-data.html
- Source code, setup, tests and screenshots: https://github.com/mdzakirhossen23/floodlens-bd
- Data source: https://reproducibility.worldbank.org/catalog/374
