-
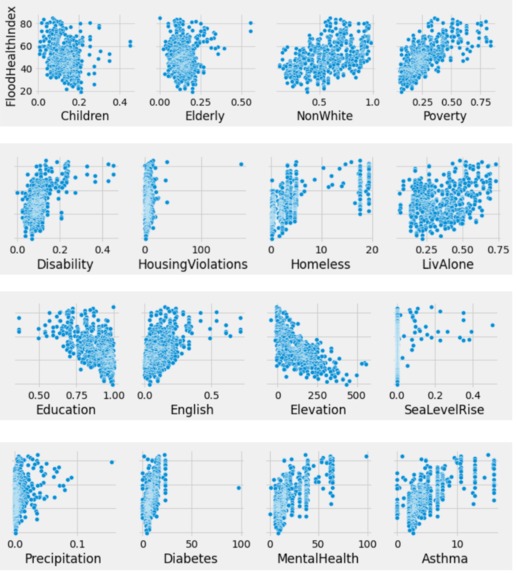
Plotting Variables against FHI
-
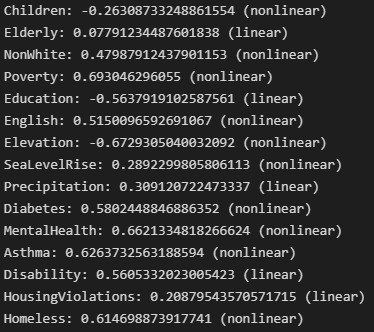
Correlations between variables and FHI

Inspiration
The prevalence of climate change has led to an increase in the frequency and devastation of natural disasters, and most of the violent and destructive disasters have to do with water. Hurricanes and flash flooding have caused millions of dollars in damages, a prime example being the recent Hurricane Ian, which had an estimated cost of over $75 billion. Even more pronounced are the effects on the health and lives of people in affected areas. We wanted to be able to more efficiently predict and analyze which communities are at risk of flooding and how we can equitably protect those communities.
With this in mind we looked at the data for San Francisco area demographics and an index to measure flood health effects (Flood Health Index). When we looked at the data behind the formula for Flood Health Index, we noticed that it took sixteen different metrics to calculate it. With that many metrics, the formula would be cumbersome to work with for a new area, so we thought it would be more beneficial if we simplified the number of demographic factors needed and gave a number that represented the relative level of flood damage.
What it does
We created a supervised machine learning model that can accurately predict the range of the Flood Health Index of an area when fed information about specific demographic factors. It streamlines the process of predicting the relative damage done by floods by reducing the number of variables needed to calculate it.
How we built it
Data manipulation and analysis was done using the pandas, numpy, and datascience libraries. This includes statistical tests such as pearson-r correlation, spearman-r correlation, and A/B Testing. The machine learning models were created using methods from the scikit-learn library. We compared four different supervised learning models against each other: kNN, Decision Tree, Support Vector Machine, and Linear Discriminant Analysis. Out of these, the Support Vector Machine consistently had a higher accuracy than the other models (84%).
Challenges we ran into
We had to overcome quite a few challenges during the competition. In the initial stages, we had trouble figuring out how to analyze the data and find correlations, as well as whether to use linear or nonlinear correlations. We also had difficulties identifying outliers and confounding variables, as well as avoiding common statistical fallacies. Creating and refining the machine learning models was also an obstacle, since we were all relatively new to data analytics. Additionally, the dataset used was so specific that we were unable to use the model outside of San Francisco in the allotted time, although it could theoretically be used if we could acquire the relevant metrics. In the end, however, conquering these obstacles provided us with a valuable learning experience, and we were able to create a final product that we could be proud of.
Accomplishments that we're proud of
Our biggest accomplishment was improving the accuracy of our models. The original models that we created had terrible accuracies (around forty to fifty percent). However, by fine-tuning the hyperparameters and reevaluating our independent variables, we were able to significantly boost our accuracies by 35%, up to nearly 85%.
What we learned
We learned how to analyze and graph a dataset using just python, including being able to find correlations between different variables. We also learned how to create different types of machine learning models that could predict a given area's Flood Health Vulnerability index using demographic information. Overall, this was a valuable learning experience that allowed us to further our knowledge in both Data Analytics and Machine Learning.
What's next for Flooding vs Demographic Metric Analysis
The model we created can be applied to assess the general risk from flooding for a given area. Furthermore, to improve our model, we could try to find a better set of independent variables that result in higher accuracies. If we succeeded, it would result in a model that is not only faster, but also more easily applicable to the real world.


Log in or sign up for Devpost to join the conversation.