-
Status Page
-
Home Page
Inspiration
We were concerned about rising sea levels and wanted to create a tool that would visualize how it would impact residents of NYC.
What it does
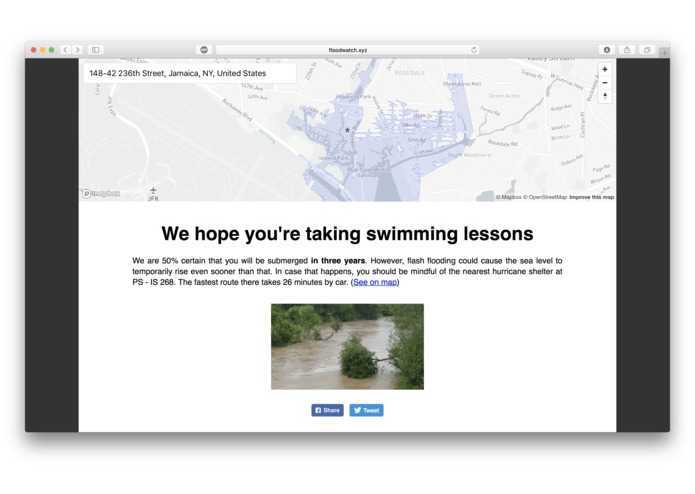
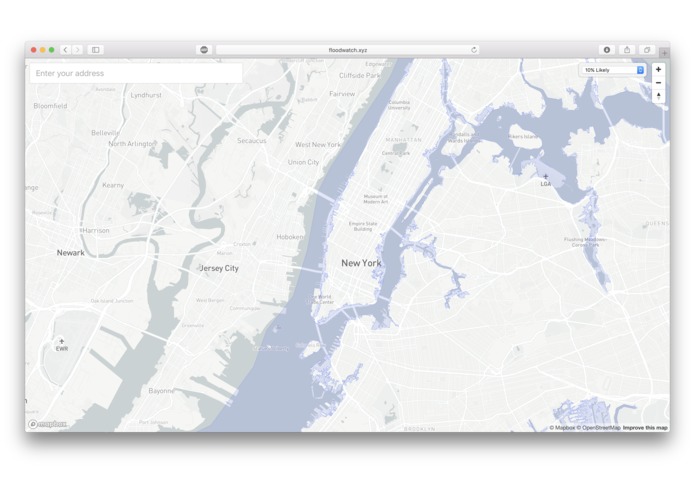
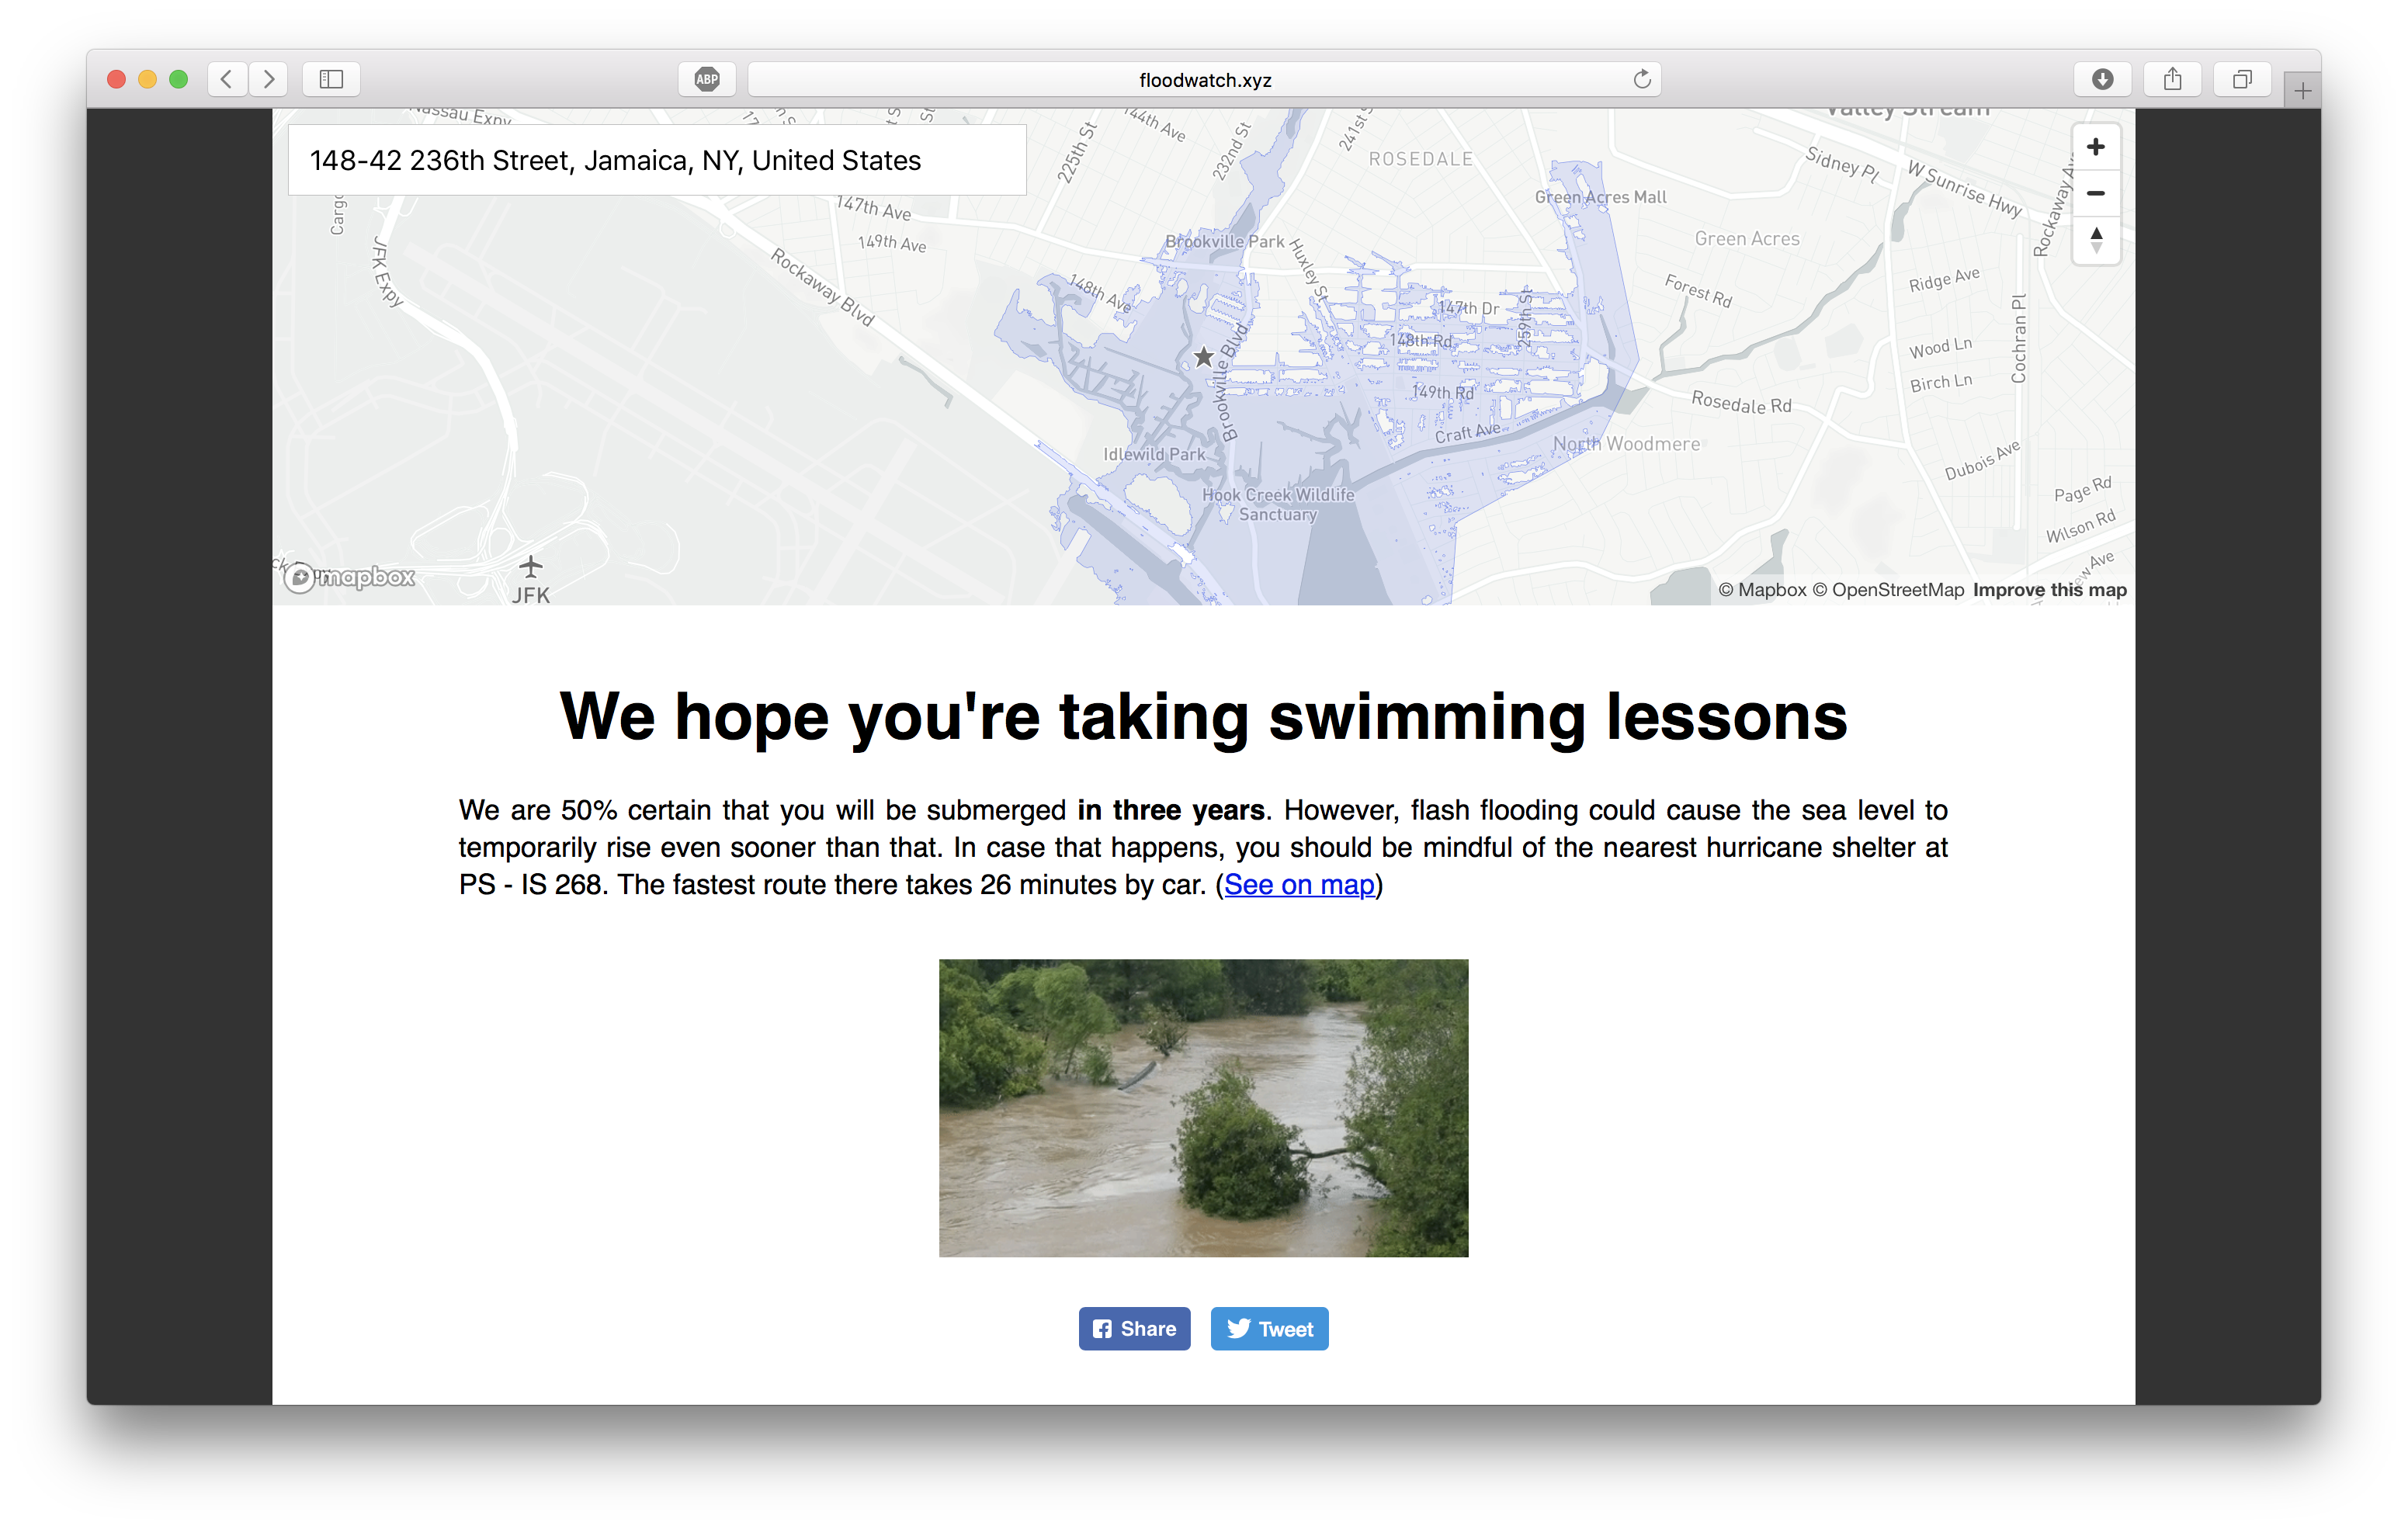
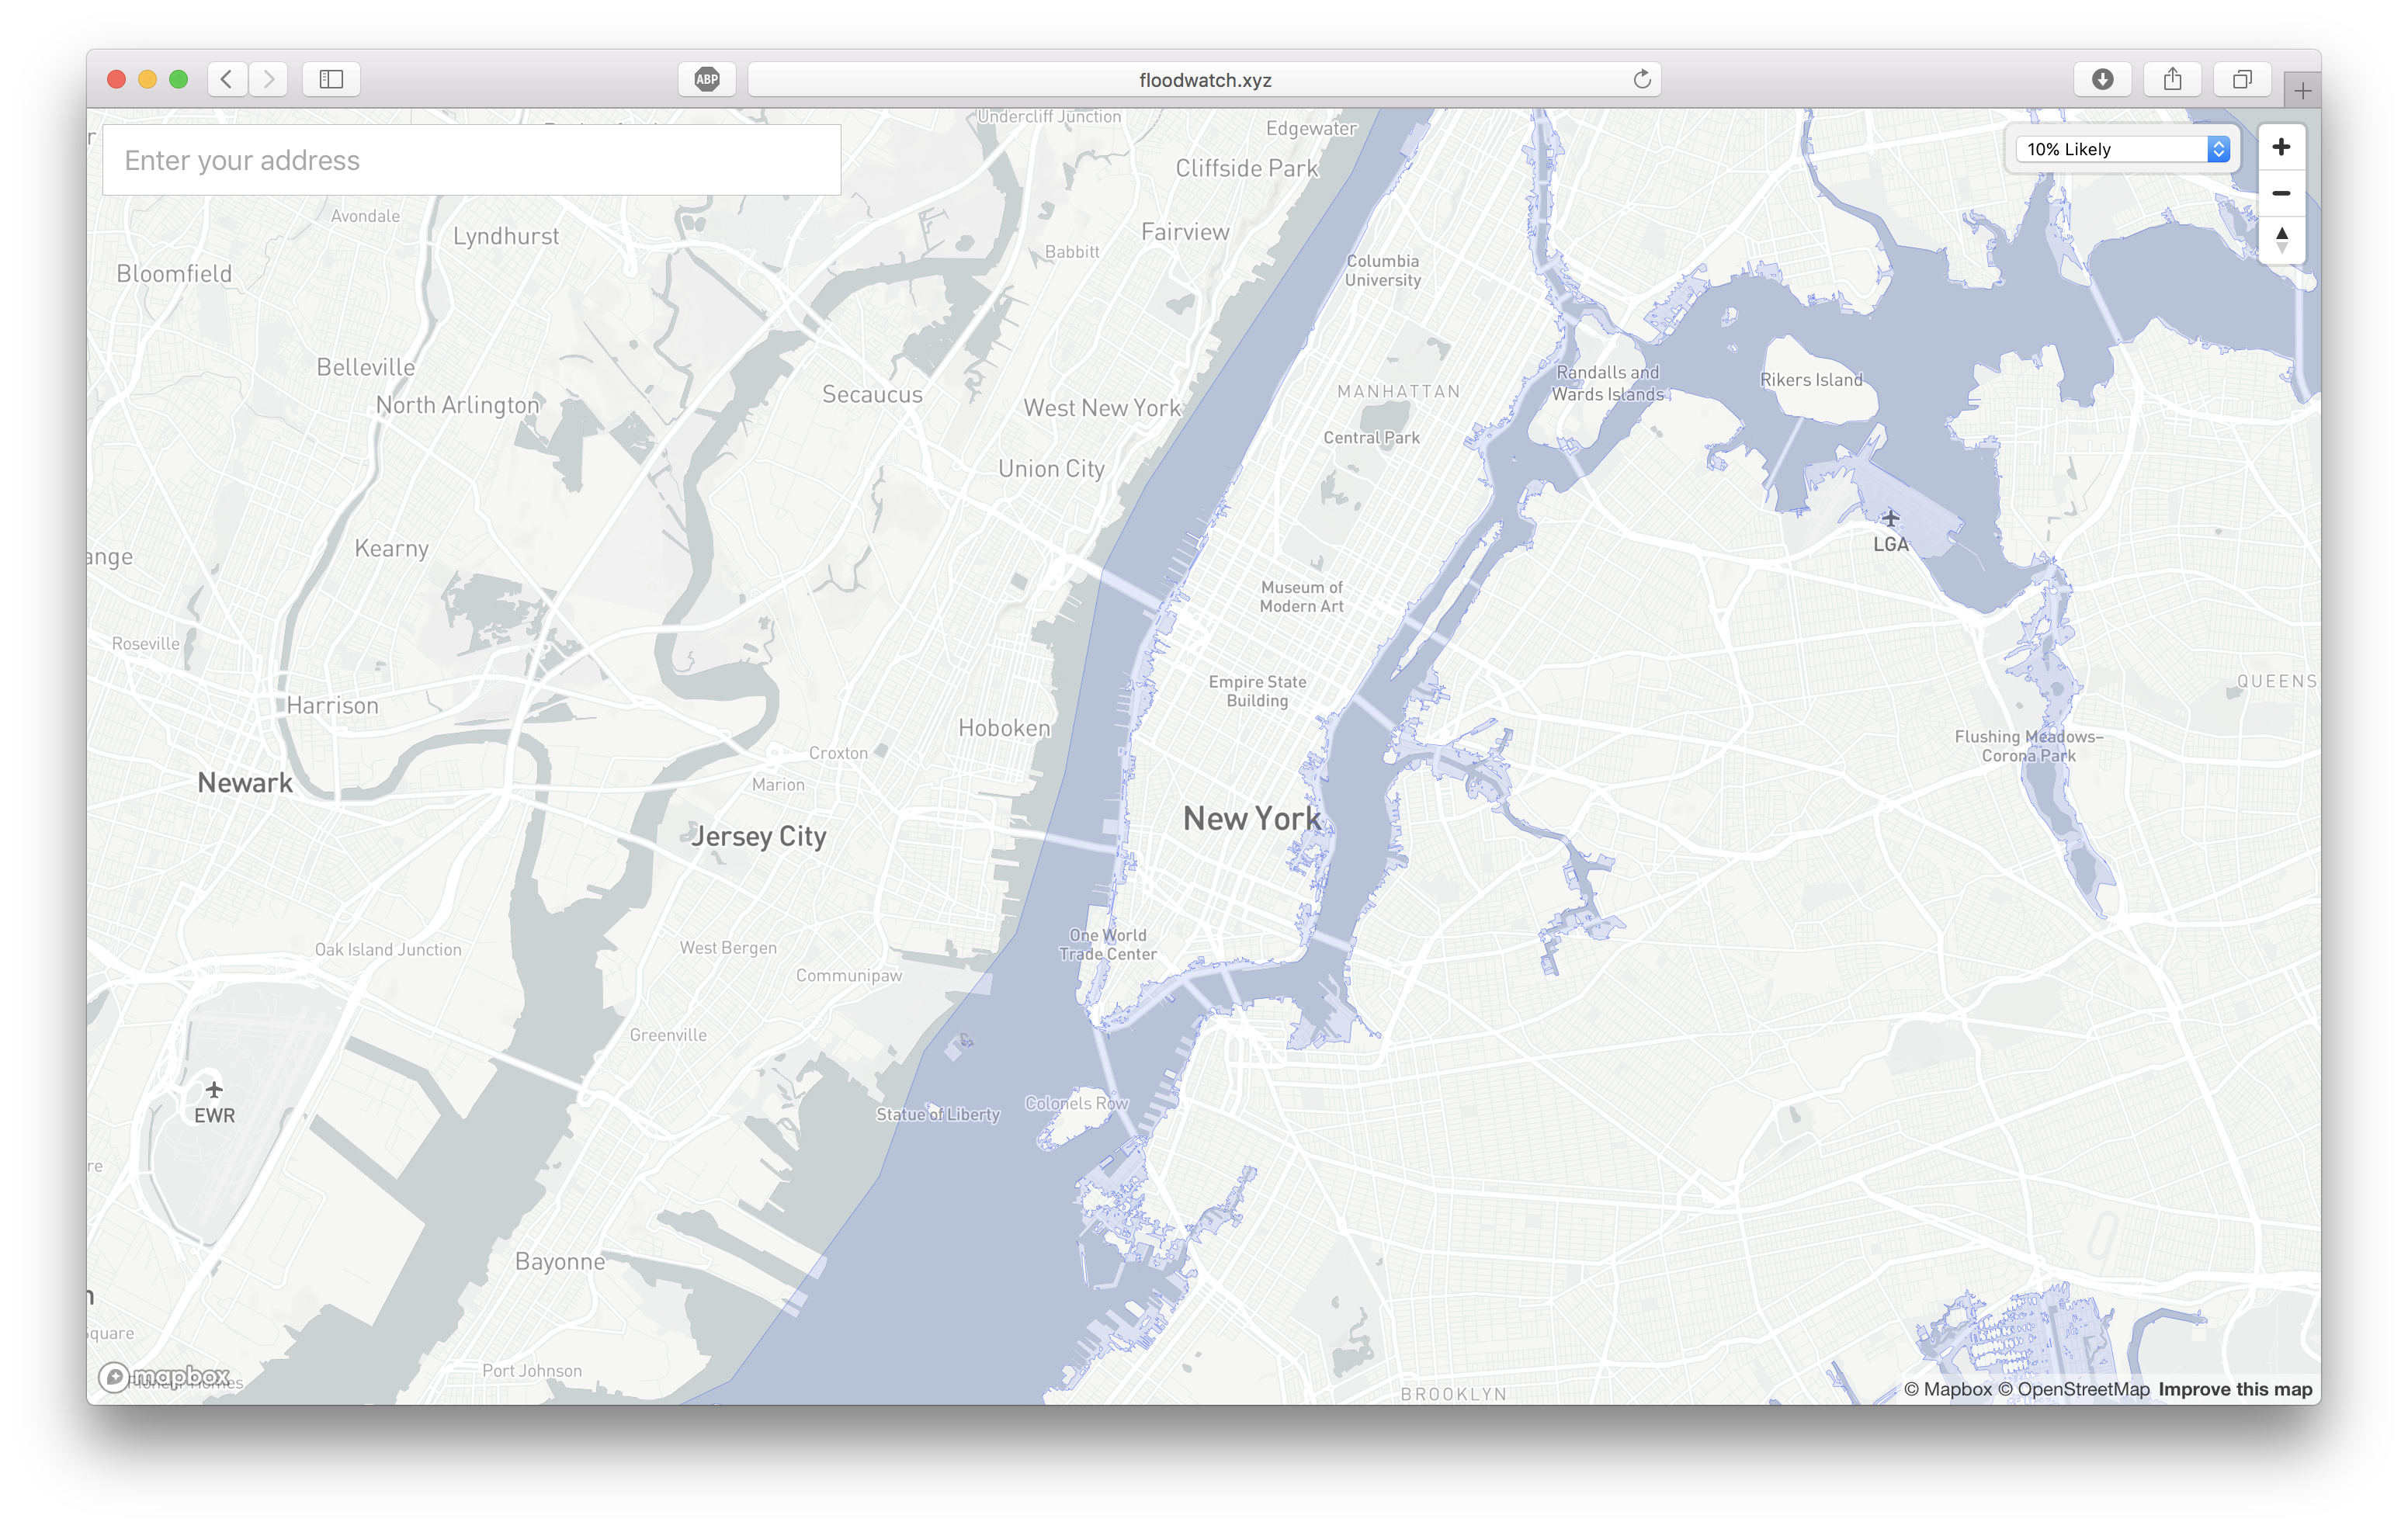
This web app helps people see how they will be impacted by floods in the near future. They can view flood maps of 10, 25, 50, 75, and 90 percent confidence intervals for how much the sea will rise by 2020, 2050, 2080, and 2100. Users can also enter in their addresses and see what the likelihood is that they will be displaced by rising sea levels in the next 5-80 years, and then see the nearest hurricane shelter to where they live.
How we built it
We used Mapbox to create custom maps that could view the flood maps in the web browser. We also used the Google Maps API to calculate how long it would take to evacuate to the nearest hurricane shelter, and used the Giphy API to show an appropriate GIF alongside the result they got.
Challenges we ran into
We started off by using Python to detect whether or not someone was in a flood zone, but that ended up being too slow, so we created a hacky solution on top of our mapping framework to detect that instead. This ended up working really well.
What's next for Flood Watch
Hopefully more flood maps can be made available to the point where this can be used worldwide, not just in NYC.

Log in or sign up for Devpost to join the conversation.