Inspiration
Atlantic Canada has seen increasingly severe flooding events in recent years, from spring snowmelt on the Saint John River to storm surges hitting coastal communities. We noticed that while government agencies like Environment and Climate Change Canada and Water Survey of Canada collect huge amounts of weather and river gauge data, there wasn't an accessible, easy-to-understand tool that turned that raw data into an actionable early warning for everyday residents. We wanted to bridge that gap using AI/ML — giving communities a heads-up before the water rises, not after.
What it does
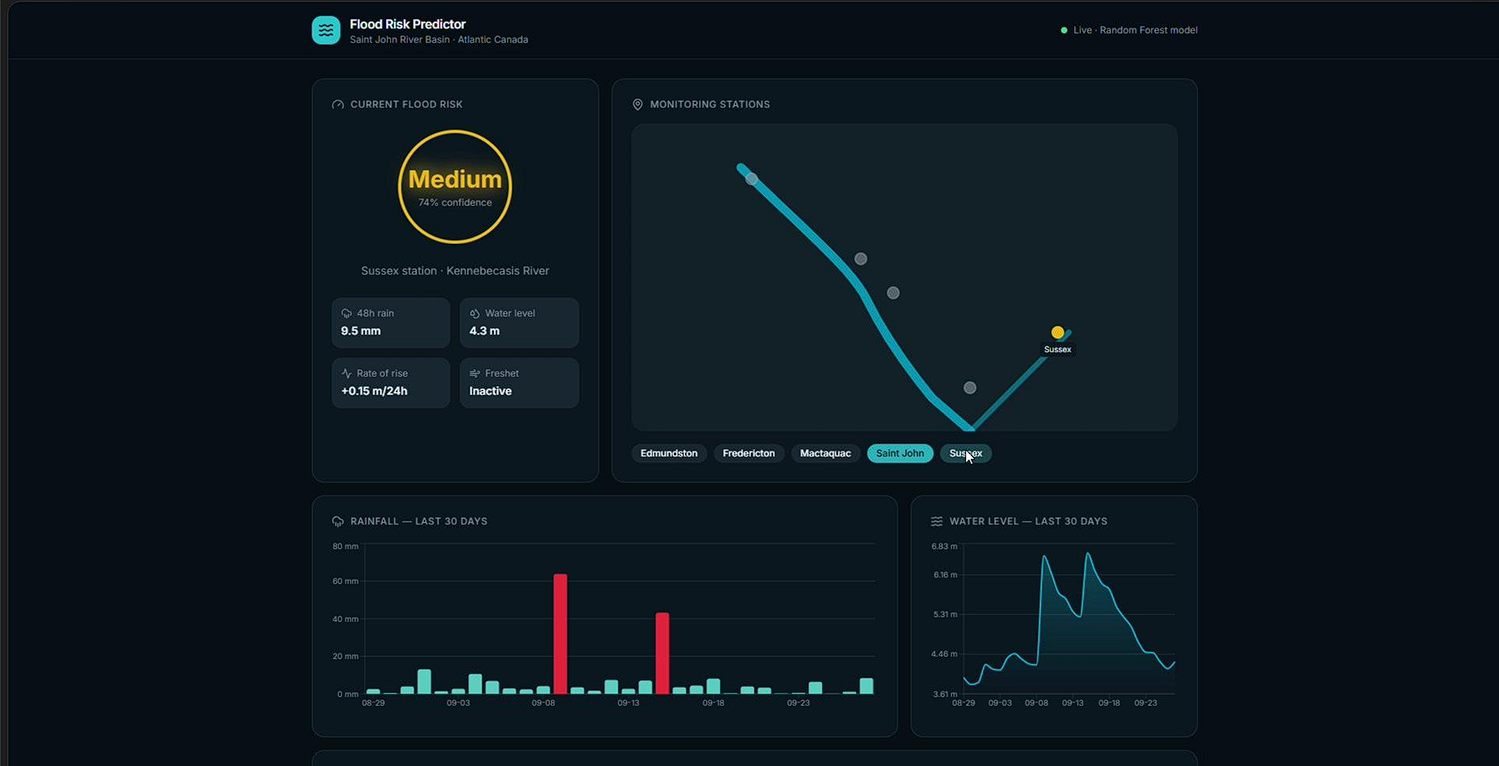
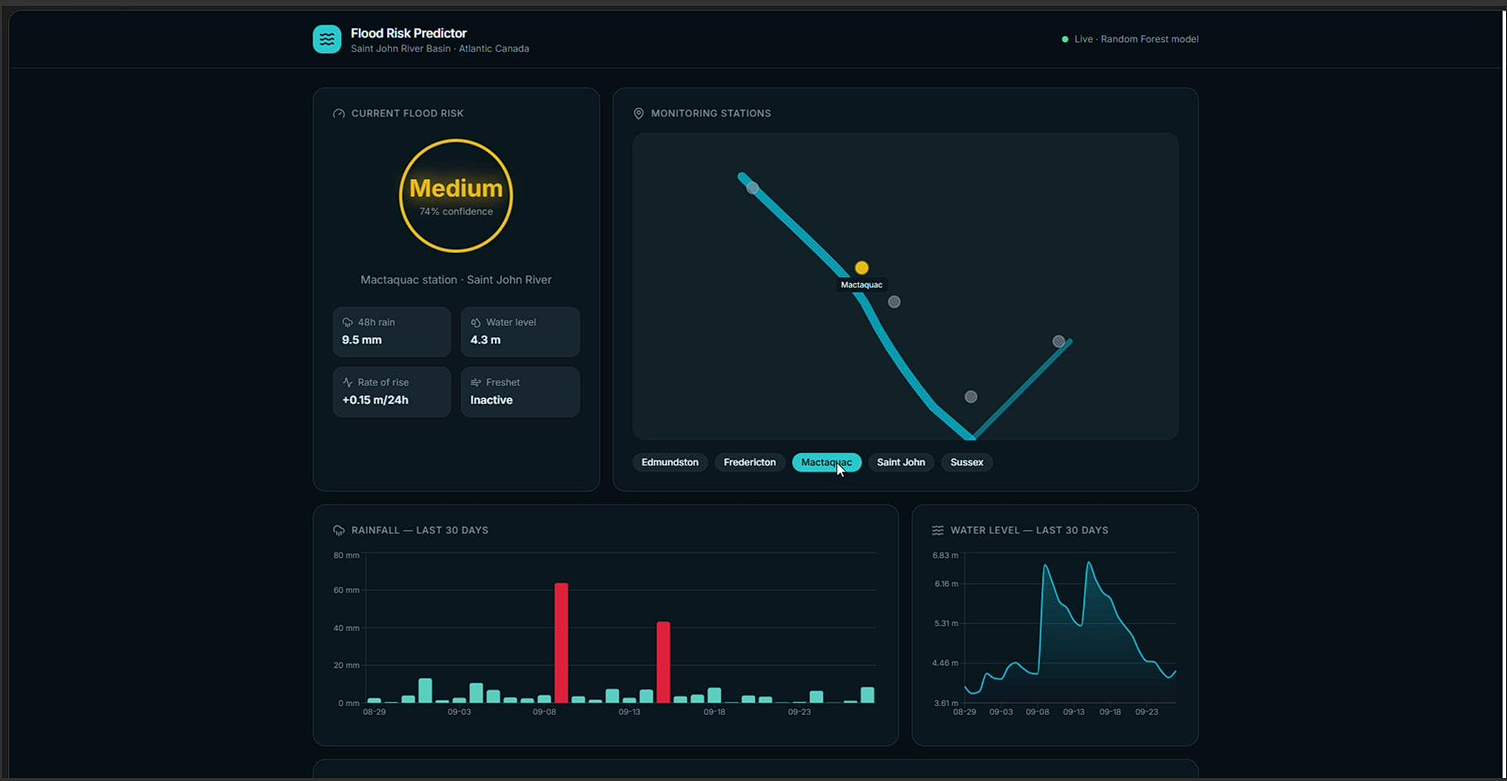
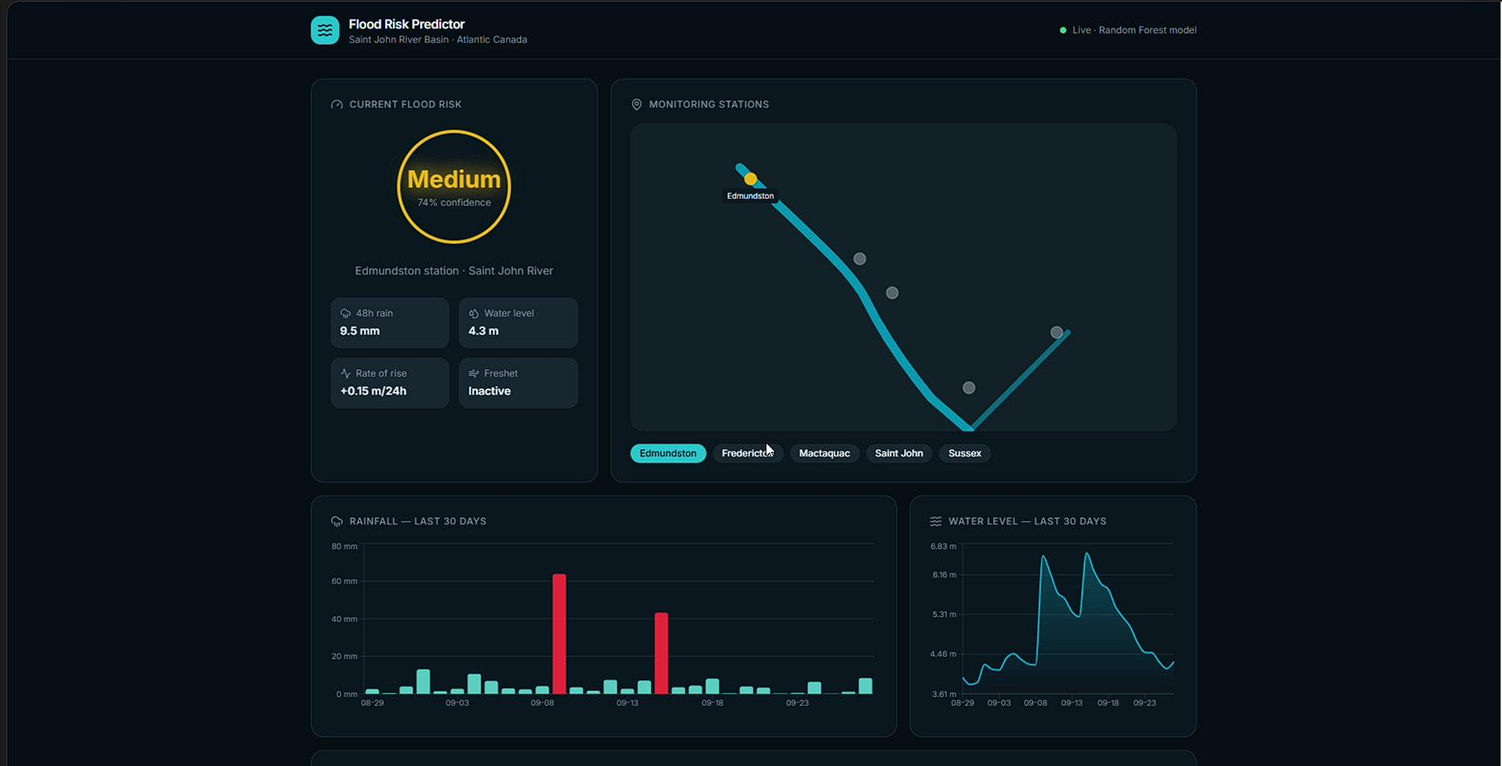
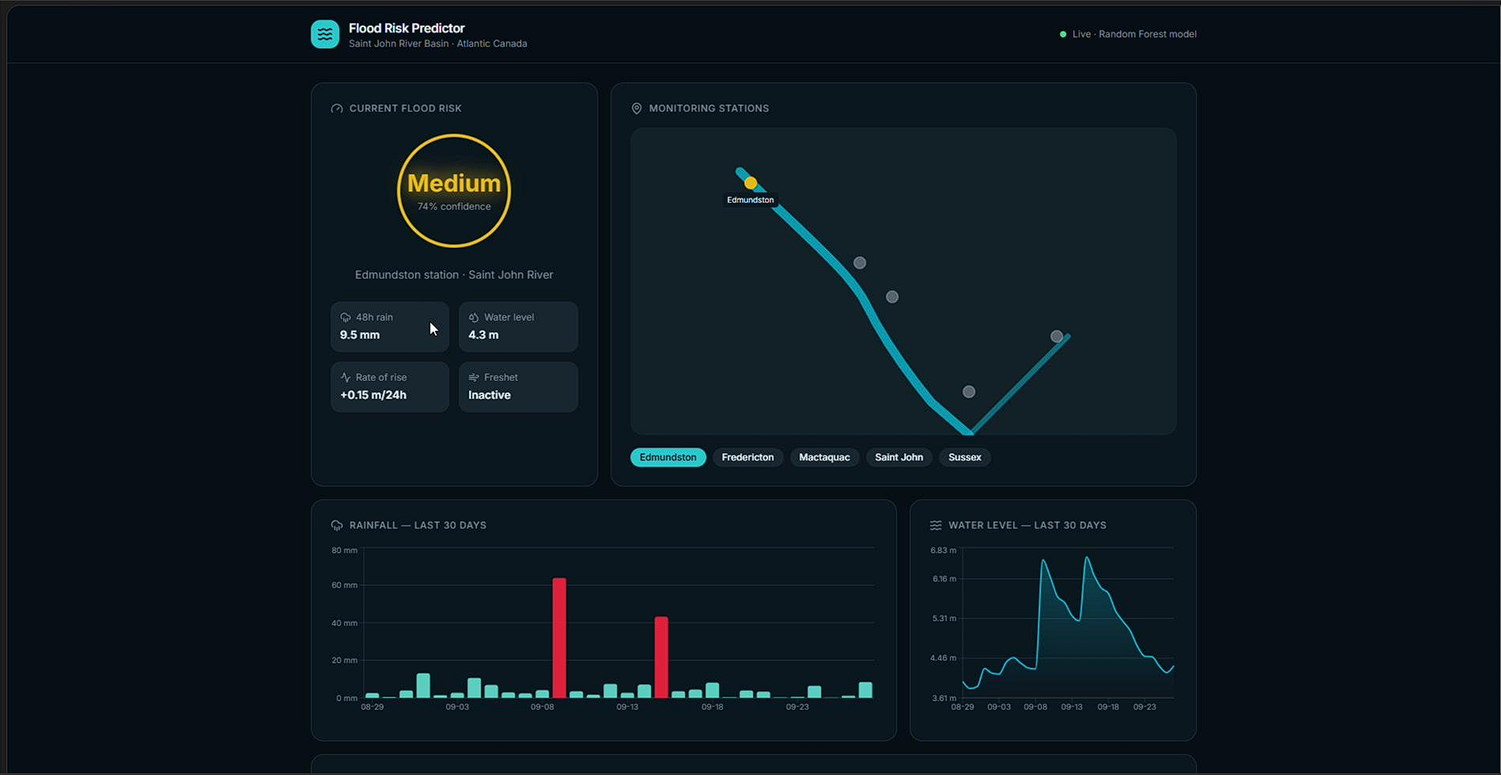
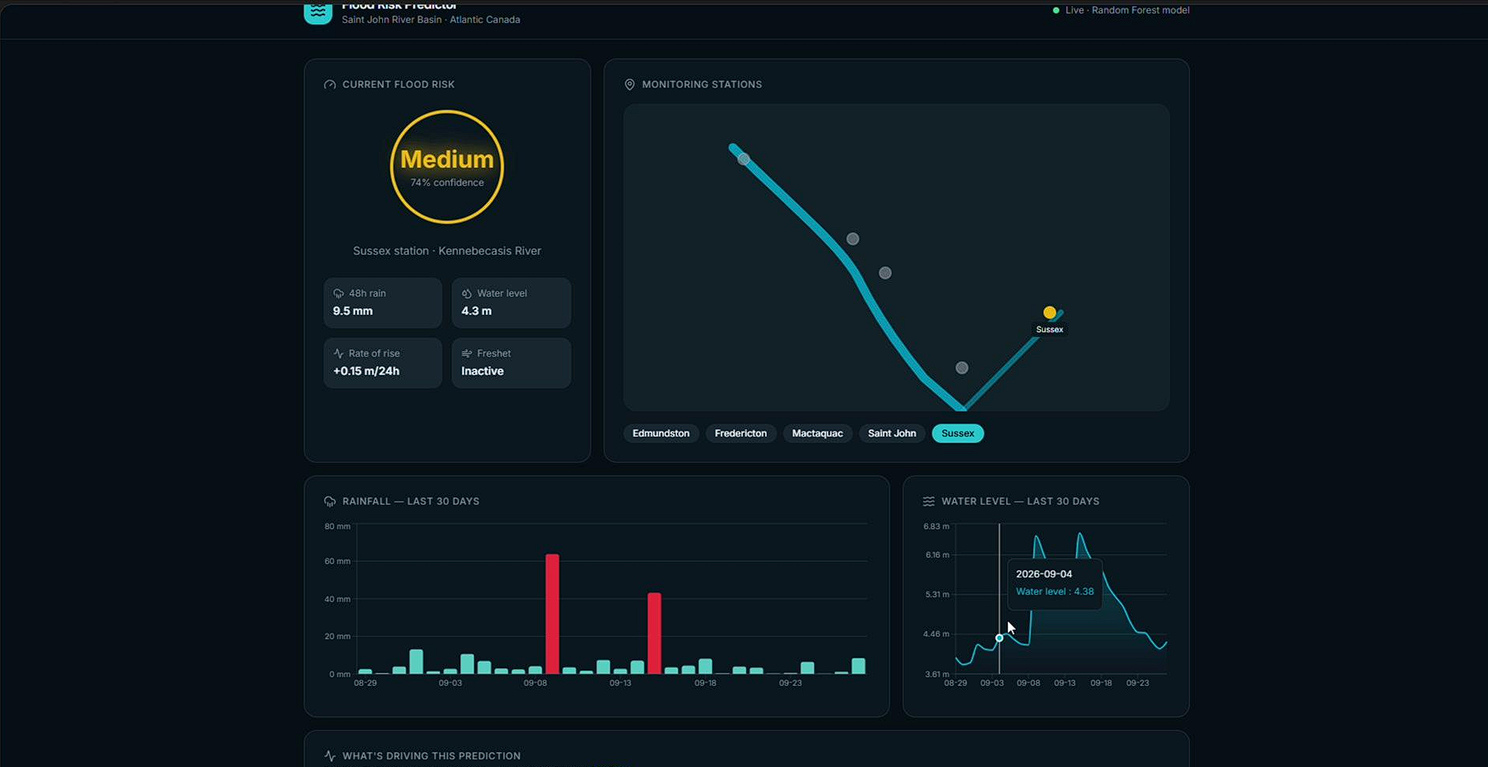
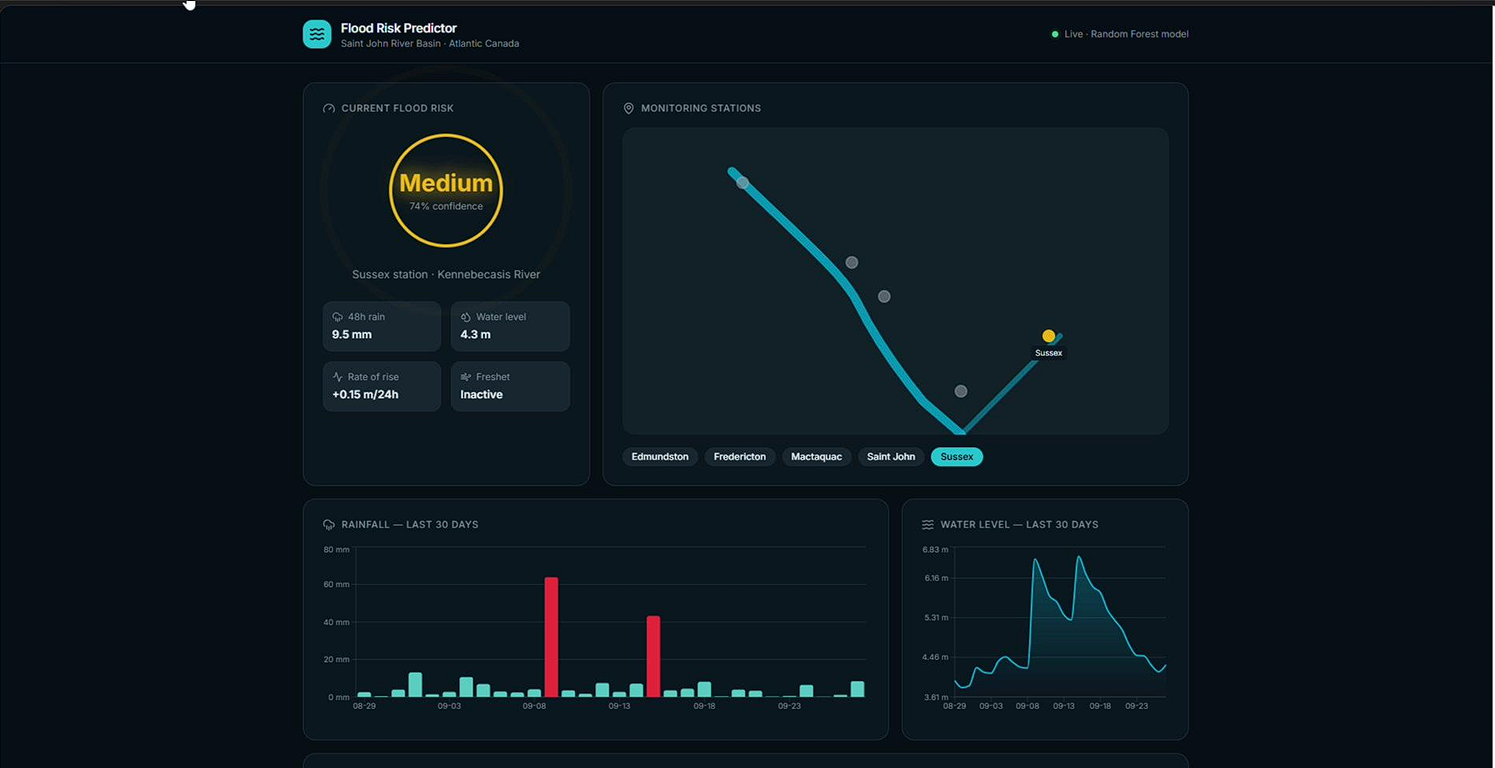
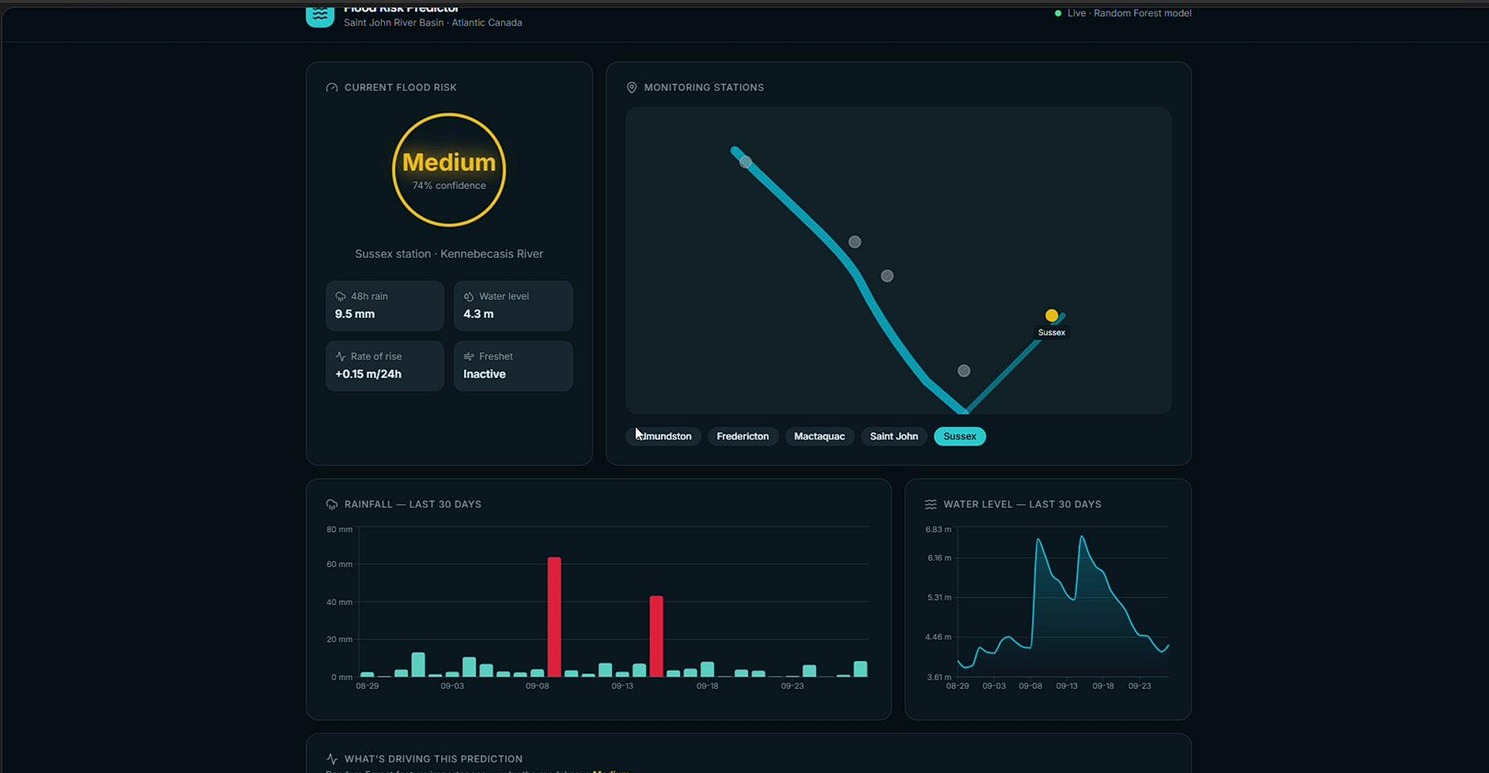
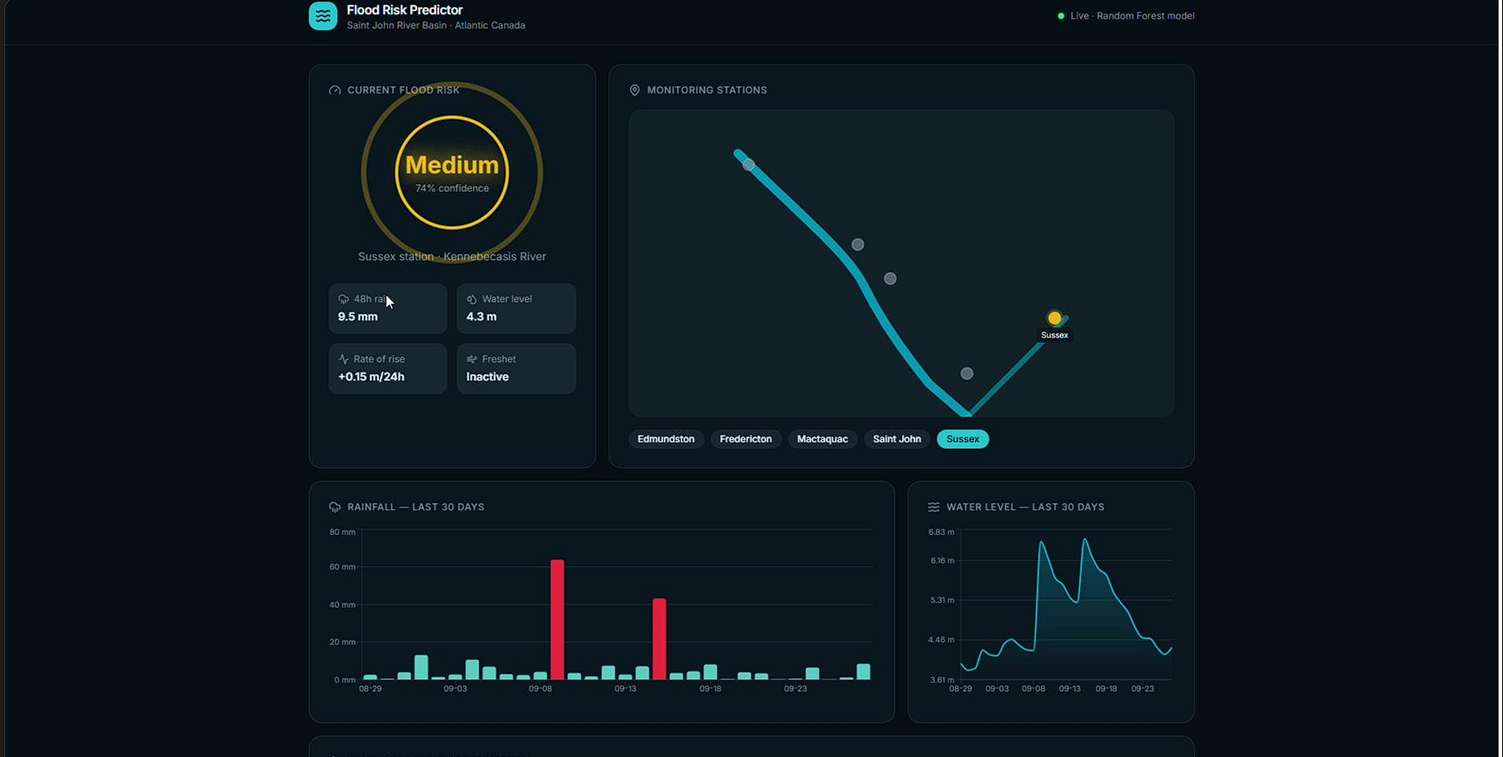
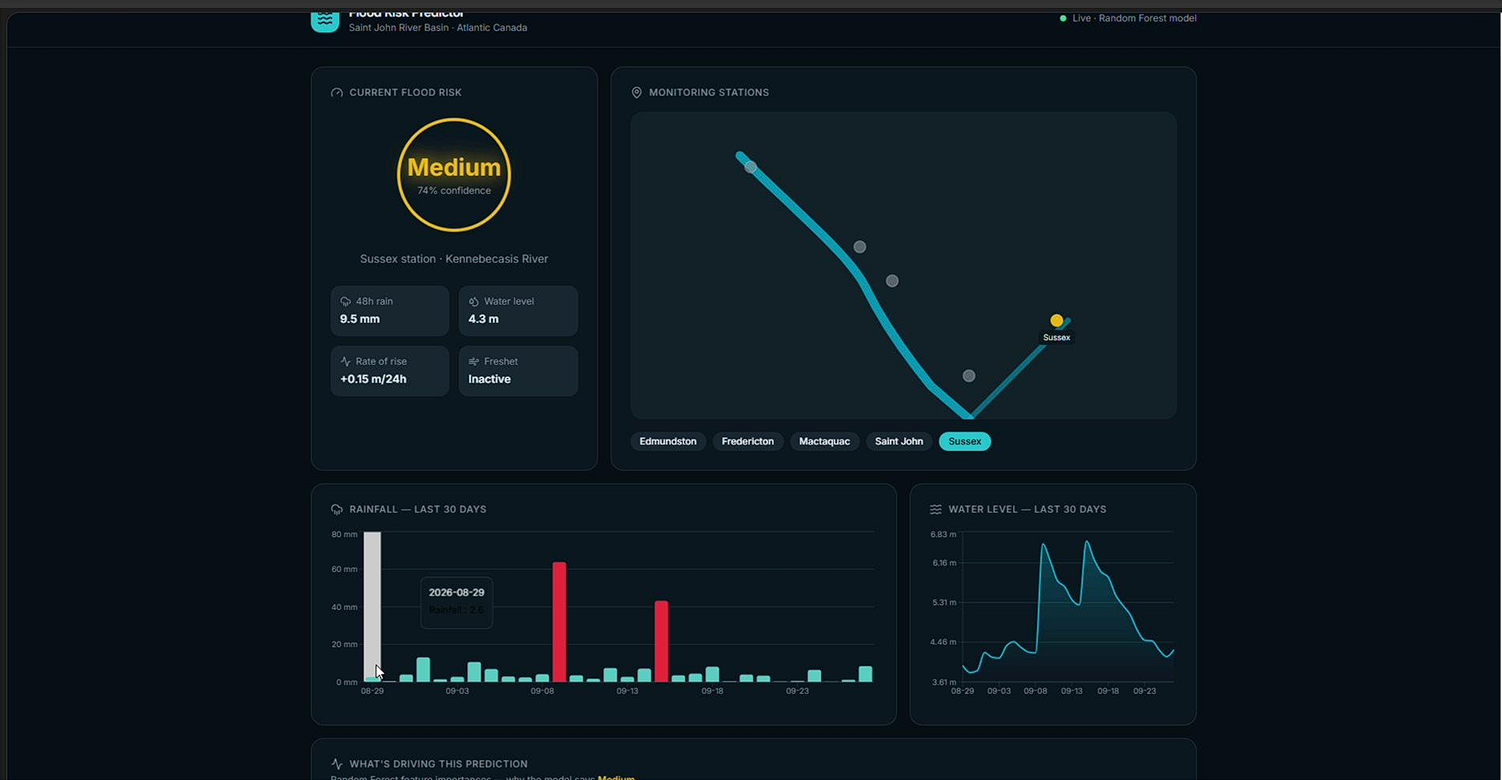
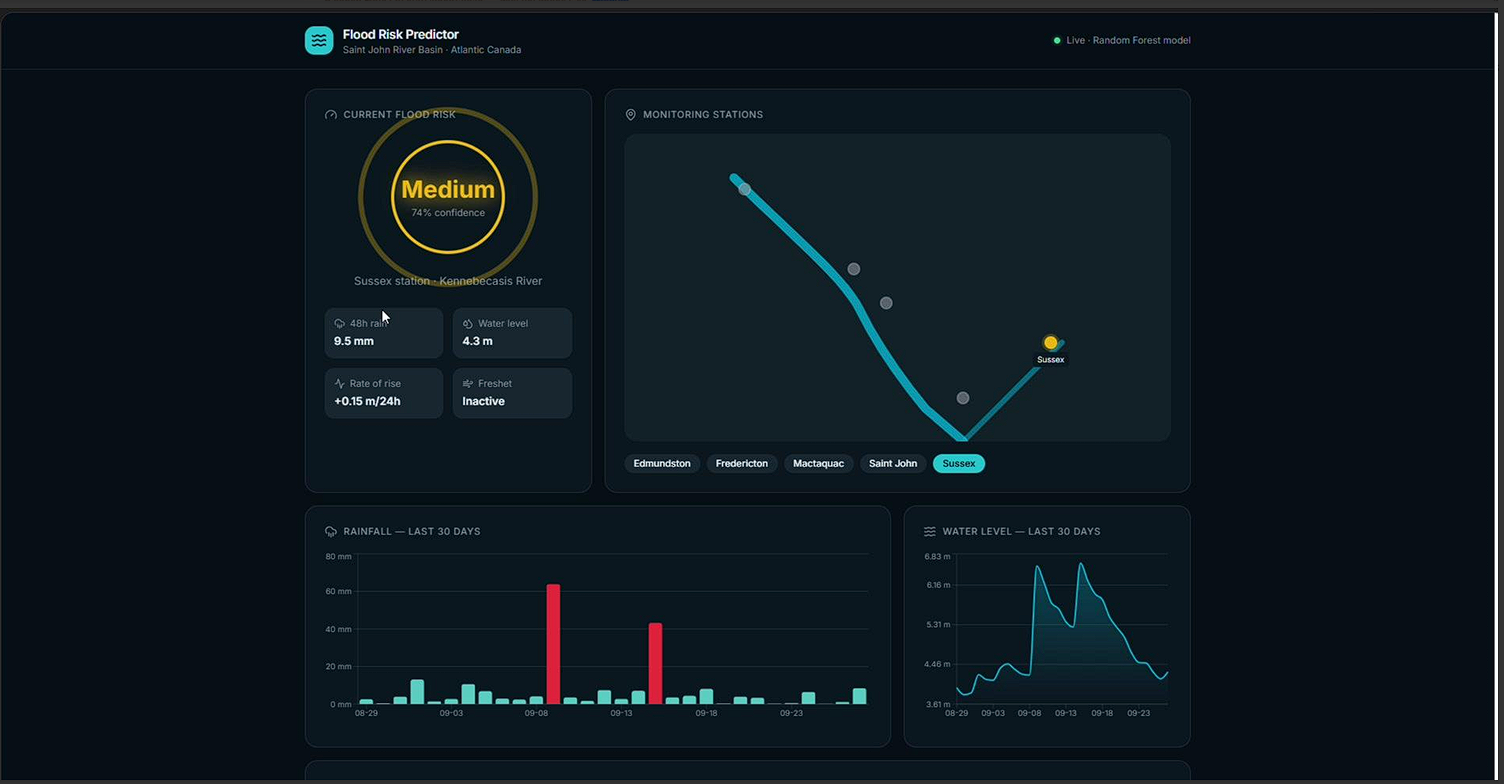
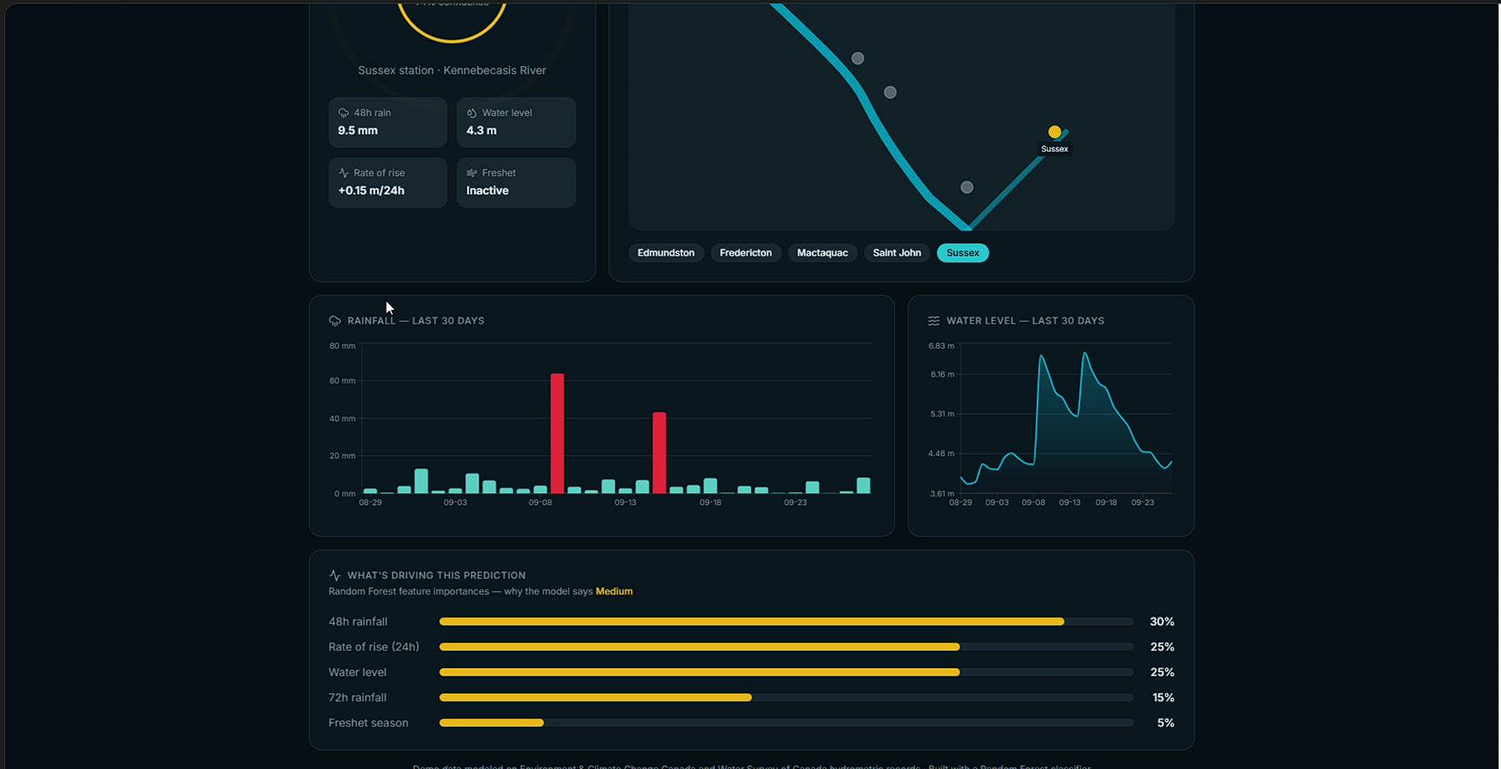
Flood Risk Predictor pulls real-time and historical weather and river gauge data for a river basin and uses a trained machine learning model to classify flood risk as Low, Medium, or High. It displays this on a live dashboard with:
- A map showing the river station location, color-coded by current risk level
- Charts of recent rainfall and water level trends
- A breakdown of which factors (like 48-hour rainfall totals or rate of water level rise) are driving the current risk prediction
The goal is to give residents, municipalities, and emergency planners a simple, visual, explainable early warning system.
How we built it
- Data: Pulled historical and near real-time data from Environment and Climate Change Canada (weather) and Water Survey of Canada (river gauge/discharge levels)
- Feature engineering: Built rolling rainfall sums, lag features for water levels, and seasonal indicators (since spring snowmelt drives much of the flood risk in this region)
- Model: Trained a Random Forest classifier in scikit-learn to predict flood risk category, using historical threshold exceedances as labels
- Backend: Wrapped the trained model in a FastAPI service exposing a
/predictendpoint - Frontend: Built a React dashboard with Leaflet.js for the map and Recharts for time-series visualization, calling the backend API to display live predictions
Challenges we ran into
- Government hydrometric data came in inconsistent formats and had gaps, so we spent significant time cleaning and aligning weather data with gauge readings by timestamp
- Defining a meaningful "flood threshold" for labeling was tricky since actual flood event records were sparse — we had to approximate labels using historical water level percentiles
- Balancing model recall vs. precision was a real design challenge: we wanted to minimize missed flood risk (false negatives) without triggering too many false alarms
- Getting real-time API data and cached historical data to work together smoothly under a hackathon time crunch
Accomplishments that we're proud of
- Successfully built an end-to-end pipeline — from raw open government data to a live, interactive dashboard — within the hackathon timeframe
- Got our Random Forest model to surface genuinely interpretable feature importance, so we could explain why a prediction was made, not just what it was
- Designed a dashboard that a non-technical person (like a local resident or town official) could actually understand at a glance
- Worked with real, messy, public-sector data instead of a clean synthetic dataset — closer to a real-world deployment scenario
What we learned
- How to source and work with Canadian open government hydrometric and climate datasets
- The importance of thoughtful feature engineering (rolling averages, lag features) when working with time-series environmental data
- That model interpretability (feature importance, simple visual explanations) matters as much as raw accuracy when building tools meant for public use
- How to quickly stand up a full-stack ML application — model training, API serving, and frontend visualization — under time constraints
What's next for Flood Risk Predictor
- Expand coverage to multiple river stations across Atlantic Canada with a unified risk map
- Incorporate weather forecast data (not just historical/current) to enable multi-day-ahead predictions
- Add SMS/email alerts (via Twilio) so residents and local officials are notified automatically when risk crosses a threshold
- Experiment with LSTM-based time-series models to compare performance against our Random Forest baseline
- Partner with municipal emergency management offices to validate predictions against real flood event data and improve accuracy over time
Built With
- api
- backend
- css
- fastapi
- forest
- frontend
- javascript
- leaflet.js
- lovable
- ml/data
- node.js
- numpy
- pandas
- python
- react
- recharts
- rest
- scikit-learn
- tailwind
- typescript
- vercel

Log in or sign up for Devpost to join the conversation.