-
-
Figma
Inspiration
Our world is changing fast. From small islands facing rising sea levels and total immersion, to recent tragic floods in countries like France where entire towns were submerged in hours, no one is completely safe anymore. Water, our most precious resource, is becoming one of our greatest dangers. Floods affect 1 in 5 people worldwide every year. The communities bearing the heaviest burden, smallholder farmers in Africa, farmers in the Sahel, residents across Asia, and local leaders in South America, are precisely those with the least access to reliable flood risk information, the least literacy in technical tools, and the least capacity to recover from a single catastrophic season. That injustice is what inspired us. We wanted to build something scientifically rigorous, genuinely accessible, and immediately usable by the people who need it most.
What the Flood Risk Calculator Does?
The Flood Risk Calculator is a complete, interactive web application that lets any user, farmer, city resident, or local leader, assess their personal flood risk level in minutes and receive clear, actionable recommendations tailored to their geography and profile. The Application allows user to input factors like deforestation, rainfall, urbanization and Model predicts flood risk level (low/medium/high) also the App shows actionable recommendations based on the risk Three pillars power the app:
- Data Two validated datasets: (1) Kaggle Flood Prediction- 6,337 rows, 15 features, binary classification, Usability: 0.8 and (2) FloodCastBench, ML-optimised Flood Dynamics, 30K+ rows, 30m spatial resolution, hydrodynamic RWR simulation, calibrated across Pakistan, Mozambique, Australia, and the UK.
- ML Model Fourier Neural Operator (FNO) trained on FloodCastBench. The user adjusts three sliders, Deforestation, Urbanization, and Climate Change Impact, and the model predicts flood probability, outputting Low, Medium, or High risk with an explanation of key drivers.
- The App Built in Streamlit. Research, presentation, and design create a complete interactive tool with audio narration, icon-driven interface, regional guidance, and actionable recommendations by user type.
How the Sliders Work? The sliders let t users adjust three variables: deforestation, urbanization, and climate change impact from low to high. Each slider modifies ML model inputs (e.g., land cover friction from FloodCastBench, rainfall from Kaggle data), instantly recalculating and visualizing flood probability, depth, and affected area on interactive maps for any global location. Africa (e.g. Sahel): Deforestation: increases storm frequency and intensity and raises local river rise. Urbanization: reduces infiltration and overwhelms drainage. Climate: increases dry season severity, making sudden flash floods more dangerous. Asia (e.g. Monsoon regions): Deforestation: exposes soil to intense rainfall, accelerating runoff. Climate: variables intensify monsoon rainfall frequency and risk. Urbanization: hard surfaces amplify urban flooding. South America (e.g. Amazon region): Deforestation: removes water regulation capacity of the rainforest. Climate: El Niño patterns and increased rainfall. Urbanization: informal settlements in flood-prone areas with no drainage infrastructure.
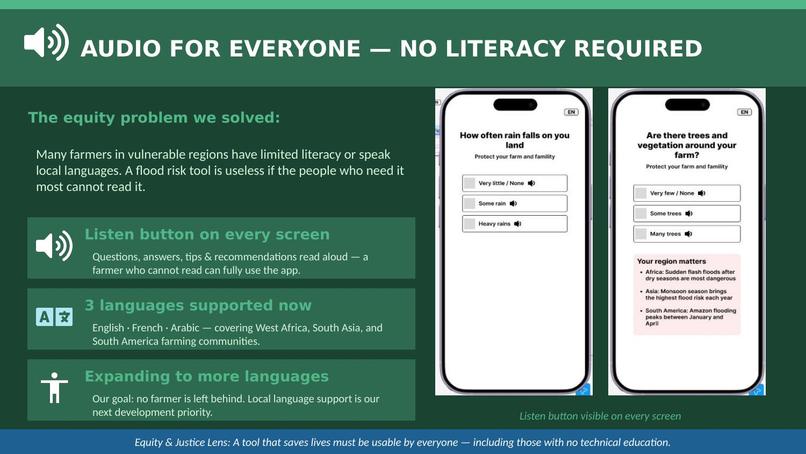
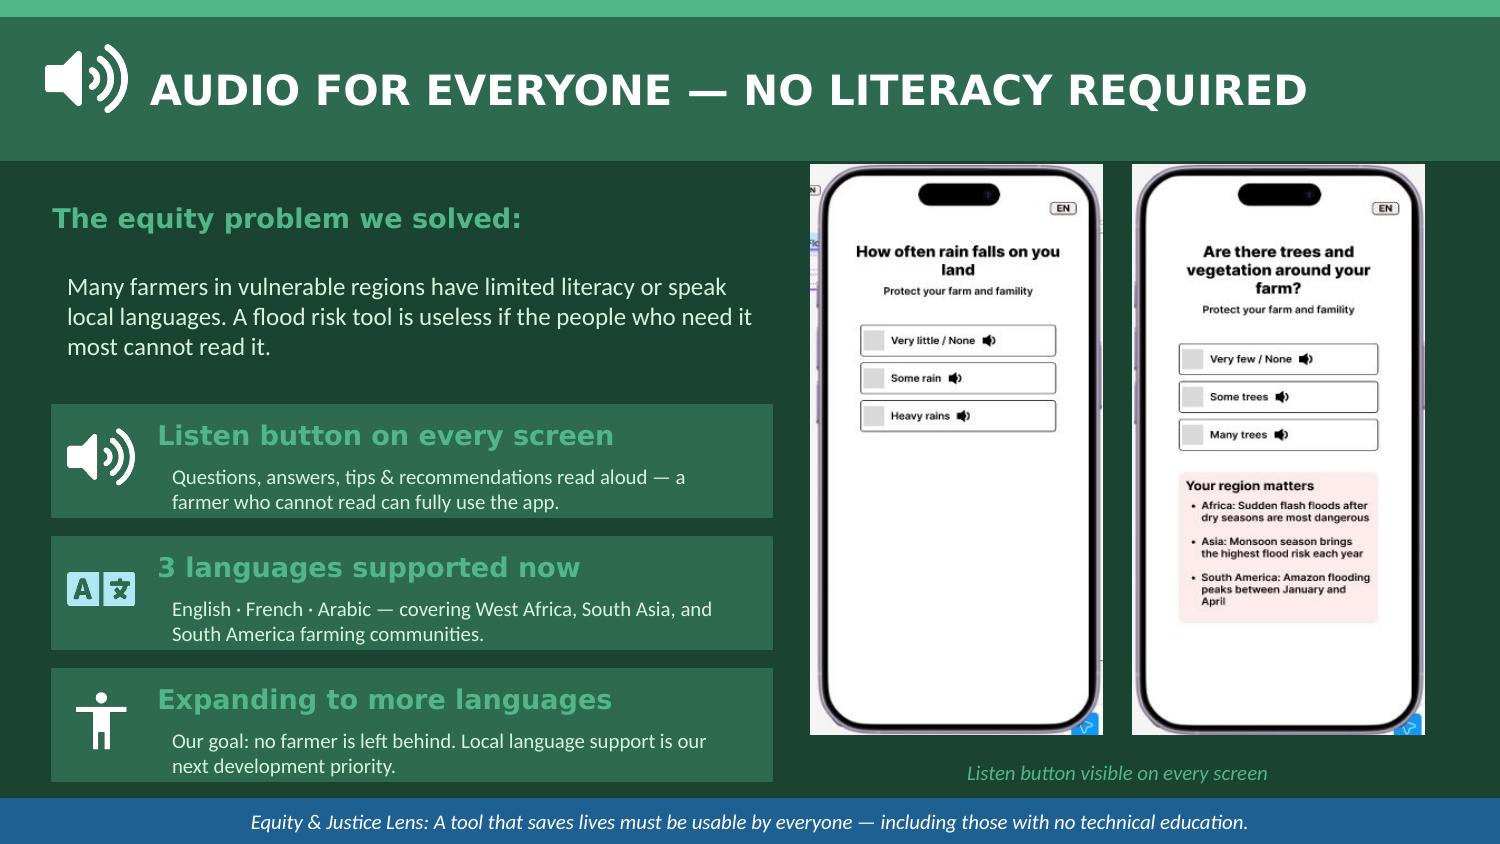
Audio Feature: No Literacy Required Many farmers in vulnerable regions have limited literacy or speak local languages that differ from written ones. A flood risk tool is useless if the people who need it most cannot read it. That is why we added a Listen button on every screen of the app. By pressing it, users hear all questions, answers, tips, and recommendations read aloud, so a farmer who cannot read can fully use the app and understand exactly what risk they face and what steps to take. We currently support English, French, and Arabic. Our goal is to expand to Hindi, Swahili, Bengali, and Spanish, covering the largest farming populations in our three target regions.
Who it Serves The Flood Risk Calculator is a complete, interactive web application that lets any user, farmer, city resident, or local leader, assess their personal flood risk level in minutes and receive clear, actionable recommendations tailored to their geography and profile. The Application allows user to input factors like deforestation, rainfall, urbanization and Model predicts flood risk level (low/medium/high) also the App shows actionable recommendations based on the risk Three pillars power the app: Our global reach diagram shows the full scope of communities this tool is designed for: Farmers in the Sahel: smallholder farmers with no access to technical tools or government early-warning systems Residents in Asia: communities in monsoon-affected South and Southeast Asia facing intensifying annual flooding City Residents: urban populations in informal settlements built on flood plains with no drainage infrastructure Local Leaders: village and municipal leaders who need data to make decisions about land use and emergency planning Mayors in Europe: city authorities who need risk assessment tools as climate impacts reach developed nations Prototype ready. International validation complete. Protecting the land, one farm at a time, across Asia, Africa, South America, and beyond.
How Was The Flood Risk Calculator Application Built?
The application was built across three integrated workstreams. On the design side, all app screens were designed in Figma with a focus on accessibility: simple language, clear icons, audio support, and a multilingual interface built specifically for farmers with limited technical literacy. Existing flood risk tools were also researched to identify gaps and define what makes our solution unique. On the technical side, the ML model was developed using a flood prediction dataset of over 50,000 rows and integrated directly into the user interface. The application was then built and deployed as a live Streamlit web app, making it immediately accessible from any browser without installation. The research layer grounded every design and technical decision in data, validating the dataset, conducting geographic risk analysis across Africa, Asia, and South America, and ensuring each slider variable, recommendation, and regional guidance point was backed by peer-reviewed science. The result is a fully functional, deployed tool where design, machine learning, and research work together, not three separate outputs, but one coherent product.
Challenges We Faced
Coordinating across time zones over meant fast decisions and some challenges, however we also coordinated asynchronously. We had challenges as well in the areas below.
Data Simplification: Our primary challenge was translating a complex 50,000-row climate dataset into clear, actionable advice that remains useful for non-technical users.
Inclusive Design: We recognized that high risk areas often face literacy barriers, which led us to pivot our strategy to include a three language audio feature for better accessibility. Therefore, designing accessible UI in Figma for global users using simple language, multilingual while keeping the interface intuitive amid complex predictions. Rapid Synthesis: Working as a new team on a tight deadline required us to quickly align our technical ML modeling with deep-dive geographic research into one cohesive story.
Accomplishments that We Are Proud of?
A working, live application. not a prototype accessible right now at flood-risk-5y9mh9rwktotrfpumdqjr5.streamlit.app An ML model with RMSE 0.002 and CSI 0.86, validated across four countries on two datasets with cross-regional transfer capability Audio narration on every screen in three languages, making the app usable by people with limited literacy International validation: FloodCastBench data spans Pakistan, Mozambique, Australia, and the UK- proving our model generalises across geographies Research grounded in 11 peer-reviewed and institutional sources, making every slider, threshold, and recommendation scientifically defensible
What We Learned?
Equity-centered design is not a feature you add at the end. Every decision, language choice, icon selection, audio inclusion, regional focus, is an equity decision made from day one. Fourier Neural Operators outperform traditional CNN-based approaches for flood dynamics prediction because they can capture multi-scale spatial patterns in hydrodynamic data more efficiently. The most impactful climate tools are not always the most technically complex. A clean, accessible app that real people can use beats a sophisticated model locked behind a technical interface.
What's Next for Flood Risk Calculator: Global Tool for Climate Flood Risks?
Near-term (Next Steps 1) Satellite Imagery: integrate Google Earth Engine satellite data to automatically detect deforestation and urbanization levels in a user’s area, removing the need for manual slider input CO₂ Emission Calculator: add a module that helps users understand their land’s carbon footprint alongside flood risk More Languages: expand audio and interface support to Hindi, Swahili, Bengali, and Spanish, covering the largest farming populations in our three target regions
Longer-term (Next Steps 2) City & Mayor Modules: expand the tool beyond farmers to city residents and local authorities, creating a complete safety network for every community Offline Mode: make the app functional without reliable internet access, critical for rural farming communities with limited connectivity Expanded Modules: dedicated modules for city residents and local leaders, creating a complete safety network for every community
Built With
- 337-rows)-+-floodcastbench-(30k+-rows
- 4-countries)-text-to-speech-audio-in-english
- and-arabic-sar-satellite-imagery-?-sentinel-2-land-cover-?-gpm-rainfall-data-?-fabdem-terrain-research:-ipcc
- fao
- figma
- floodcastbench
- french
- nature-communications
- oecd
- phyton
- python-?-streamlit-?-fourier-neural-operator-(fno)-?-scikit-learn-?-pandas-?-numpy-kaggle-flood-prediction-dataset-(6
- scientific
- unep
- world-bank

Log in or sign up for Devpost to join the conversation.