-
-
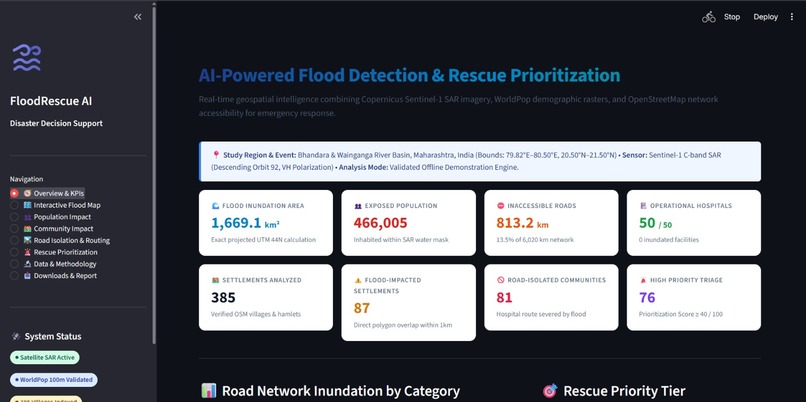
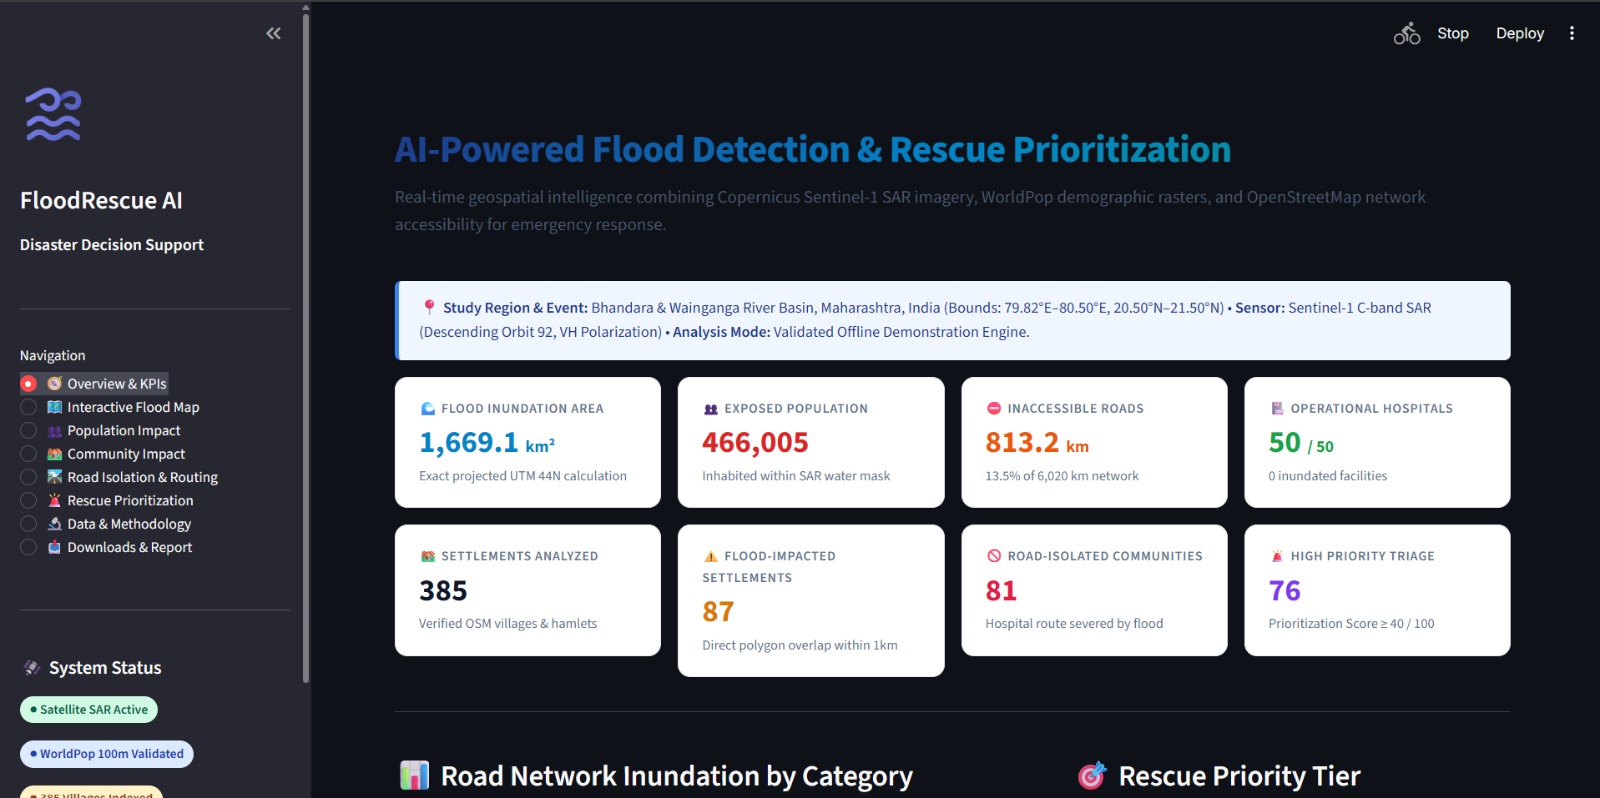
Flood Rescue AI Dashboard — Key flood-impact indicators, population exposure estimates, and rescue-priority insights in one place.
-
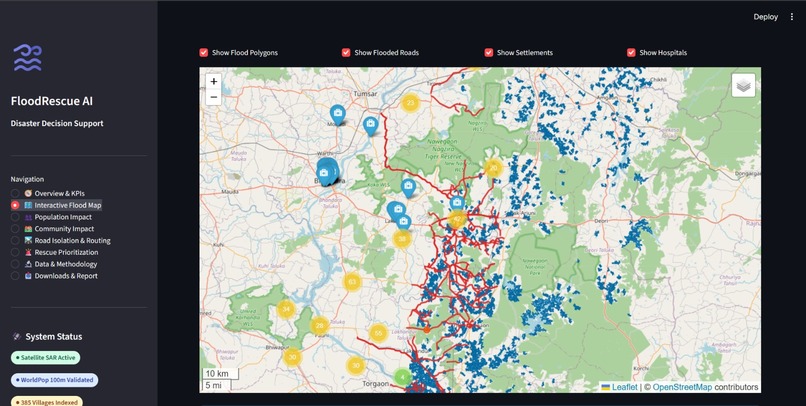
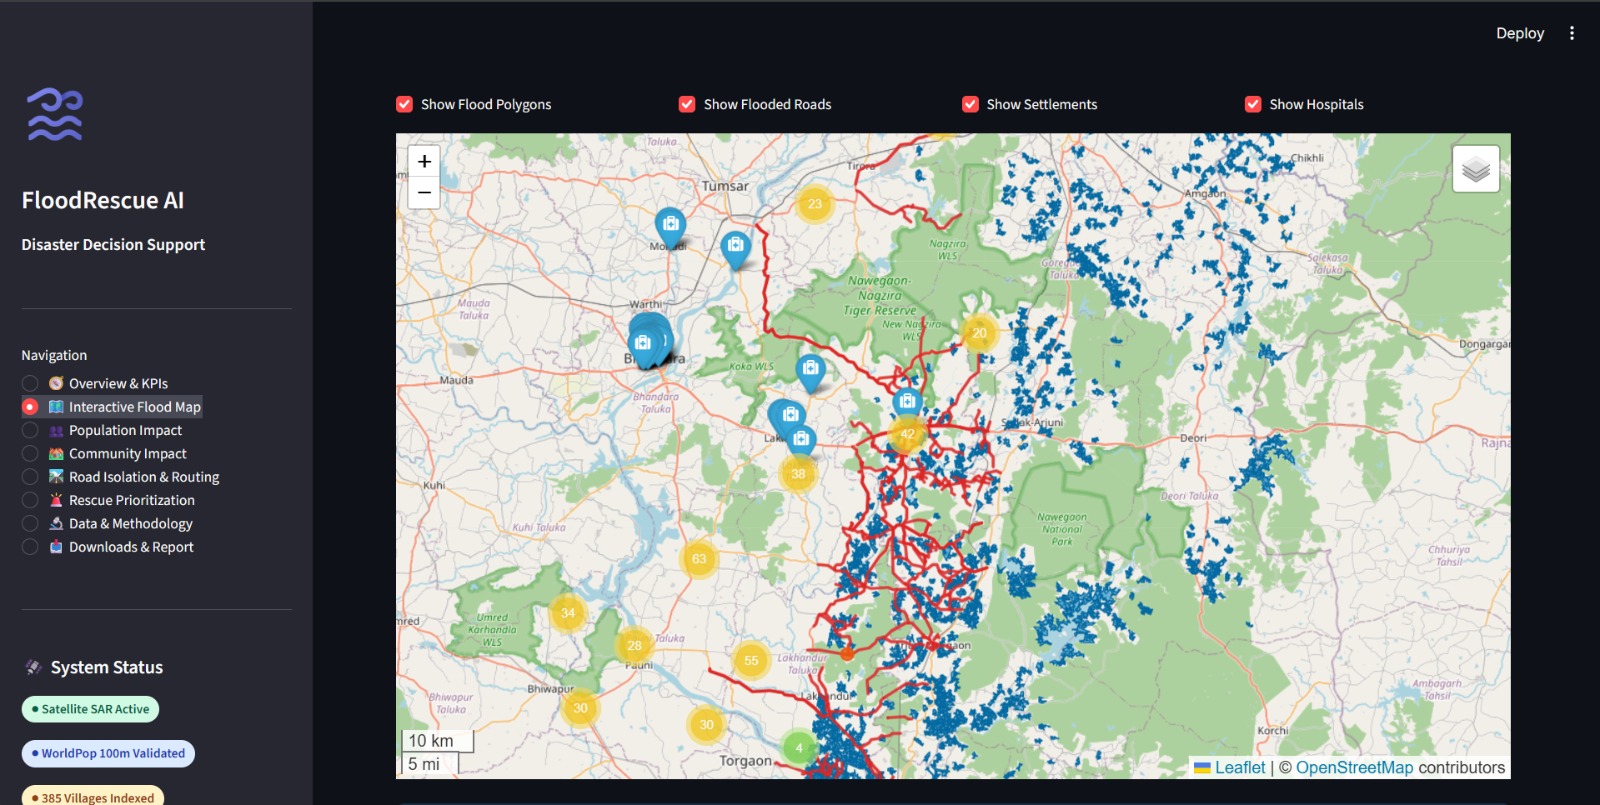
Interactive Flood Map — Visualizing flood-affected areas, nearby communities, and geographic features to support disaster-response planning.
Inspiration
Floods can rapidly disrupt communities, damage infrastructure, and make rescue operations difficult. During a disaster, understanding which areas are flooded, how many people may be affected, and which roads could become inaccessible is essential for effective response planning.
We were inspired to build Flood Rescue AI, a geospatial disaster decision-support prototype that brings important flood-related information together in one interactive dashboard. Our goal is to make complex geographical data easier to understand and help responders explore areas that may need urgent attention.
What it does
Flood Rescue AI provides an interactive dashboard for exploring flood impacts and potential rescue priorities.
Key features include:
- Flood Visualization: Displays flood-zone boundaries on an interactive map using satellite-derived flood data.
- Population Impact Analysis: Helps explore population potentially exposed to mapped flood areas.
- Community Impact Assessment: Highlights settlements that may be affected by flooding.
- Road Accessibility Analysis: Visualizes potentially inaccessible roads and isolated communities.
- Rescue Prioritization: Presents priority indicators to support the identification of areas that may require further investigation.
- Disaster Overview Dashboard: Summarizes key indicators to make flood-impact information easier to interpret.
- Data and Reports: Organizes project information and supports reviewing the analysis.
The dashboard is designed to support situational awareness and preliminary planning, rather than replace verified emergency-service information.
How we built it
We built Flood Rescue AI using Python and Streamlit, creating a web-based dashboard for geospatial visualization and disaster-impact exploration.
Our approach combines:
- Google Earth Engine: Used to process and explore satellite imagery.
- Sentinel-1 SAR: Provides radar imagery that can help identify potential flood extent, including under cloudy conditions.
- WorldPop: Provides gridded population data for exploring potential population exposure.
- Geospatial datasets: Represent flood zones, settlements, roads, and other relevant geographic features.
- Interactive dashboard: Presents maps, indicators
Built With
- data
- geospatial
- google-earth-engine
- python
- sentinel-1-sar
- streamlit
- worldpop

Log in or sign up for Devpost to join the conversation.