Monitor Deforestation in Mole National Park and Ankasa Game Reserves
Inspiration
In 2010, Ghana had 7.00Mha of natural forest, extending over 30% of its land area. In 2021, it lost 101kha of natural forest, equivalent to 62.9Mt of CO₂ emissions. This has lead to the drying up of headwaters of water bodies which supplies water to major cities in the country. As a result of logging activities in our forest, Ghana has had a higher percentage of deforestation since the 90's.
What it does
Sentinel-2 (an Earth observation mission from the Copernicus Programme that systematically acquires optical imagery at high spatial resolution (10 m to 60 m) over land and coastal waters.) using the bands from 1,2,3,4,5,6,7,8,8a,9,10,11,12 we will compare images from Mole National Park in the Savannah region of Ghana and Ankasa Game Reserve in the Western Region of Ghana
DataSet Used
Sentinel-2 L1C
Forest Reserves and National Parks Covered
How we built it(Steps)
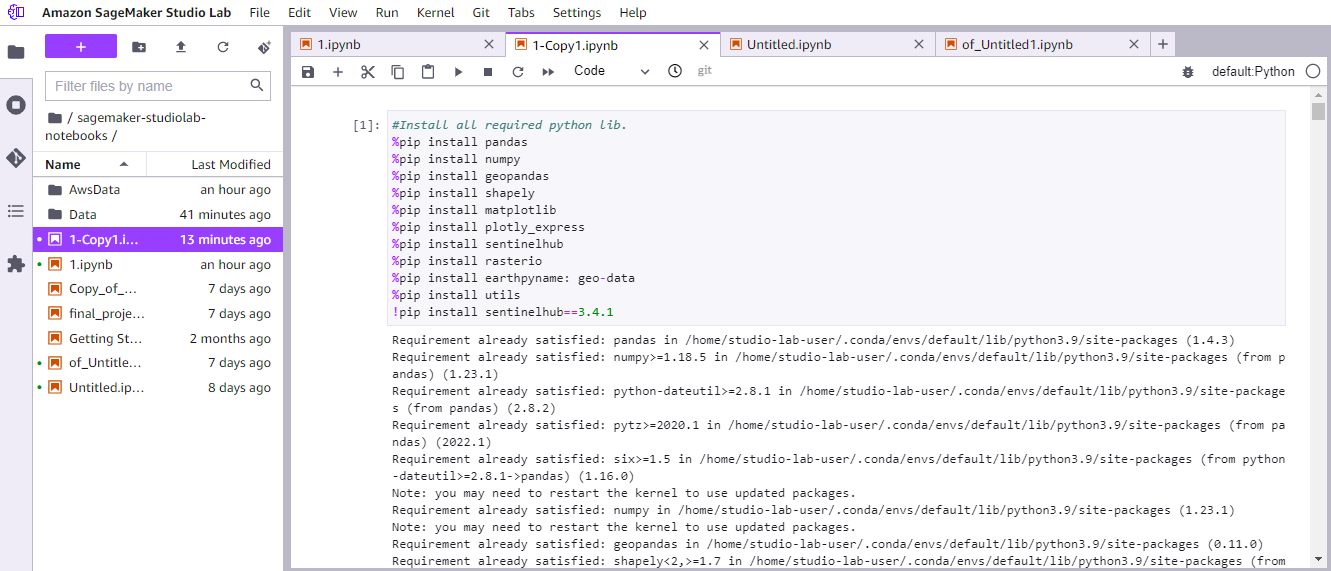
- Download and Import all python libraries
- We used "http://bboxfinder.com" to obtain the co-ordinates of Mole National Park and Ankasa Game Forest by passing it's xMin, yMin, xMax and yMax through bboxfinder's search_bbox function.
- We used the search_time_interval python function to determine the time interval.
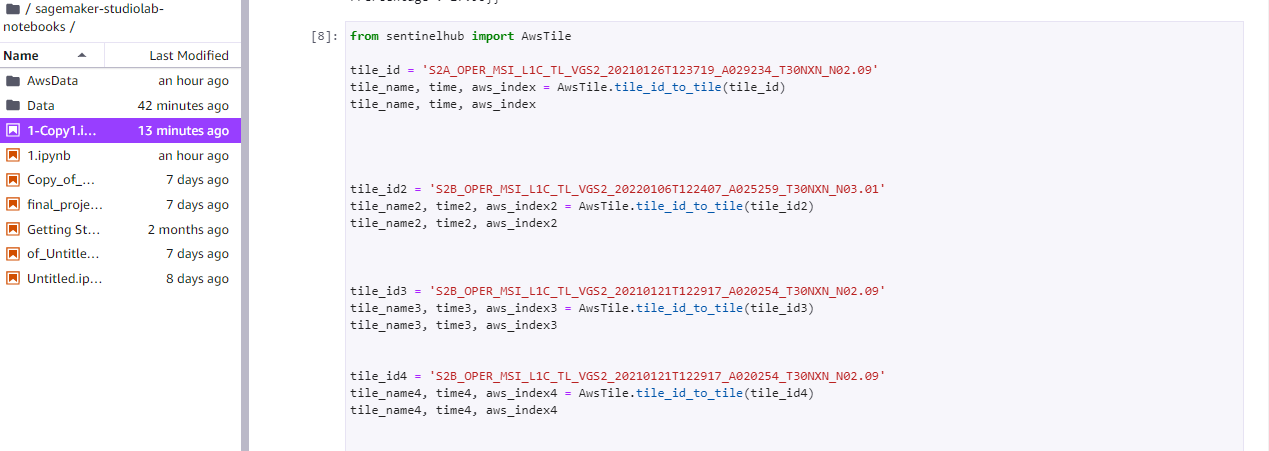
- To obtain the tile_info for the specified period of time, we used wfs_iterator to extract a unique tile info for each tile.
- Next, we converted each tile_id obtained into a tile_name which was accessed from the s3 bucket.
- For clearer results, we chose the tile_id with the least cloud cover.
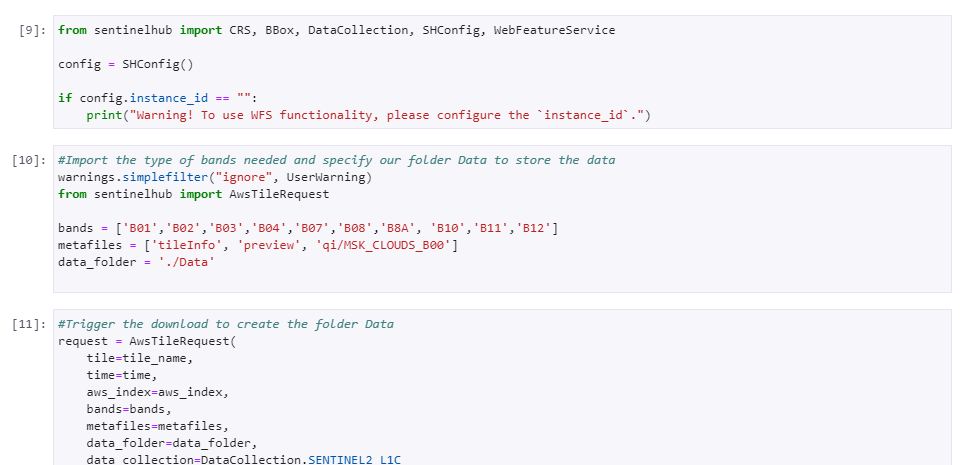
- Next, we selected bands 'B01','B02','B03','B04','B07','B08','B8A', 'B10','B11','B12'
- We specified our download folders for both Mole National Park(Mole_Data) and Ankasa Game Reserves(Ankasa_Data).
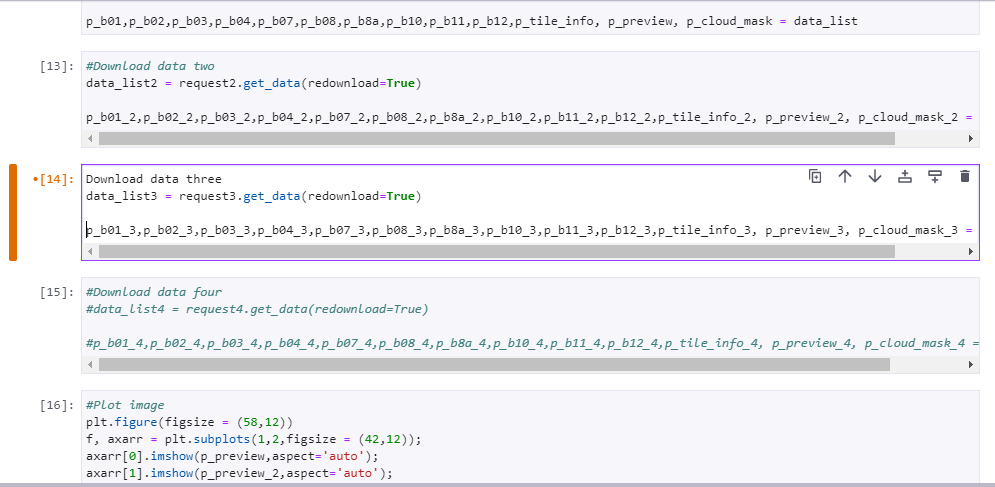
- We then requested for the data using the request.save_data function.
- Next, we triggered the download and specified the bands we want to download.
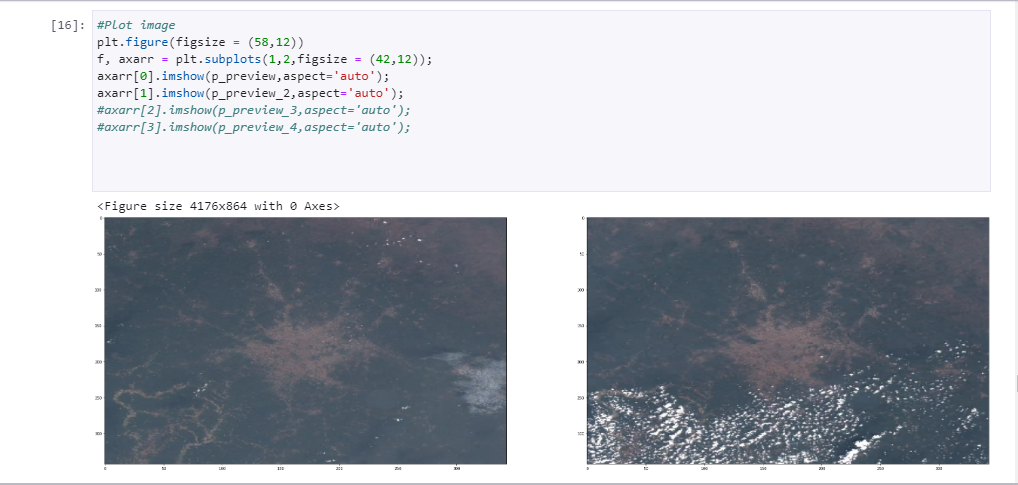
- After downloading the images to our folder, we plotted our image using matplotlib.
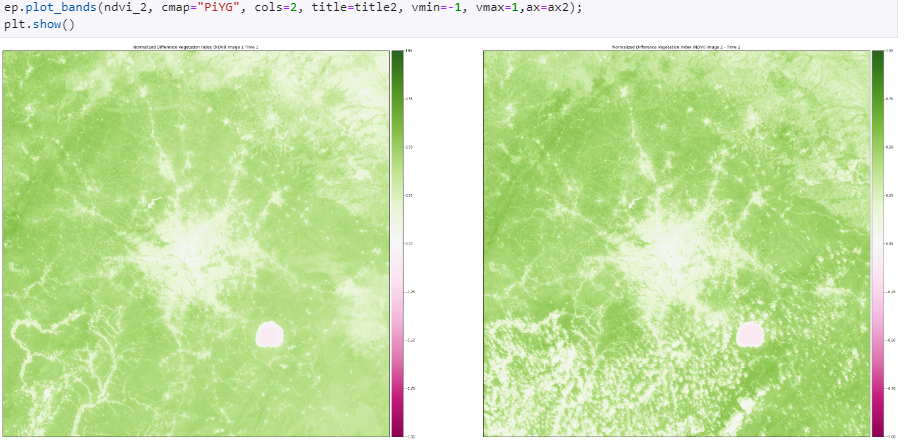
- To highlight on the area affected most we imported rasterio and used the GeoTIFF feature to check the vegetation of the selected area.
- Band 4 and Band 8 was used because we were checking for the vegetation view.
- Finally, we plotted our obtained image.
Challenges
In some cases; The obtained images were broken, tiles could not be retrieved from the AWS bucket and the cloud cover was so high that the real image could not be displayed.
Accomplishments
We were able to obtain images which showed that there has been a high rate of deforestation in Mole National Park.
What we learned
We Learnt how to use the Sentinel-2 dataset to monitor a land area over a period of time.
What's next for Using the Sentinel-2 image Satellite to curb Deforestation
Building an API to collect data from AWS bucket occasionally and then serving the images and data set to the Forestry Commission and all stake holders for the necessary steps to be taken to protect our forest reserves.
Built With
- python
- python-package-index
- rasterio
- sagemaker
- sentinel-2
- sentinel-monitoring


Log in or sign up for Devpost to join the conversation.