-
-

Floodie Banner
-

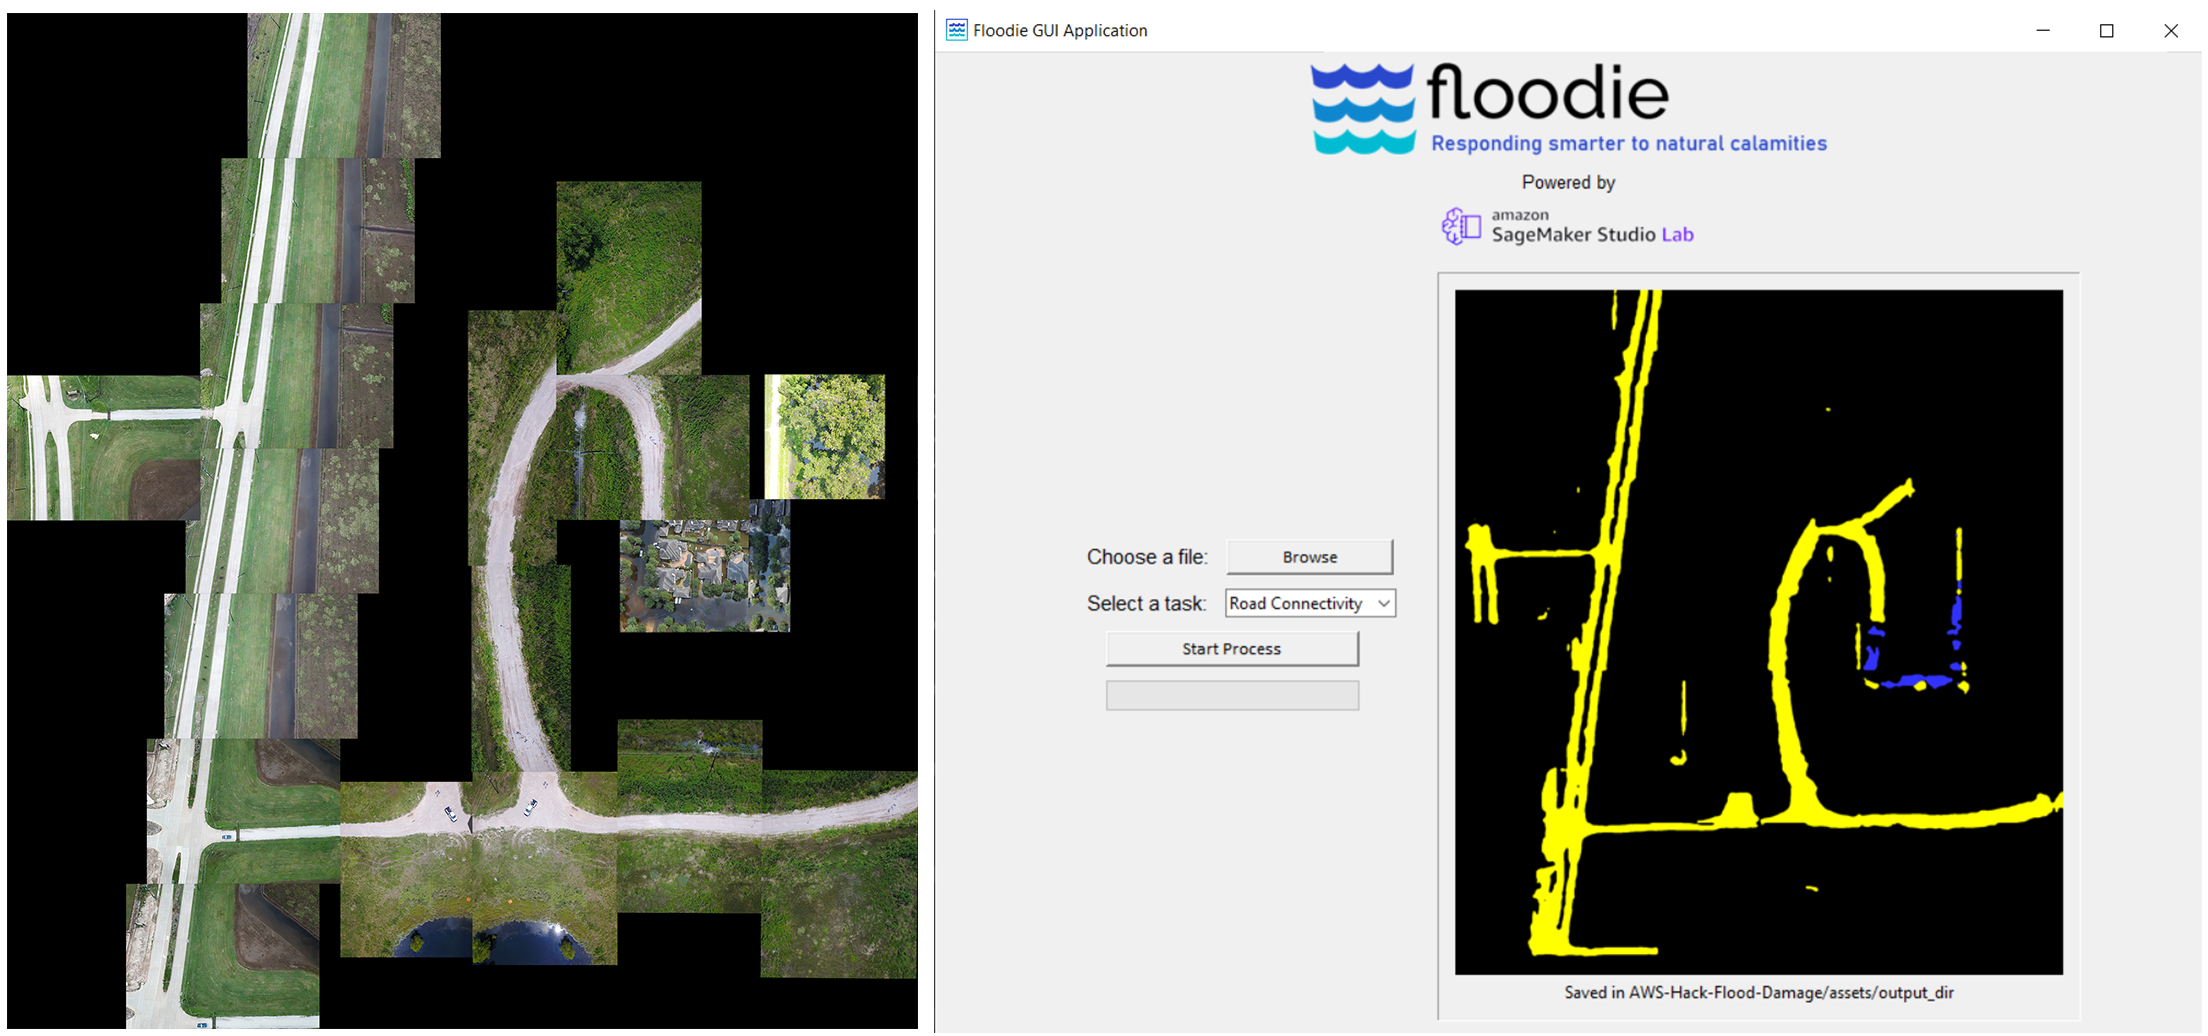
Floodie GUI Application
-

Damaged Regions (RED - damaged region and GREEN - undamaged region)
-

Road Connectivity (BLUE - flooded roads and YELLOW - non-flooded roads)


Inspiration
Emergency Response Teams (ERT) heavily rely on real-time information during calamities and disasters. Unmanned Aerial Vehicles (UAV) have recently gained popularity in their deployment for aerial surrveillance as it provides a real-time bird's eye perspective of the crisis to ERTs. However, aerial imagery can provide overwhelming amounts of information which can make it difficult for First Responders to judge/estimate the regions most affected by calamity in a large area. Moreover, during floods caused by hurricanes/cyclones, when a portion of roads are inundated with water, it can be hard for ERTs to logistically manage the transportation of people and supplies and to plan safe routes to certain locations in a disaster affected area, with or without aerial imagery. Additionally, for ERTs to work and coordinate efficiently during a time of crisis, shared situational awareness and information is critical. In other words, one of the biggest things that hinder the cross-agency coordination of ERTs is the lack of standardized means of communication, information sharing and limited information itself.
In order to address these pressing needs and to enhance the level of coordination of ERTs, we introduce Floodie which is an application that leverages aerial surveillance and helps response teams to work and communicate better thereby speeding up the recovery of a disaster affected area. The next section will focus on specific problems addressed by Floodie.
What is Floodie
Floodie is an application which uses Machine Learning techniques to leverage aerial imagery and produce useful information. This can be extremely beneficial to response teams to communicate better and function more efficiently. There are several ways in which disaster response teams can benefit from floodie. A few of the important ones are discussed in the following secton.
Understanding Floodie
This section will help you to understand Floodie better and what it's really about.
Which natural calamity is Floodie designed to help with?
Floodie is mainly focussed on calamities such as hurricanes and cyclones and the floods caused by them in coastal regions. However, future versions of Floodie can be expanded to help with other kinds of natural calamities.
How does Floodie logistically help ERTs plan routes and transport supplies in flooded areas?
Floodie works by extracting useful information from aerial images. It can identify flooded and non-flooded roads in an aerial images and generate color-coded segmented maps of city roads. These maps can help to convey how flooded and non-flooded roads are connected and interlinked. These maps can be stitched together to provide Road-Connectivity information over large areas inside a city. This can greatly help ERTs to plan routes for transportation and carry out rescue operations.
How does Floodie help ERTs identify affected zones in a large aerial image?
Floodie also has the functionality of identifying affected (damaged/flooded) zones. It works by dividing a large aerial image into smaller 128x128 sized images and perform binary classification on them. The end result is a two-color-coded map representing affected (damaged) and unaffected (not damaged) zones. This coupled with the Road-Connectivity map can not only provide extremely useful information to response teams, but also help them direct their efforts to the most affected zones in a coastal city or a town.
How does Floodie establish a standard of communication and information-sharing among ERTs?
Color-coded maps generated by Floodie can easily be shared by ERTs to other ERTs operating in a different location. These maps can be augmented by adding markers, GPS points, notes, etc. and can therefore act as a template or a standard means of sharing information quickly and efficiently.
How does Floodie aid the recovery process of disaster-affected area?
By providing ERTs the access to key information and enabling them to correctly direct their efforts, communicate better, gain situational awareness of a crisis and plan transportation routes, Floodie can undoutedly speed up the recovery process of a disaster-affected area.
How we built it
Floodie was built completely using Python 3 and Amazon SageMaker Studio Lab. Python 3 was used to write the backend code and develop a basic Graphical User Interface. Amazon SageMaker Studio Lab was used to train Machine Learning models with help of its GPU resources. The entire structure of Floodie can be divided into three parts namely,
- Frontend GUI Application
- Machine Learning Models
- Datasets used
Frontend GUI Application
The GUI application is built using the Tkinter module of python. It provides basic functionality to the user to upload images and perform tasks on them. We have added two basic tasks that the user can choose from. They are as follows,
Road-Connectivity
This performs semantic segmentation on an image. We are basically trying to segment pixels belonging to two classes namely a) Flooded Roads and b) Non-Flooded Roads. Furthermore, it generates a color-coded map containing Flooded and Non-Flooded roads.
Damaged-Regions
This divides the original image uploaded by the user and into smaller 128x128 images and performs binary classification (Damaged or Not-Damaged) on them. It then generates a two-color-coded map depicting RED color as damaged and GREEN as not damaged.
Init screen of the GUI application processing an image
Machine Learning models
We have used two machine learning models to perform the two tasks mentioned above. In order to to perform the Road-Connectivity task, we have used a convolution neural network whose architecture is similar to U-Net. It contains encoding and decoding layers which are similar to Xception net. A summary of the architecture can be found from the link mentioned below. In order to perform Damaged-Regions task, we have used a CNN called Xception Net. However the last layer of the CNN was substituted with a Fully Connected layer of two neurons with a softmax activation. A summary of its architecture can be found from the link mentioned below.
U-Net-Xception-style Model
| Architecture Summary | Task | No. of classes | Training Samples | Batch Size | Epochs | Optimizer | LR | Loss Function | Min. Validation Loss |
|---|---|---|---|---|---|---|---|---|---|
| Here | Semantic Segmentation | 10 | 348 | 8 | 15 | Adam | 0.01 | Categorical CrossEntropy | 0.948 |
Our algorithm works by dividing a large image into smaller 240px x 320px (H, W) sized images and feeds it one by one to the model. The test-image below was prepared by us using the samples from the dataset itself. It illustrates how a map of segmented roads (BLUE for Flooded and YELLOW for Non-Flooded) is being generated. We used samples from the dataset because the model could not predict properly on general aerial images of cities owing to the very small number of samples in the dataset.
Xception Net Model
In order to apply the power of a CNN like Xception net on a binary classification problem, we made use of technique called Transfer Learning. Transfer Learning helps us to use the stored knowledge gained while solving one problem and apply it on another problem. Here we use Xception Net's architecture and use the pretrained image_net weights. Then, we remove the last layer of Xception and replace it with a Fully Connected layer containing 2 neurons with a softmax activation. These two neurons are used for the binary classification problem. Then we only train the weights of Fully Connected layer as the pretrained image_net weights do not require training.
| Architecture Summary | Task | No. of classes | Training Samples | Batch Size | Epochs | Optimizer | LR | Loss Function | Validation Accuracy |
|---|---|---|---|---|---|---|---|---|---|
| Here | Binary Classification | 2 | 10000 | 16 | 15 | Adam | 0.02 | Categorical CrossEntropy | 0.901 |
Our algorithm works by dividing a large image into smaller 128px x 128px sized images and feeds it one by one to the model. The test-image below was once again prepared by us by stacking small images together. Each small image contains a damaged/undamaged building the which our model tries to classify. The test-image is for illustrating how our model works. RED depicts a damaged region and GREEN depicts an unndamaged region.
Datasets used
- FloodNet Dataset by Computer Vision and Remote Sensing Laboratory at UMBC.
The data is collected with a small UAS platform, DJI Mavic Pro quadcopters, after Hurricane Harvey. The whole dataset has 2343 images, divided into training (~60%), validation (~20%), and test (~20%) sets.
- Used for training U-Net-Xception-style Model
- Hurricane Damage Dataset by Quoc Dung Cao (University of Washington) and Youngjun Choe (University of Washington).
The data are satellite images from Texas after Hurricane Harvey divided into two groups (damage and no_damage) ... All images are in JPEG format, the class label is the name of the super folder containing the images
- Used for training Xception Net Model
Challenges we ran into
The main challenge in this project was to identify flooded and damaged regions (paths/roads and buildings) in the pile of data obtained through the aerial imagery and highlight/convert them to easily graspable information for Emergency Response Teams(ERT). At first, we couldn't develop a very accurate model with only a handful number of pictures available in the dataset. During the development of the Damaged-Regions identifying module, we ran into several problems with its accuracy in prediction. Some of them are,
- Since the dataset we used had only damaged/non-damaged buildings, we were not able to identify any other damaged structures apart from buildings like roads, vegetation or agricultural land.
- The images in the dataset also had a little bluish tint over them which made it difficult for the model to predict properly on aerial images outside of the dataset.
To reduce the inaccuracy of the models, - The model was trained for additional epochs to boost its accuracy by a smaller margin while ensuring the model doesn't overfit.
- Instead of passing the whole image into the model, we divided the picture into smaller pieces of size 128px x 128px and tested the image and finally we combined every result together to provide useful information out of it.
During the developement of the Road-Connectivity module, the only reliable dataset we could was the FloodNet Dataset. Eventhough the dataset was perfect for us, we faced the following challenges.
- The dataset contained only 398 (348 training + 50 validation) samples of images and masks for the semantic segmentation task. Due to this, it was difficult for the model to attain decent accuracy without overfitting.
- The image-mask samples in the dataset contained buildings and roads from 1 neighbourhood (with very similar architecture and roof colours). This would make it difficult for the model to perform properly on images containing different layouts and styles of houses and buildings.
- In order to tackle these challenges, a generalized dataset with a large number of samples and distinct buildings and structures is needed.
Accomplishments that we're proud of
After all the challenges and troubles that we faced during this project, we were really happy and proud to be able to successfully create a working prototype that fulfilled our primary problem statement. Also, we made many mistakes and learned from them and corrected them. We didn't quit in between the project which in itself shows our perseverence. And completing this challenging yet fun project has encouraged and motivated us to take up more challenging projects like this one.
What we learned
- First thing is that we were able to learn about AWS-SageMaker Studio Lab's free resources and ease of use to create Machine Learning projects. It made our jobs much easier than if we were to do it on our local machines.
- We were able to get insights into how the rescue mission teams work during a natural disaster and what are the difficulties they face in saving lives.
- We were also able to learn the severity of natural disasters such as hurricanes and floods and how it could change the lives of the affected people.
- Finally, completing this project has really helped us to learn more about the Machine Learning concepts. We learned by making mistakes and understanding where we went wrong and then finding a way to correct solve the issue. We believe it will surely help us in the future.
What's next for Floodie
Floodie was able to identify the road connectivity and building damages due to floods and cyclones but still, there is more to it than simply identifying those things. So far as our current prototype is concerned, Floodie helps Response Teams to communicate better and gain better situational awareness. But we've built Floodie in very versatile manner so that it can be expanded to do a lot more than what it already does. Some of the things are in store for Floodie are,
- Additional features such as Marker points, notes etc. can be added to Floodie's UI.
- GPS coordinates could be added to maps so that automated image stitching could done to produce large maps of cities and towns.
- Floodie can be connected to the internet so that ERTs can communicate in real-time over Floodie's maps.
- Maps generated by Floodie can be extremely useful for Robots and Unmanned Rescue Vehicles. Through these maps, it will be easier for Autonomous Vehicles to read connectivity of roads by colour codes which will in turn help them to navigate better in those uncertain circumstances. In other words, Floodie can help Robotics and automation to assist with rescue operations carried out be ERTs.
Built With
- amazonsagemakerstudiolab
- jupyternotebooks
- python
- tensorflow
- tkinter


Log in or sign up for Devpost to join the conversation.