-
-
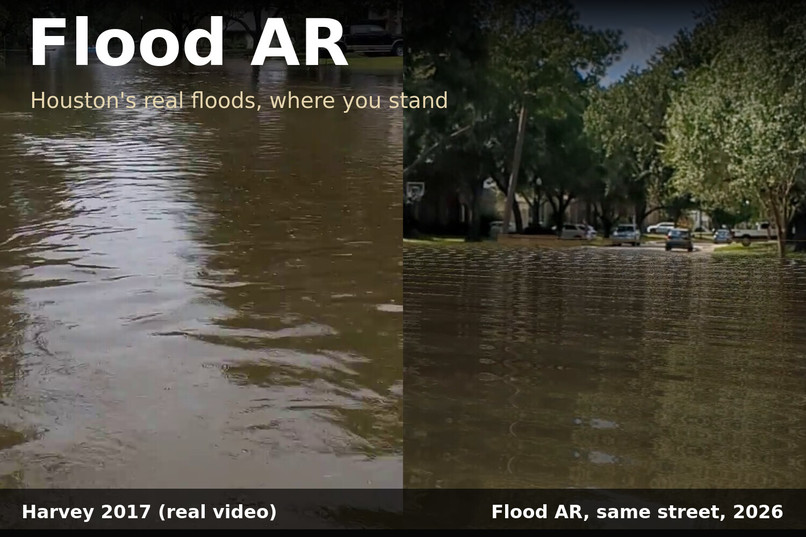
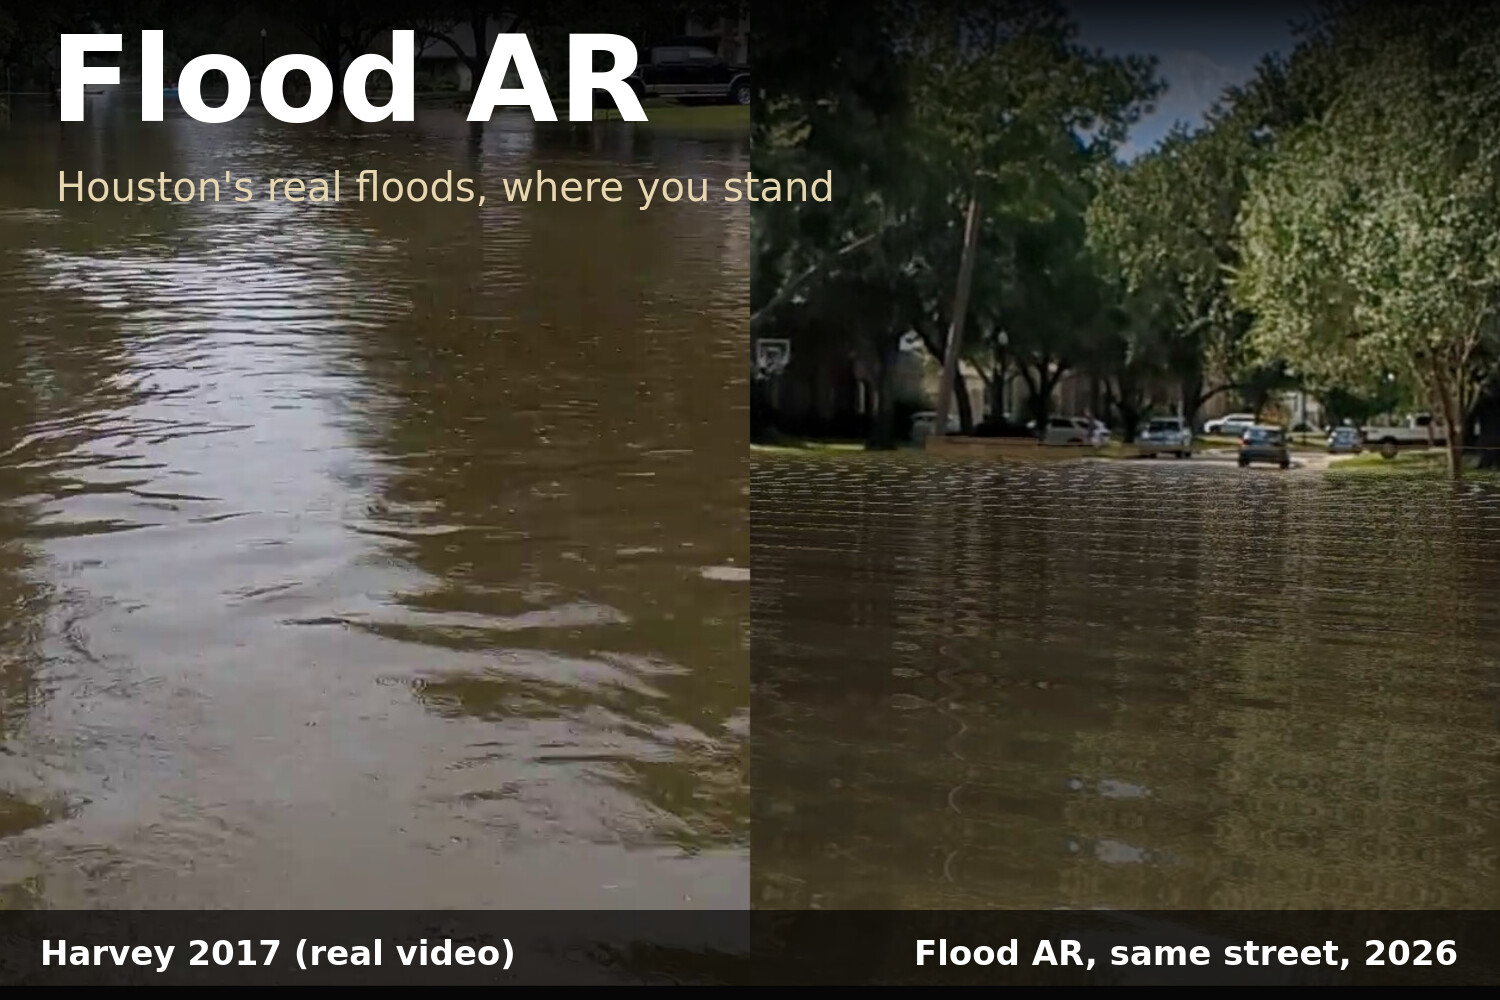
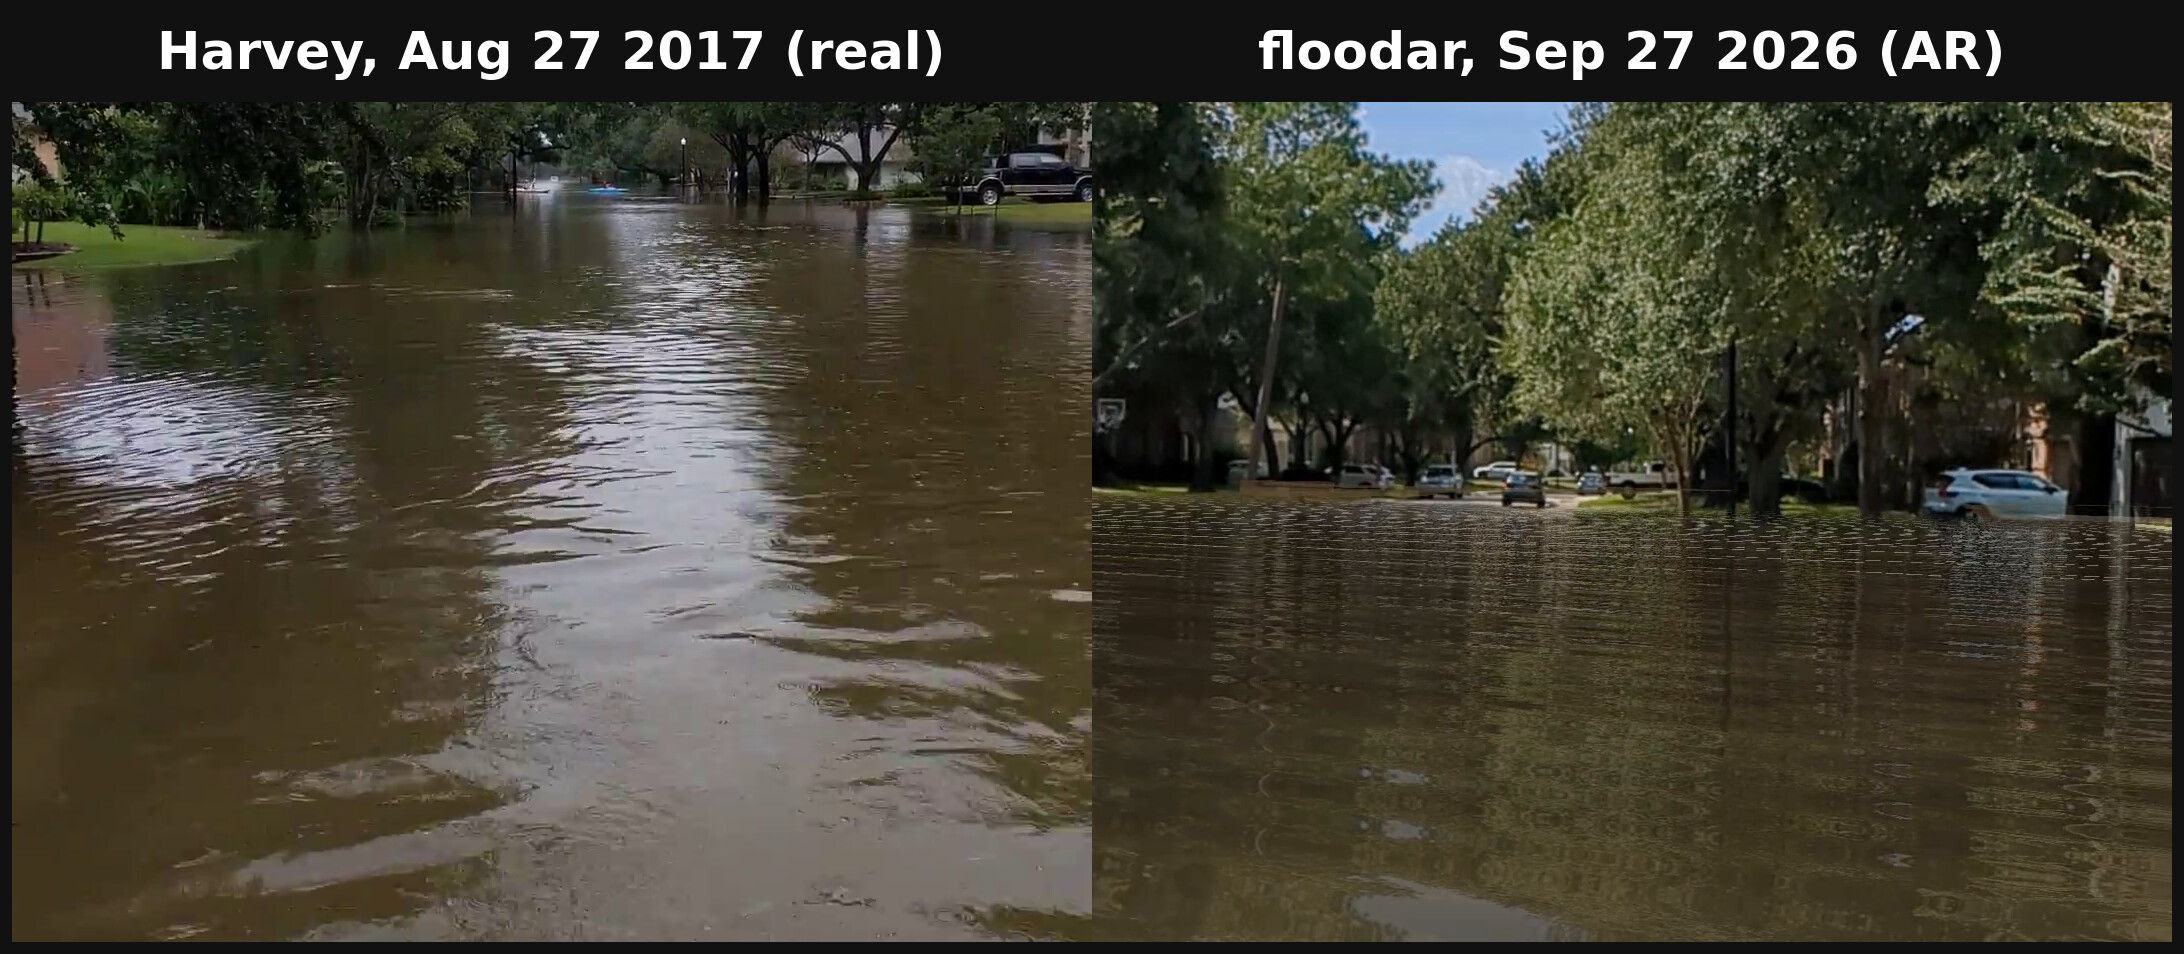
Flood AR: Hurricane Harvey in a Houston street, 2017 (left, the author's own video) and the same street in Flood AR, 2026 (right).
-
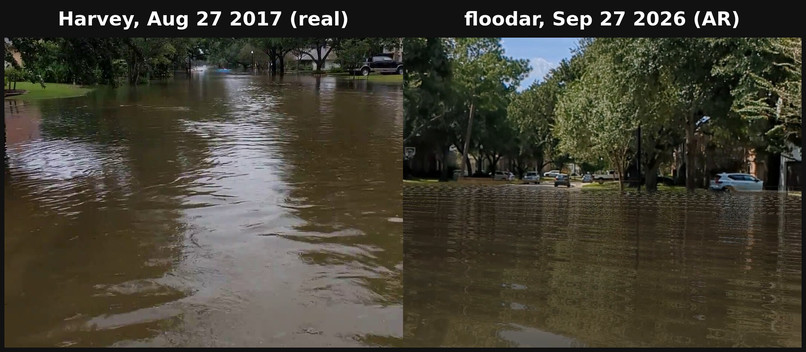
Same street: Harvey 2017 (left) and Flood AR 2026 (right).
-
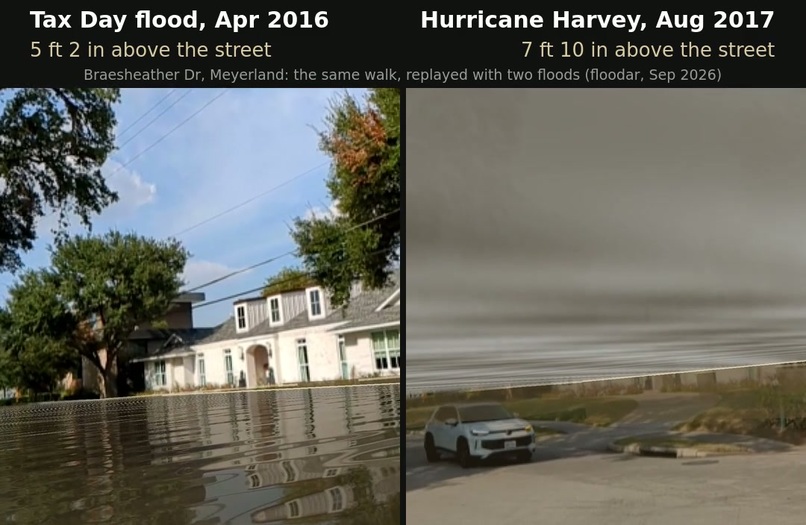
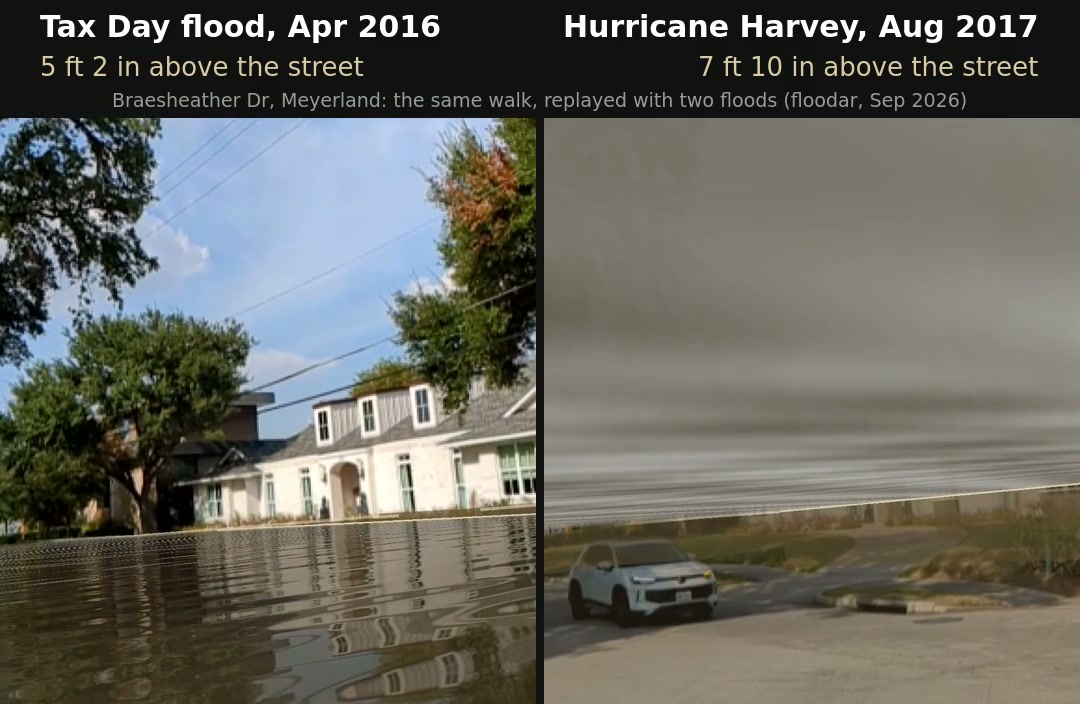
Meyerland, same walk: Tax Day 2016 (left) vs. Harvey 2017 (right).
-
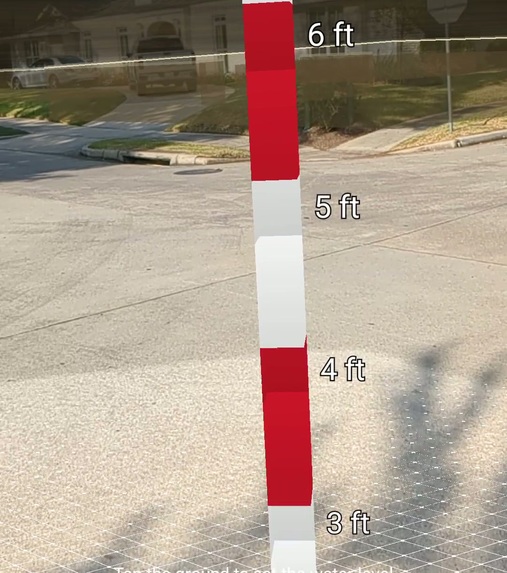
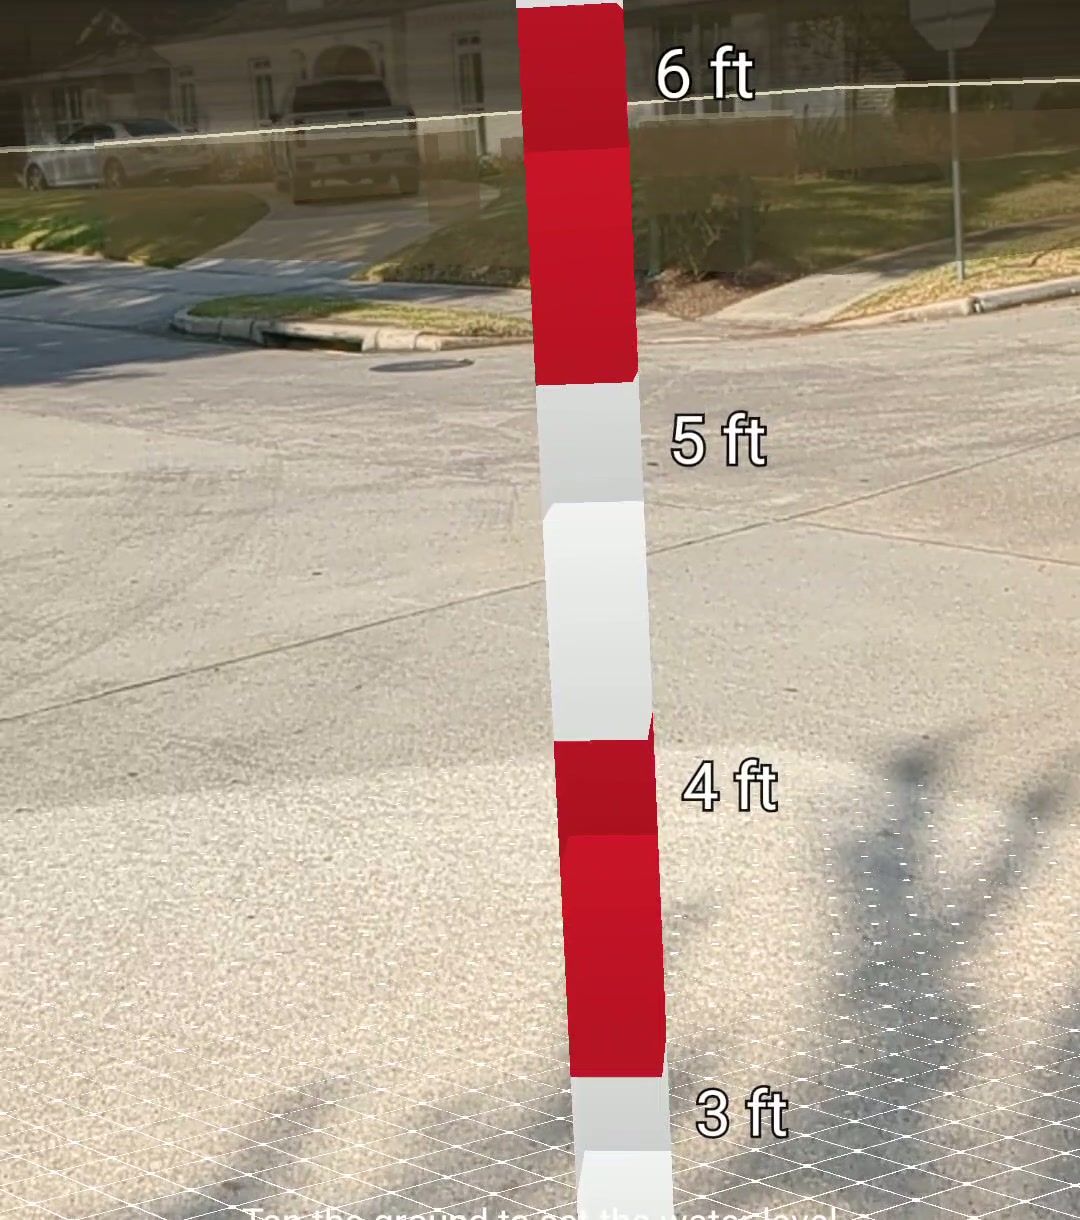
Harvey's 7 ft 10 in on Braesheather Dr. Each stripe is 1 ft, and the pale line on the houses behind marks where the water stood.
-
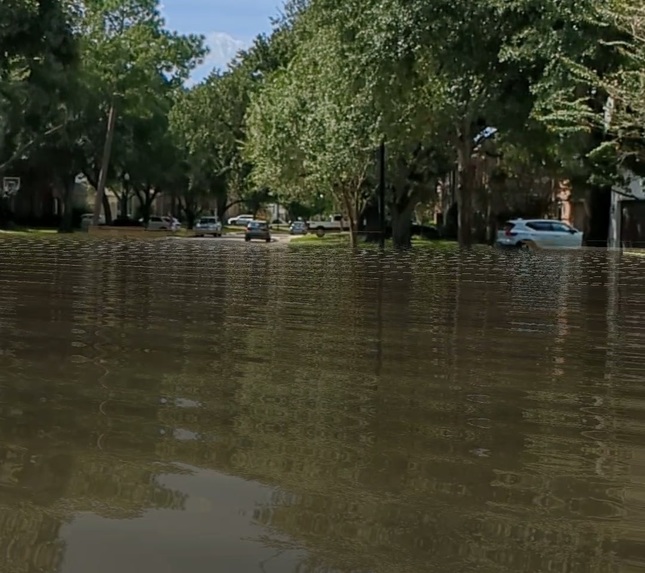
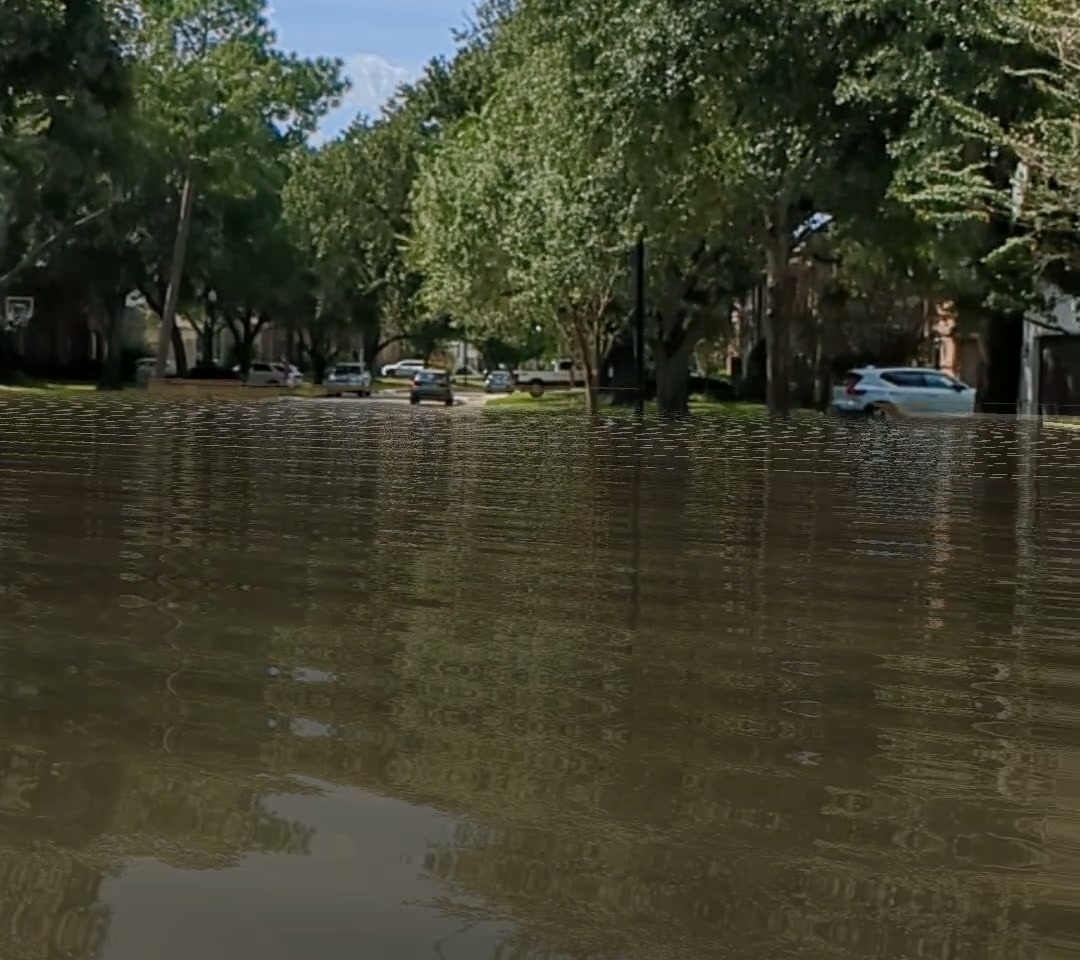
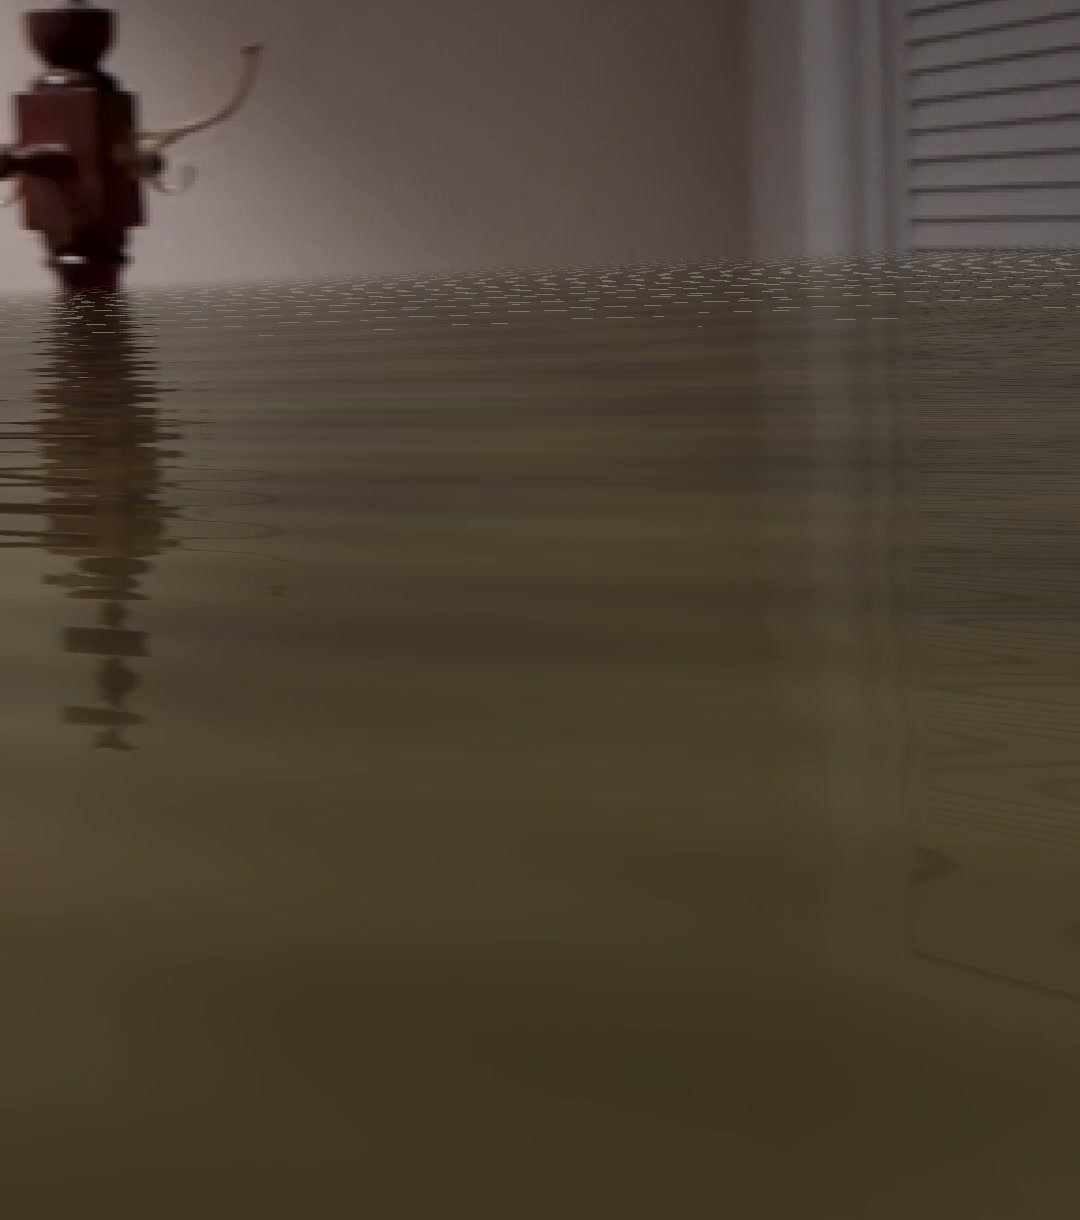
Muddy floodwater that reflects the live camera view, with ripples, on an ordinary Android phone.
-
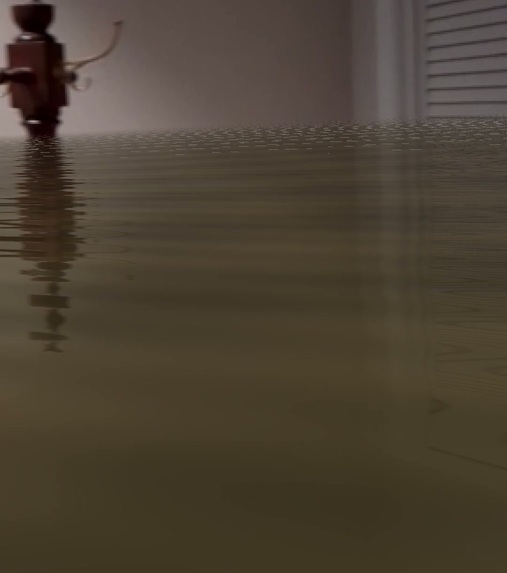
In your own home: a living room with water about 5 ft deep, reflecting the pictures on the wall (visualization).
-
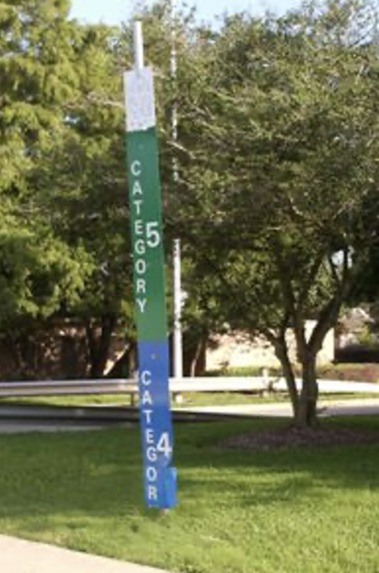
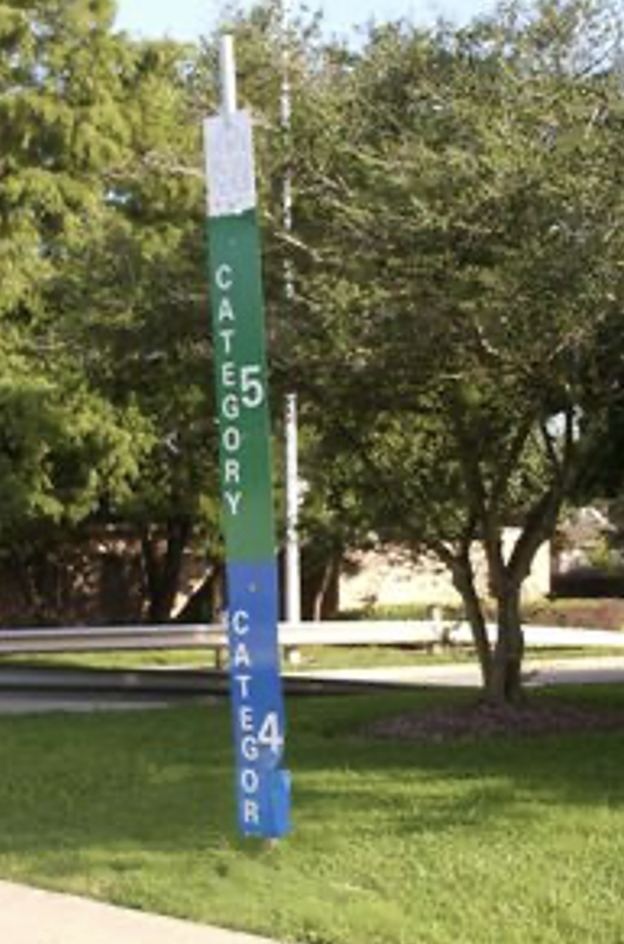
The 2010 Clear Lake storm-surge marker, removed in 2011. Photo: Jim Blackburn.
Inspiration
On August 27, 2017, during Hurricane Harvey, I waded into the middle of my street near Brays Bayou and filmed a slow pan of the flood. The water was just above my knees and pushing past my legs; kayaks were going by down the block. The peak had come within about an inch and a half of my slab. Two blocks east, where the ground sits a couple of feet lower, neighbors had water inside their homes. I filmed it because I thought I would never see that scene again in my lifetime. I hope I was right.
In late 2018 I heard a short talk by Jim Blackburn of Rice University about storm-surge markers that FEMA and the State of Texas had put up in Clear Lake after Hurricane Ike, tall poles showing how high the water could reach. They were taken down within months. The message I took away was that the truth about flood risk had been too uncomfortable to leave standing by the road.
My reaction was simple: if the physical markers could be removed, it should be possible to put them back up, virtually, for anyone who wants to see. That idea has been on my list since 2018. Phone AR (augmented reality: graphics drawn into your phone's live camera view) has finally caught up with it.
Researching the markers for this hackathon taught me something I hadn't known. Their "Category 4" and "Category 5" labels were themselves misleading. In NOAA's own comparison, Hurricane Ike, the storm that prompted the markers, was only a Category 2 but drove a 20 ft surge, while the small Category 4 Hurricane Charley produced about 7 ft. Wind category doesn't predict the water. So Flood AR doesn't just put the marker back. It shows the water levels that were actually measured, where people live.
That matters because flood depth is a number nobody can picture. Harris County has excellent flood data, with thousands of surveyed high-water marks, but it arrives as maps and figures like "53.9 ft NAVD88". Few people can turn that into "the water will be over my front door." Houston's weather is changing, and its storms are getting wetter and more intense: three floods described as 500-year events from 2015 through 2017, and Harvey alone flooded well over 100,000 homes in Harris County. When the water goes down and the drywall is replaced, it is easy to forget what it looked like. Flood AR is meant to help us remember, and to let people who never saw it understand.
What it does
Flood AR is an Android app that shows a real, documented flood at full scale wherever you point your phone:
- On site: stand on Braesheather Dr in Meyerland and see Harvey's 7 ft 10 in of water over your head, with a debris line on the houses above their front doors.
- In your own street: bring any documented depth to where you are. In my street, the app filled the road with muddy water at knee height, matching my own video from 2017.
- In your home: tap the living-room floor and the room fills with water that reflects the walls and furniture. It was unsettling in testing, because thousands of Houstonians saw exactly this.
- Any depth: "Custom depth" takes a number like 8 inches, the water a friend's house took, and shows it in the room.
- Flooded again: switch floods at the same spot. On Braesheather, Tax Day 2016 puts the water at your chest; Harvey 2017 puts you under it.
- History: a reconstruction of the 2010 Clear Lake marker, standing next to the depth the data actually supports there (only 2–4 ft).
On screen: muddy water that reflects the live camera image, with flow ripples; a debris line and mud stain on real buildings; and a 6 ft-plus depth gauge with foot labels for human scale.
How we built it
- Data pipeline (PostGIS): surveyed high-water marks from the Harris County Flood Control District for Memorial Day 2015, Tax Day 2016, Harvey 2017 and Imelda 2019, plus HCFCD's 100- and 500-year flood levels and USGS 3DEP elevation data. Depth = water-surface elevation − ground elevation, and every scenario records which surveyed marks it came from.
- App: Android (Java) with Google ARCore. Plane detection finds the ground under you; the Geospatial API and Google's 3D building geometry place the debris line on real houses; OpenGL ES shaders draw the water.
- Depth, not altitude: phone GPS altitude can be off by 25 m, so Flood AR never trusts it. You tap a local surface (street, porch, floor), and the water is placed relative to that.
- Water you believe: the shader mirrors each view ray off the rippled water surface and samples the live camera image, so the real trees, houses and walls appear reflected in the flood. It runs on an ordinary Pixel 6a, with no LiDAR.
- Field testing: my street, three Meyerland intersections, and a friend's living room. Sessions were recorded with ARCore's recording API and replayed at the desk to re-render with different floods, so the Tax Day and Harvey footage come from the same walk.
- Research: a verified history of the Clear Lake FEMA markers, and a survey of prior AR flood projects (Disaster Scope in Japan was the closest precedent), each with a checked reference list.
- With help from: a friend who filmed the Meyerland test over my shoulder; a friend whose home took 8 inches and let me test indoors; friends from Braesheather Dr, whose house took about 7 ft in Harvey; and Jim Blackburn, whose 2018 talk started it. Built with Claude Code (Anthropic) as an AI pair programmer.
Challenges we ran into
- Outdoor plane detection only reaches about 20 m, so Flood AR uses it only for the ground height under your feet. Water on distant buildings comes from Google's 3D building geometry.
- Heights and datums: GPS altitude, ellipsoid vs. NAVD88, and a terrain mesh that sat 3 ft off outdoors (and 11 ft off indoors) until localization finished. We solved it by always measuring from a surface you tap or stand on.
- Indoors, walls don't yet stop the water, so a shallow flood looks deeper against the walls. The fix is ARCore's Depth API.
- The 2010 marker's "25 ft" was never tied to a vertical reference, so its intended meaning can't be recovered.
- Real-world limits: an overheating phone in the Houston sun, a USB port that couldn't keep up with the power drain, and a phone screen that filmed as a black rectangle in full sun.
Accomplishments that we're proud of
- A side-by-side of the same Houston street: Harvey in 2017, Flood AR in 2026. My debris-line photo, measured against the siding, put the peak 4.0 in above my porch; my video showed about 24 in mid-street.
- An honest check of the model. Near my house, water levels estimated from bayou high-water marks 800 m away understated street depth by more than 2 ft. But local elevation differences correctly explained why houses two blocks east had about 2 ft of water inside.
- Meyerland's story in one clip: the same walk replayed with Tax Day 2016 (water at your chest) and Harvey 2017 (water over your head).
- Reflective, rippling muddy water on a mid-range Android phone, with no special hardware.
What we learned
Accuracy and presence both matter. A correct number that nobody can picture changes nothing, and a convincing flood at the wrong height teaches the wrong lesson. As our background research put it: "Hydrology determines where the water is; the shader determines whether you believe it."
We also learned that one trusted local observation beats distant data. Anchor the flood to something real nearby, such as a debris line or a surveyed mark, then use elevation data to spread it across the neighborhood.
What's next for Flood AR
- Better depth: USGS Harvey depth rasters and 1 m lidar for street-accurate depths; Depth API occlusion so walls, cars and furniture hide the water correctly; floating debris; an iOS version.
- Partners: Harris County Flood Control District or the City of Houston for flood-risk outreach; libraries, schools and museums as a hands-on exhibit; and a research partner (Rice, UH or the Baker Institute) for a small study comparing a flood map, a plain AR waterline and the full AR flood in people's own surroundings.
- Who could fund it: cities and counties running flood-risk outreach, for example through FEMA's Community Rating System, which rewards communities with flood-insurance discounts; and residents deciding where to live, whether to insure, and whether to elevate.
- Running costs are close to zero: the data is public (HCFCD, USGS, FEMA), the app runs on the phone, and Google's ARCore service has a free usage quota.
- Beyond Houston: USGS surveys high-water marks after major floods nationwide, so any community with those marks and elevation data can use the same pipeline.
- Your evidence: photos and videos of debris lines and flooded streets, like the ones that validated Flood AR, to build ground truth across more neighborhoods.
Try it: APK download (most Android phones from the last few years) · Demo video · Source code and write-up

Log in or sign up for Devpost to join the conversation.