-

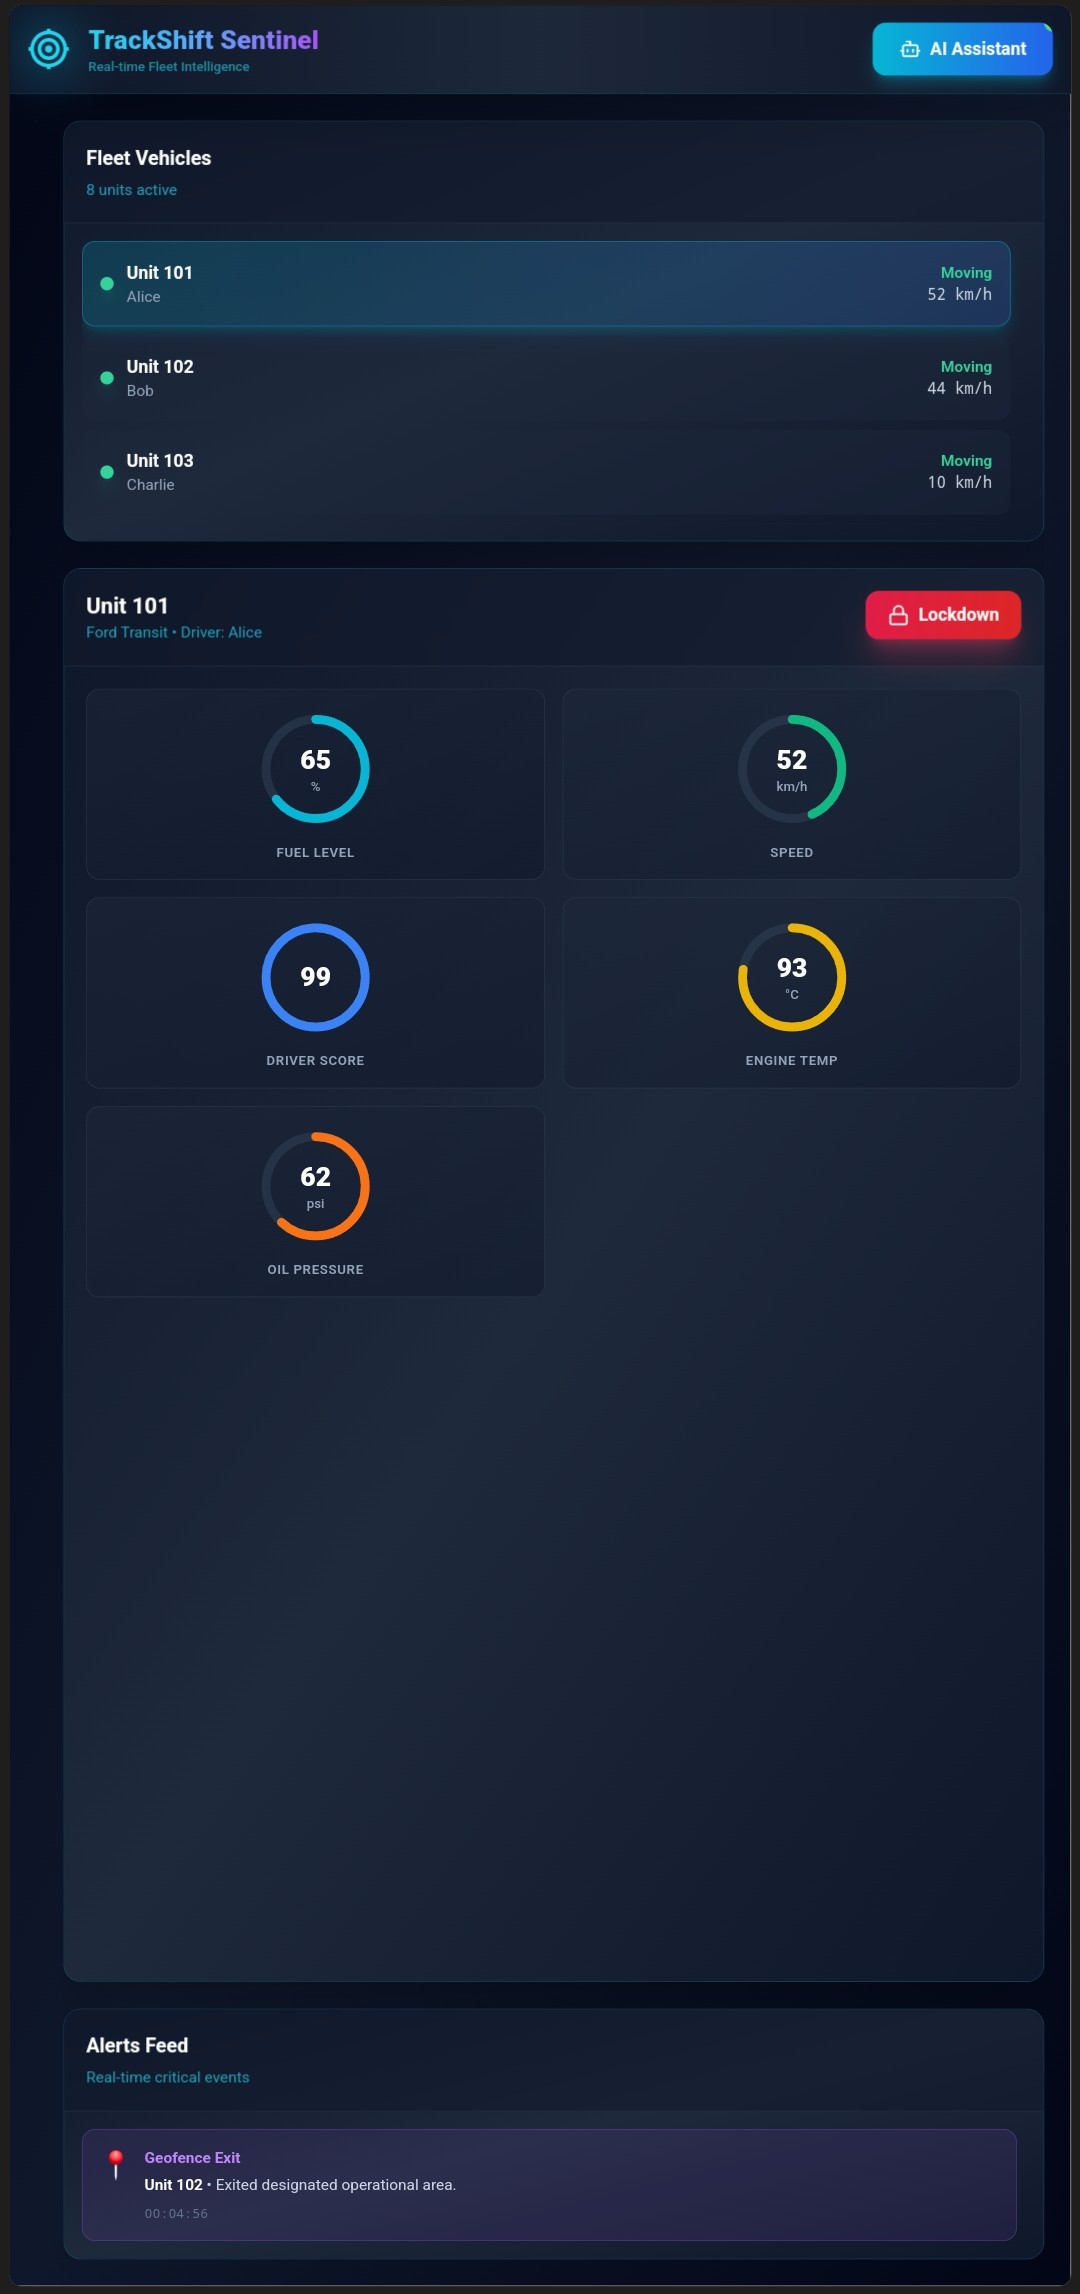
Fleet monitoring dashboard
Inspiration
In large fleets and delivery companies, vehicles are many, drivers are mobile and remote, and it’s challenging to monitor location, engine health, fuel/fuel-consumption, driver behaviour (harsh braking/acceleration), route deviation, unauthorized stops, illegal activities, and even remotely intervene in emergencies (e.g., immobilise the vehicle). I was inspired by the convergence of IoT (vehicle telematics), real-time dashboards, and a need for greater accountability in logistics & mobility operations. Also, given the mobility theme of TrackShift (“Where Ideas Pit Stop and Innovations Refuel”) I felt that a system which gives a live dashboard for fleet management aligns strongly.
What it does
The solution is a live fleet-monitoring dashboard + vehicle-control system that does the following:
Shows real-time location of each vehicle (via GPS) in the fleet on a map, with status (moving / stopped / idle / off)
Monitors engine health parameters (via OBD-II or telematics) such as engine temperature, fault codes, oil pressure, maintenance alerts
Tracks fuel level/fuel consumption and projects remaining range
Captures driver behaviour metrics: harsh braking, sharp acceleration, speeding, idling, route deviation
Generates alerts: if vehicle deviates from a predefined route, enters a restricted zone, stops too long, driver uses phone while driving (if camera + AI)
Provides live video feed / dashcam or webcam access from vehicle for remote inspections and safety monitoring
Enables a remote switch/lockdown mechanism: in case of theft, unauthorised use, or emergency, the control centre can remotely immobilise the vehicle (or restrict speed)
The dashboard also supports analytics: heatmaps of high-risk behaviour, maintenance forecasting, driver ranking, fuel/waste optimisation
Multi-tenant support: fleet owner, sub-fleet owner, drivers view etc
How we built it
Here’s a high-level technical stack & architecture:
Hardware/Telematics: We assume each vehicle has a telematics device connected to OBD-II port or CAN bus, plus a GPS module, fuel-level sensor or fuel-consumption estimation, and optionally a camera (dashcam) streaming feed.
The device pushes data (location, engine health, fuel, driver-behaviour sensors) to a cloud backend via MQTT/HTTP.
Backend / Data ingestion: We use a real-time message broker (e.g., Kafka or AWS Kinesis) to ingest streams. A microservices architecture handles:
location update service
engine/fuel health service
behaviour analytics service
alert/rules engine (e.g., route deviation triggers)
Dashboard / Front-end: Built with React (or Vue) for web, and React Native (or Flutter) for mobile. Map visualisation (e.g., with Mapbox/Google Maps) shows vehicle positions and status. Graphs show engine/fuel stats, driver risk scores.
Analytics / AI: A behaviour analytics module uses rule-based + ML to detect risky driving patterns (e.g., acceleration > threshold, braking events, phone usage via dashcam + computer-vision). Engine health faults get triaged using an ML classifier (based on historic fault data).
Remote control: A secure API connects from backend to a vehicle control module via the telematics device. The control module receives the command (e.g., “lock speed > 20 kph” or “disable ignition”) and executes it under safe conditions (e.g., only when vehicle is stationary).
Predefined route support: The manager uploads the planned route (via GPX/KML). The system compares vehicle GPS-trace in real time and triggers alert if the vehicle deviates by > X metres or strays off the corridor for > Y minutes.
Security & permissions: Role-based access (fleet manager, sub-manager, driver view). End-to-end encryption of telemetry. Remote lock module has safety checks (to avoid misuse).
Demo / Prototype: For the hackathon, we built a simulated fleet of vehicles (using mobile phone GPS + synthetic engine/fuel data) and a dashboard showing three vehicles moving on map, generating random engine‐health events, route deviations, fuel alerts. We demonstrated remote lockdown by “disabling” one simulated vehicle and showing dashboard update.
Tech stack summary:
Device simulator: Python (or Arduino for real hardware).
Cloud backend: Node.js (Express) + WebSocket for live updates.
Database: PostgreSQL + Redis for caching + time-series DB (InfluxDB) for engine/fuel data.
Front-end: React + Mapbox GL JS.
AI: Python (scikit-learn / TensorFlow) for driver behaviour risk scoring.
Deployment: Docker + Kubernetes (or Elastic Beanstalk) for rapid iteration
Challenges we ran into
Simulating real vehicle telematics data (engine faults, CAN-bus values, fuel sensor) realistically within short hackathon timeframe.
Ensuring the remote “lockdown” feature is safe (we had to design safeguards to avoid immobilising vehicle in unsafe conditions).
Handling location updates at high frequency (many vehicles) and ensuring latency remains low in the dashboard.
Visualising multiple vehicles at scale without clutter (when number of vehicles grows).
Defining the route-deviation logic robustly (what qualifies as deviation vs. allowed detour).
Integrating dash-cam video streaming in a hackathon prototype (bandwidth issues, latency).
Ensuring role-based access and secure remote commands (authentication/authorization).
Accomplishments that we're proud of
We built a working prototype in 24 hours (or within the hack phase) that integrates real-time simulated fleet, dashboard map, engine/fuel graph, driver risk score, alert panel, route deviation detection, and remote lockdown command.
The driver-behaviour analytics output a risk-score and produce a heat-map of high-risk events per vehicle.
We designed a modular architecture that could scale from one vehicle to hundreds, making it viable beyond hackathon.
The dashboard UI is intuitive, mobile-friendly, and emphasises actionable alerts (not just data).
We prepared a short demo video that clearly shows a vehicle deviation event, alert triggering, and remote lockdown command being executed.
We connected our IoT simulator to real cloud infrastructure (not just mock) so the latency and end-to-end flow are visible.
What we learned
Real-time systems in mobility (fleet) need careful architecture: handling streaming data, event detection, alert latency are all critical.
Designing for safety (especially remote vehicle control) requires anticipating edge-cases (vehicle moving fast, driver in panic scenario, poor connectivity).
Visual dashboards must balance information richness vs overload: it’s easy to show too much data; better to highlight key status/alerts and allow drill‐down.
Defining business rules (what constitutes “illegal activity” or “deviation”) matters—needs domain knowledge.
Simulating hardware (OBD-II, CAN bus, fuel sensors) is non-trivial; abstraction helps but real hardware brings surprises.
Hackathons demand rapid scope-control: focusing on one or two key flows (say, location + driver behaviour + remote lockdown) is more effective than trying to build everything.
The value proposition must be clear: For a fleet manager, not just “lots of data” but “what do I act on?” matters—alerts, predictive maintenance, cost saving (fuel + driver behaviour) are key.
What's next for FleetShift
Scenario-based workflows: Show specific business value stories: e.g., “Delivery truck deviates → alert → manager intervenes → saves cost/waste” or “Driver speeding detected → risk score increased → remote coaching triggered, fuel cost saved”.
Predictive maintenance: Extend engine/fuel health analytics to predict faults or failures, not just monitor current state. This adds innovation.
Gamified driver behaviour: Add leaderboard/insights for drivers (friendly competition: best driver of week) to encourage behaviour change — this aligns with mobility innovation.
Edge-AI on device: Demonstrate that driver behaviour (phone use, drowsiness) can be detected directly on the device (to reduce latency) — adds technical depth.
Environmental/social lens: Connect driver behaviour/fuel inefficiency to carbon emissions, sustainability — this may align with judging criteria (innovation + impact).
Simulation mode: As the 3rd problem is about “mobility event simulator modelling many moving agents, events, and output a live leaderboard” (the statement of problem 3) — you can extend your idea: simulate many vehicles, their interactions, route deviations, illegal behaviours, and show a leaderboard of fleets or drivers with risk scores or cost efficiency. That aligns more directly with “simulator + leaderboard” theme.
Scalability & cost modelling: Show how system scales, cost savings for businesses, return on investment (ROI) for fleet operators.
User experience: Provide a mobile dashboard for drivers (alerts, suggested safe behaviour) and web dashboard for managers – emphasise UX.
Data visualisation: Use heat-maps, clustering, trend lines, predictive trend of risk/fuel/health.
Integration with external data: Use external traffic/route data (e.g., congestion, weather) to adjust risk scoring or route deviation detection.

Log in or sign up for Devpost to join the conversation.