-
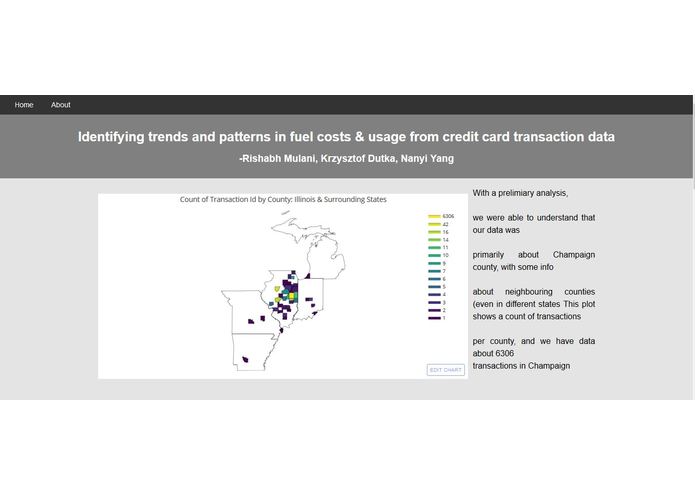
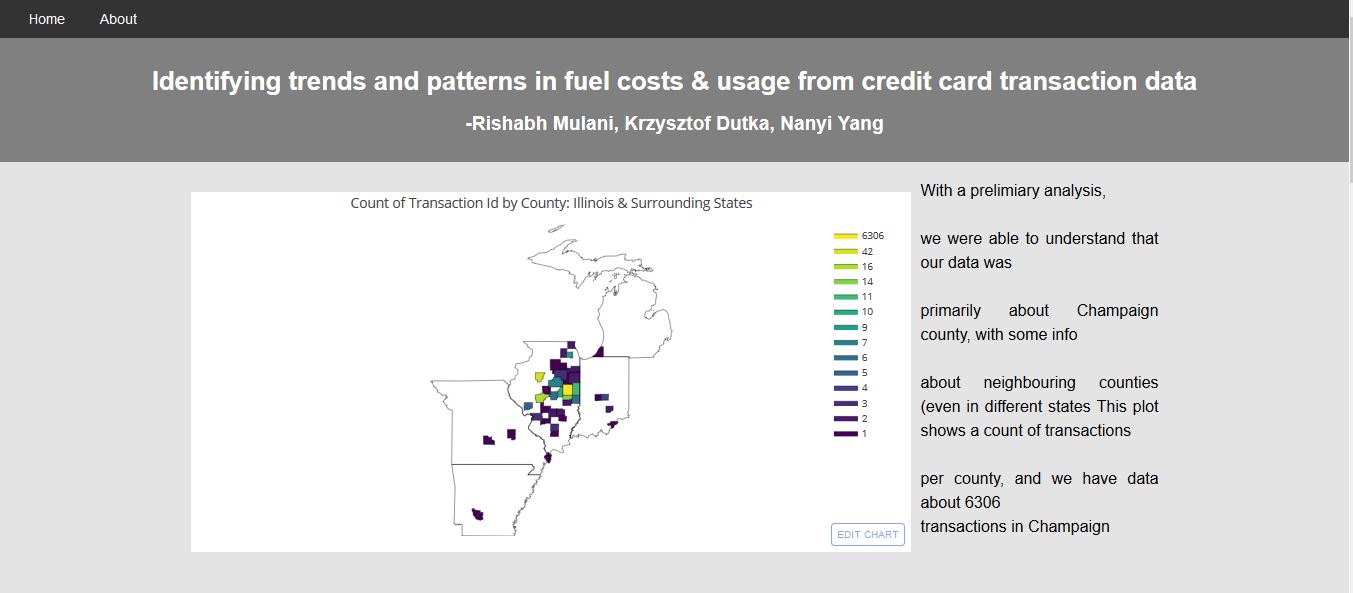
An interactive viz showing average unit costs by county
-
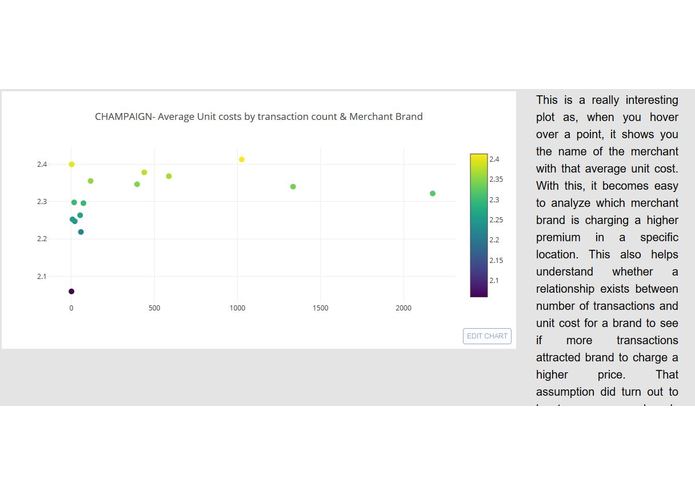
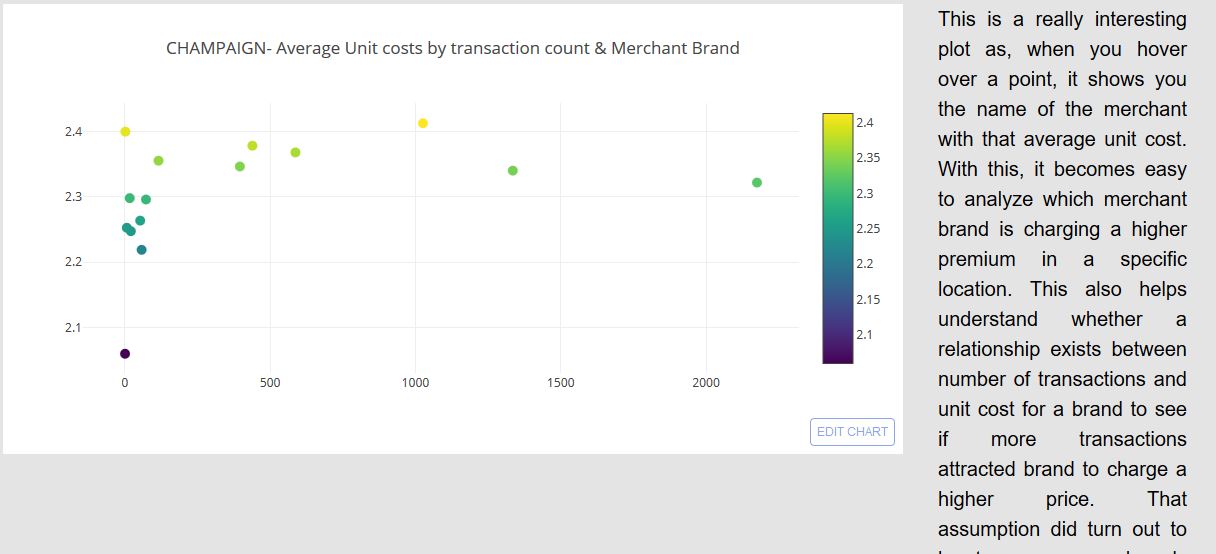
Another interactive plot which allows you to see which merchant charges what average unit price
Inspiration
The dataset description was interesting as it contained credit card transaction information. We thought of trying to link that to unit costs, brands and counties which made a good case for us to choose this project
What it does
Its just a website that shows our analyzed results
How we built it
Using Jupyter Notebooks (we love Jupyter Notebooks), Plotly - an awesome library for beautiful interactive visualizations, loads and loads of python code, a little bit of HTML, CSS and Javascript
Challenges we ran into
Getting our plots on HTML was a big big challenge, but thanks to Steve from the Pixo team, we were able to figure that out. (BIG shoutout to Steve!!). We have one challenge we've not been able to overcome yet: how to get our ipywidgets from the jupyter notebook render on an HTML page and help us showcase our visualizations the way they were supposed to look.
Accomplishments that we're proud of
We have some really great visualizations which also have tooltips to show what you're pointing at
What we learned
How to embed the really pretty plotly plots into HTML web pages thanks to Steve from the Pixo team!
What's next for Fleet fuel management
We weren't really able to showcase our interactivity on the HTML pages. If you have a look at our Jupyter Notebook, we've given the ability to a use to select whatever data she/he would like to plot. This basically paves a way for unrestricted exploratory analysis in the future so that users can change parameters and see how a certain feature changes with respect to another.
Check out our GitHub repo!
Built With
- html
- ipywidgets
- javascript
- matplotlib
- plotly
- python


Log in or sign up for Devpost to join the conversation.