-
-
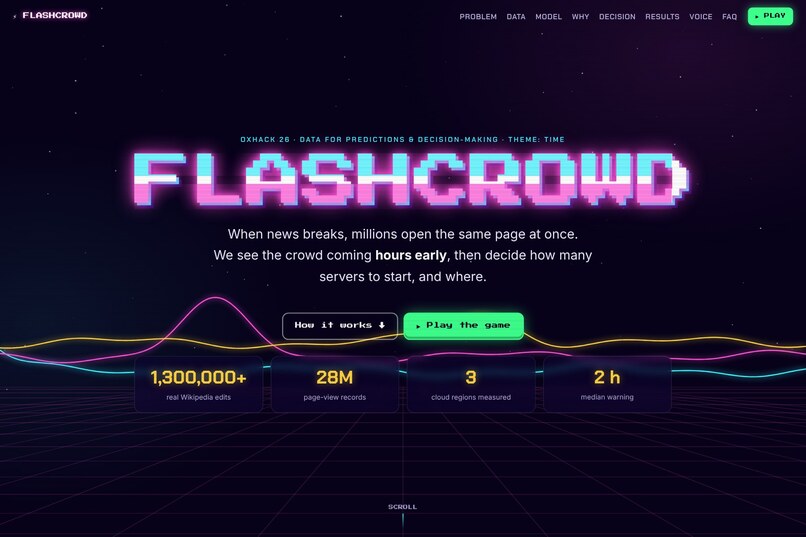
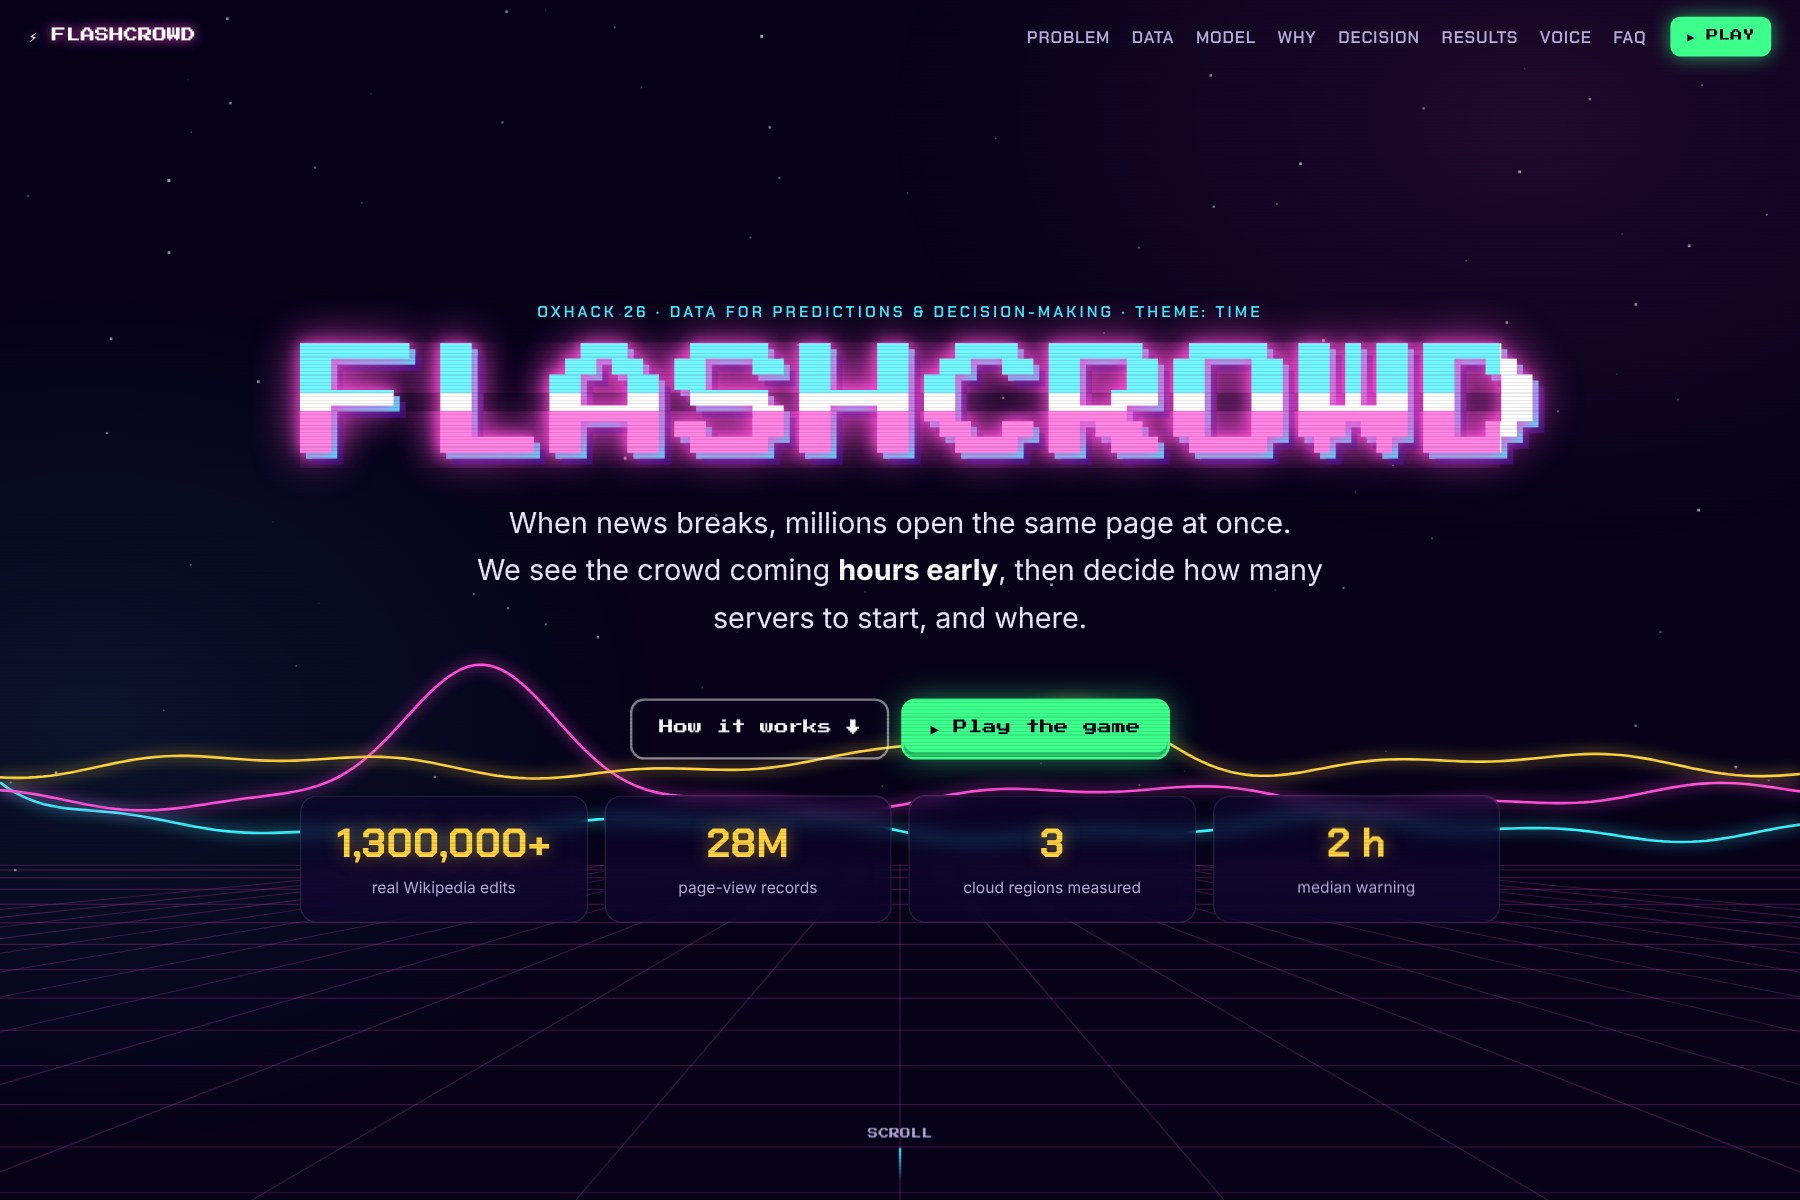
title and headline numbers
-
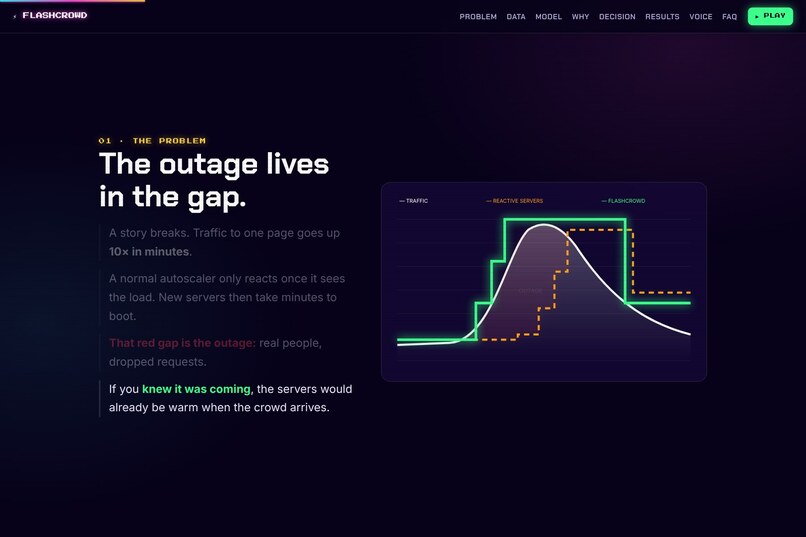
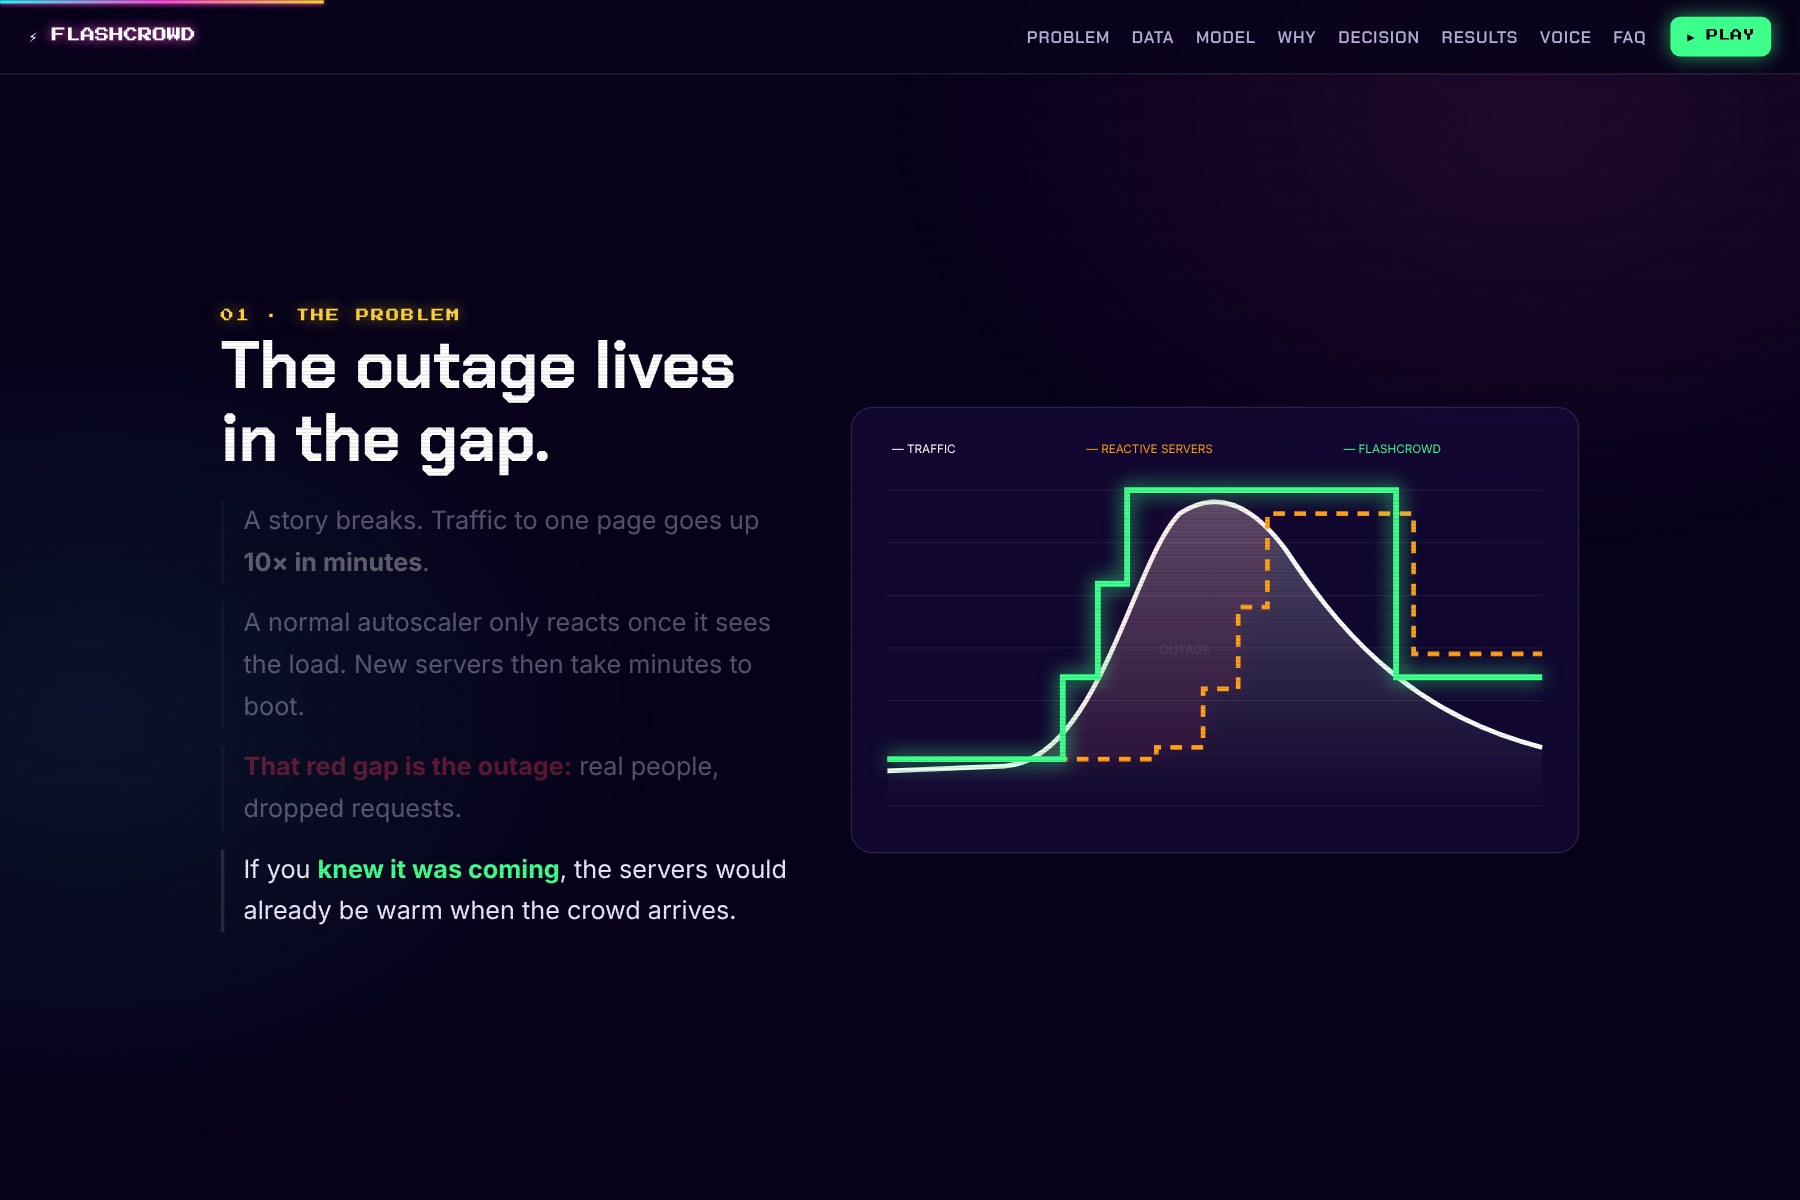
the outage gap chart
-
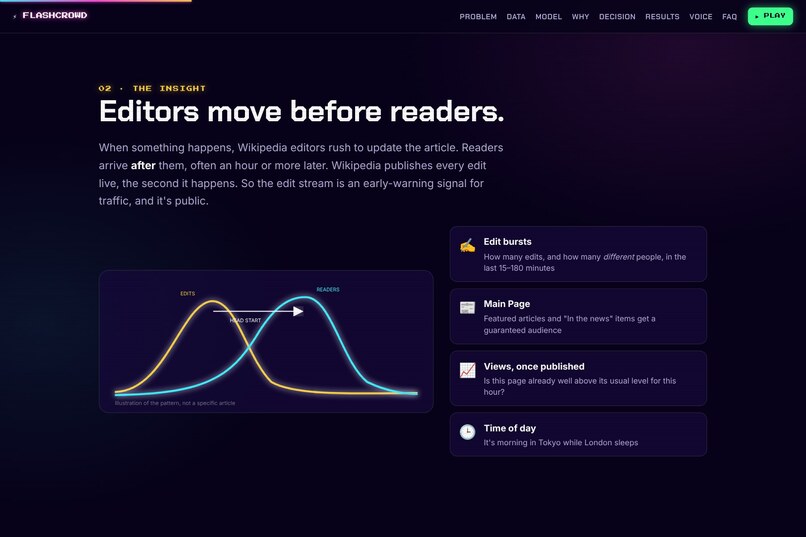
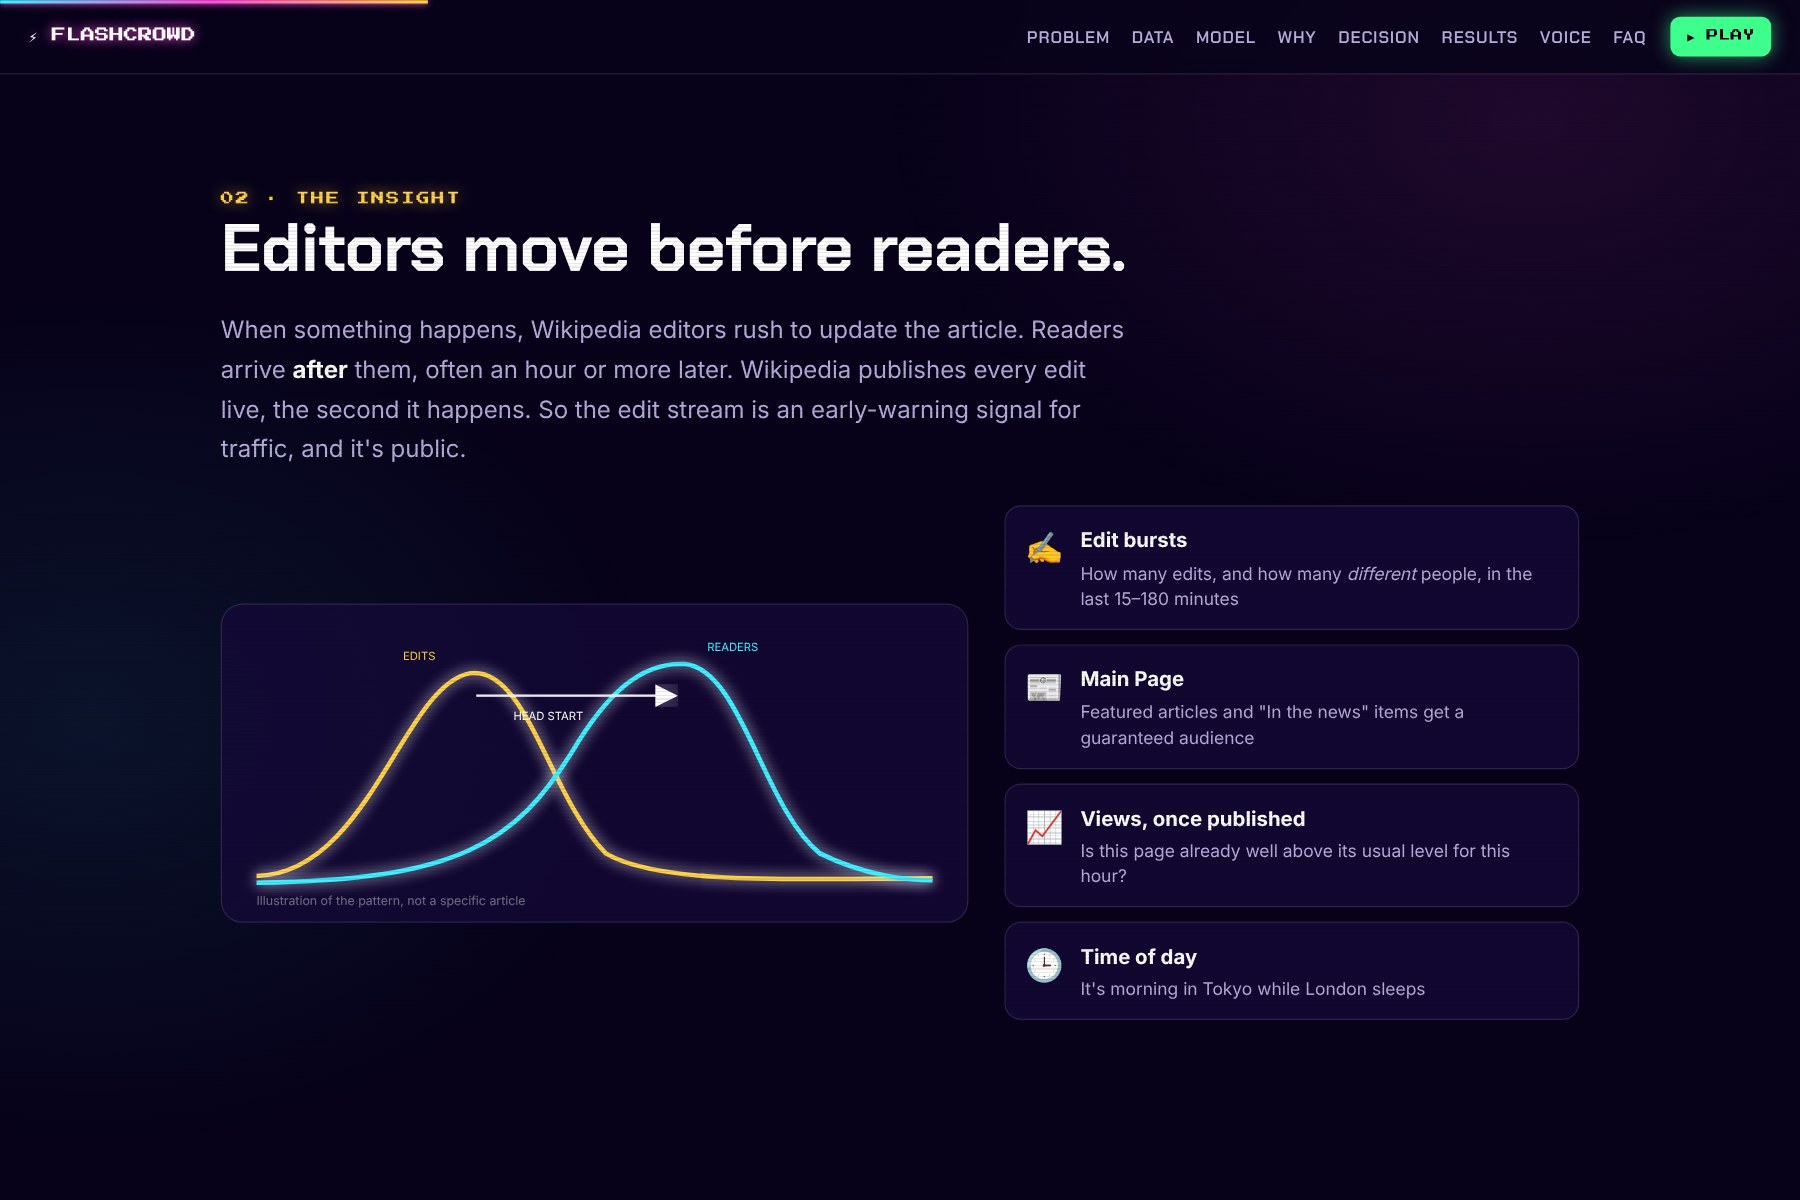
editors move before readers
-

-
-
-
-
-
-
-
-
-
-

-


Inspiration
Every big moment online, whether a death, a final whistle or a surprise album drop, sends millions of people to the same page within minutes. Most autoscalers only react: they see the load, ask for servers, and wait for them to boot. The outage happens in that gap.
We noticed that on Wikipedia the crowd doesn't arrive without warning. When something happens, editors rush to update the article first, and readers follow, often an hour or more later. Wikipedia publishes every edit live and for free. So we asked: can the edit stream tell us where the crowd is going before it gets there, and can we start the right number of servers, in the right region, in time?
That fits the theme, Time, and the challenge, Data for Predictions & Decision-Making. Wikipedia is a public stand-in for a private problem that shops on Black Friday, banks on payday and game launches all share.
What it does
FLASHCROWD watches Wikipedia's live edit stream across 10 language editions, forecasts which articles will surge within 1–3 hours, rolls those forecasts up into traffic for three regions (London, New Jersey, Tokyo), and decides how many servers to start in each.
- Live forecasts every 15 minutes, each with readable reasons ("9 human editors in the last hour", "views 600× the usual for this hour").
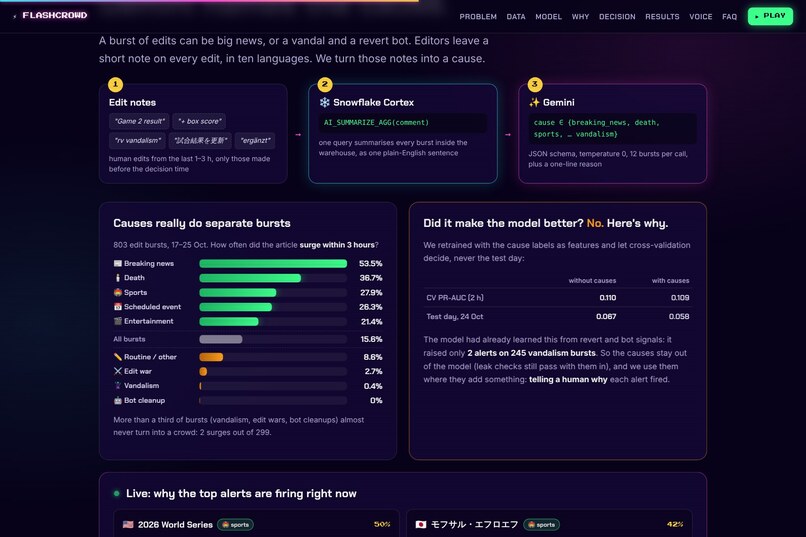
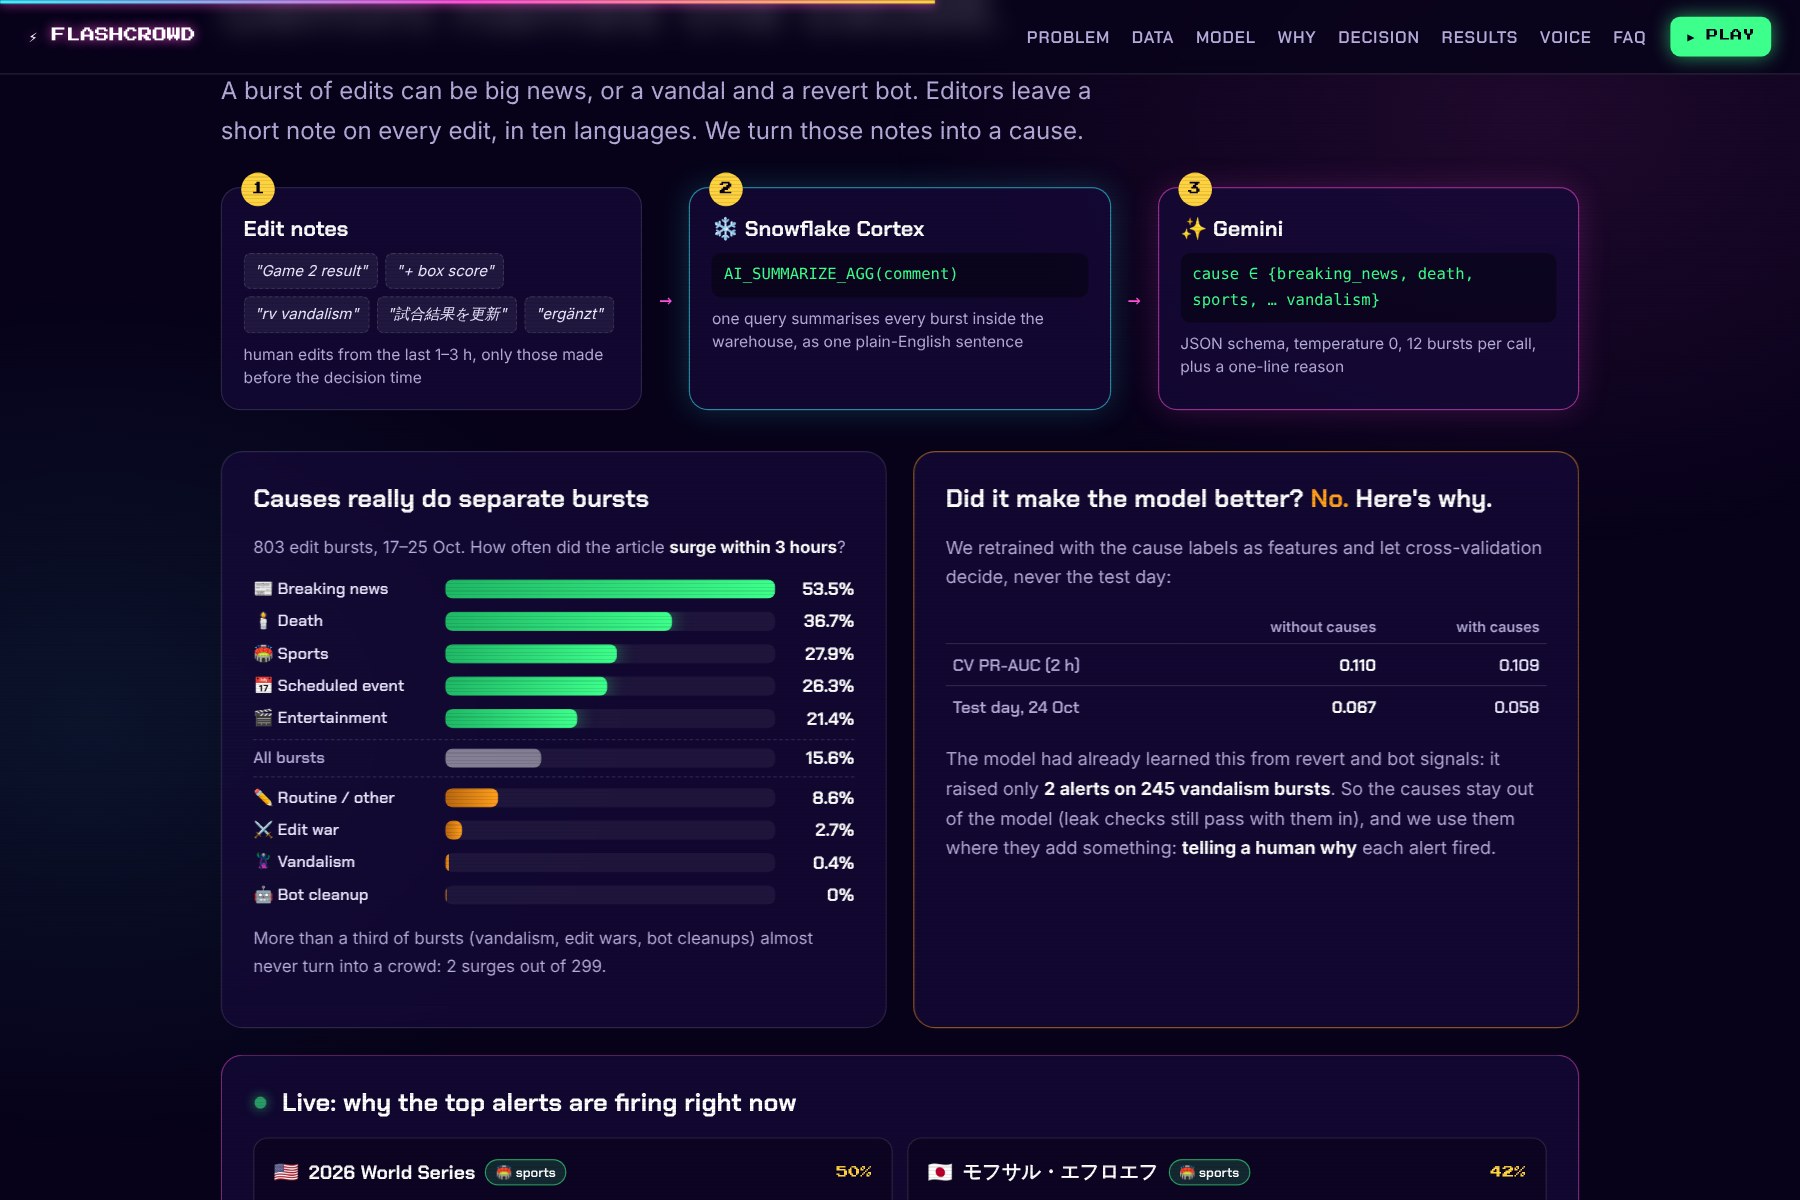
- Why it's surging: Snowflake Cortex summarises the editors' notes and Gemini labels the cause (breaking news, sports, vandalism…).
- A live scorecard that checks every prediction against what Wikipedia later publishes.
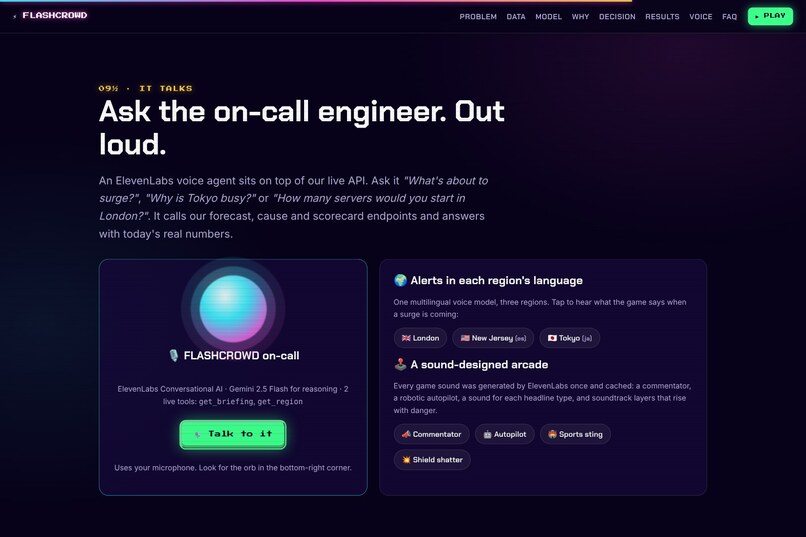
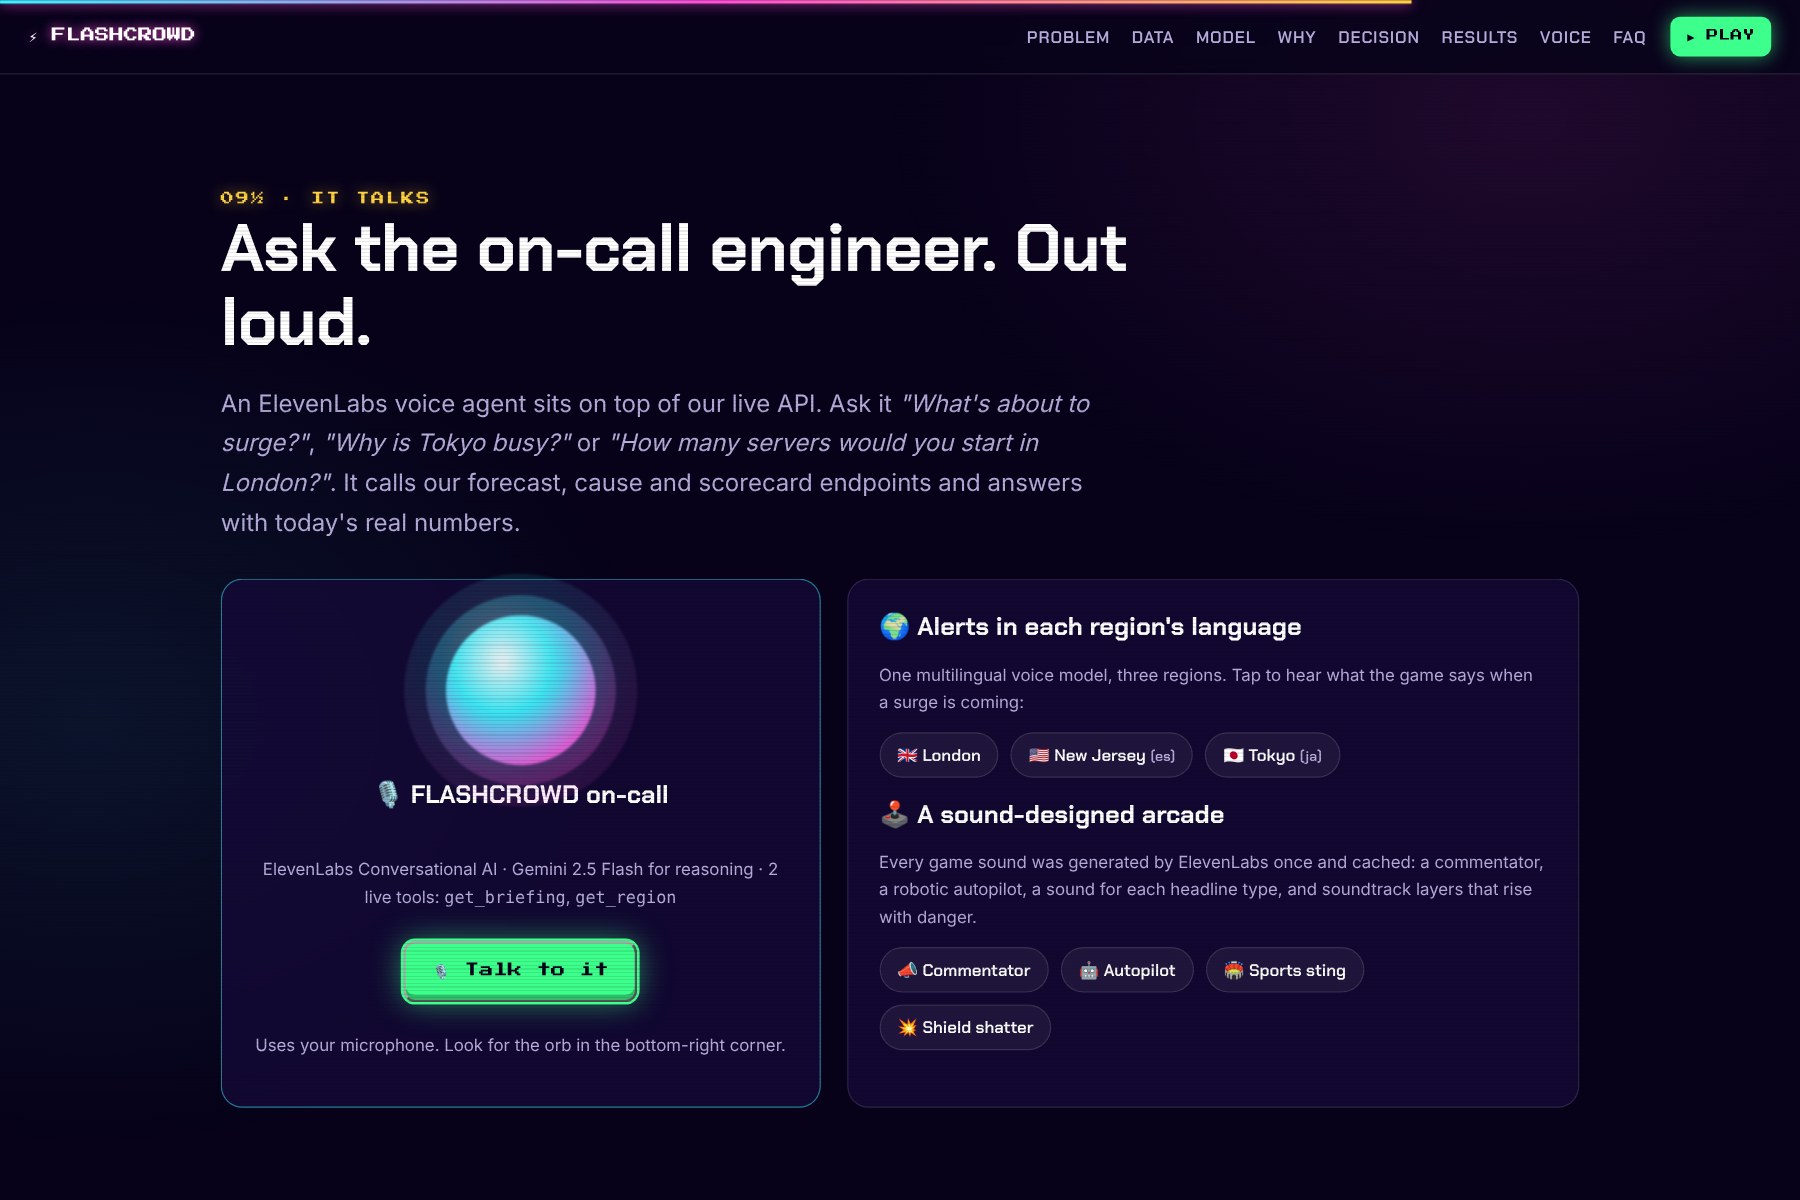
- A voice agent (ElevenLabs) you can ask out loud: "What's about to surge? How many servers would you start in Tokyo?" It answers from our live API.
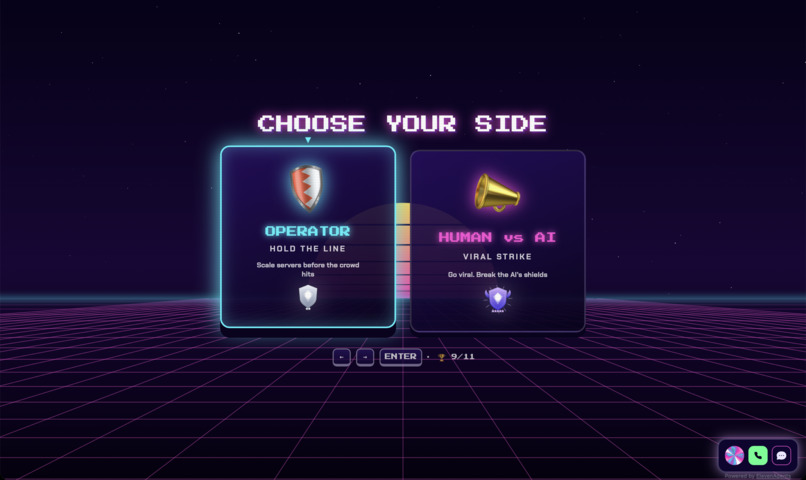
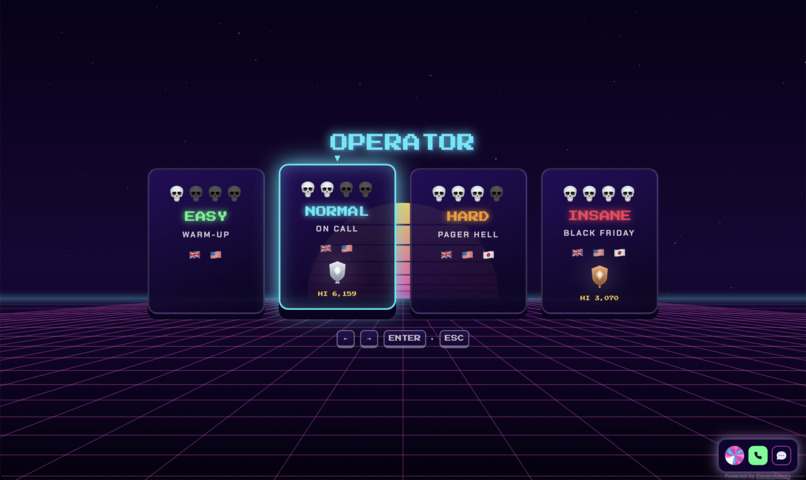
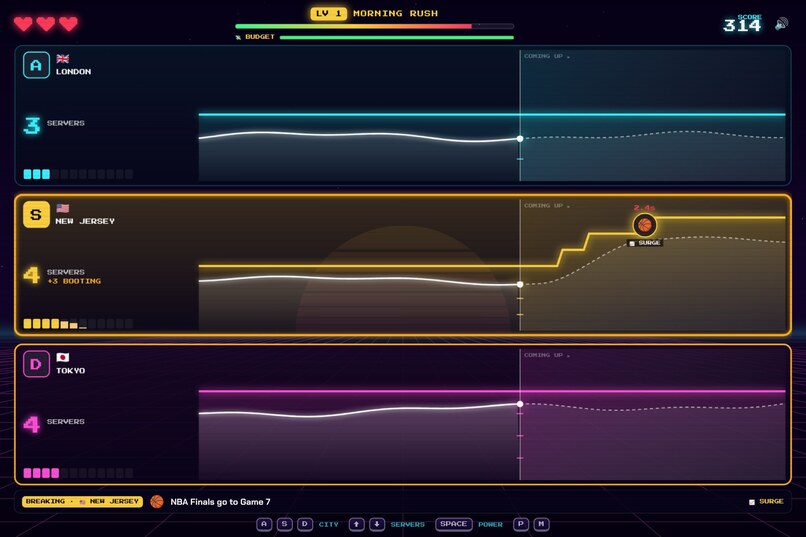
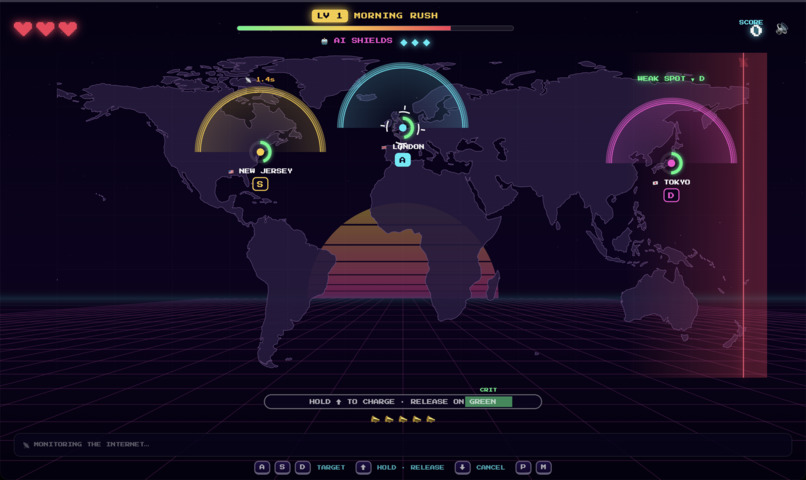
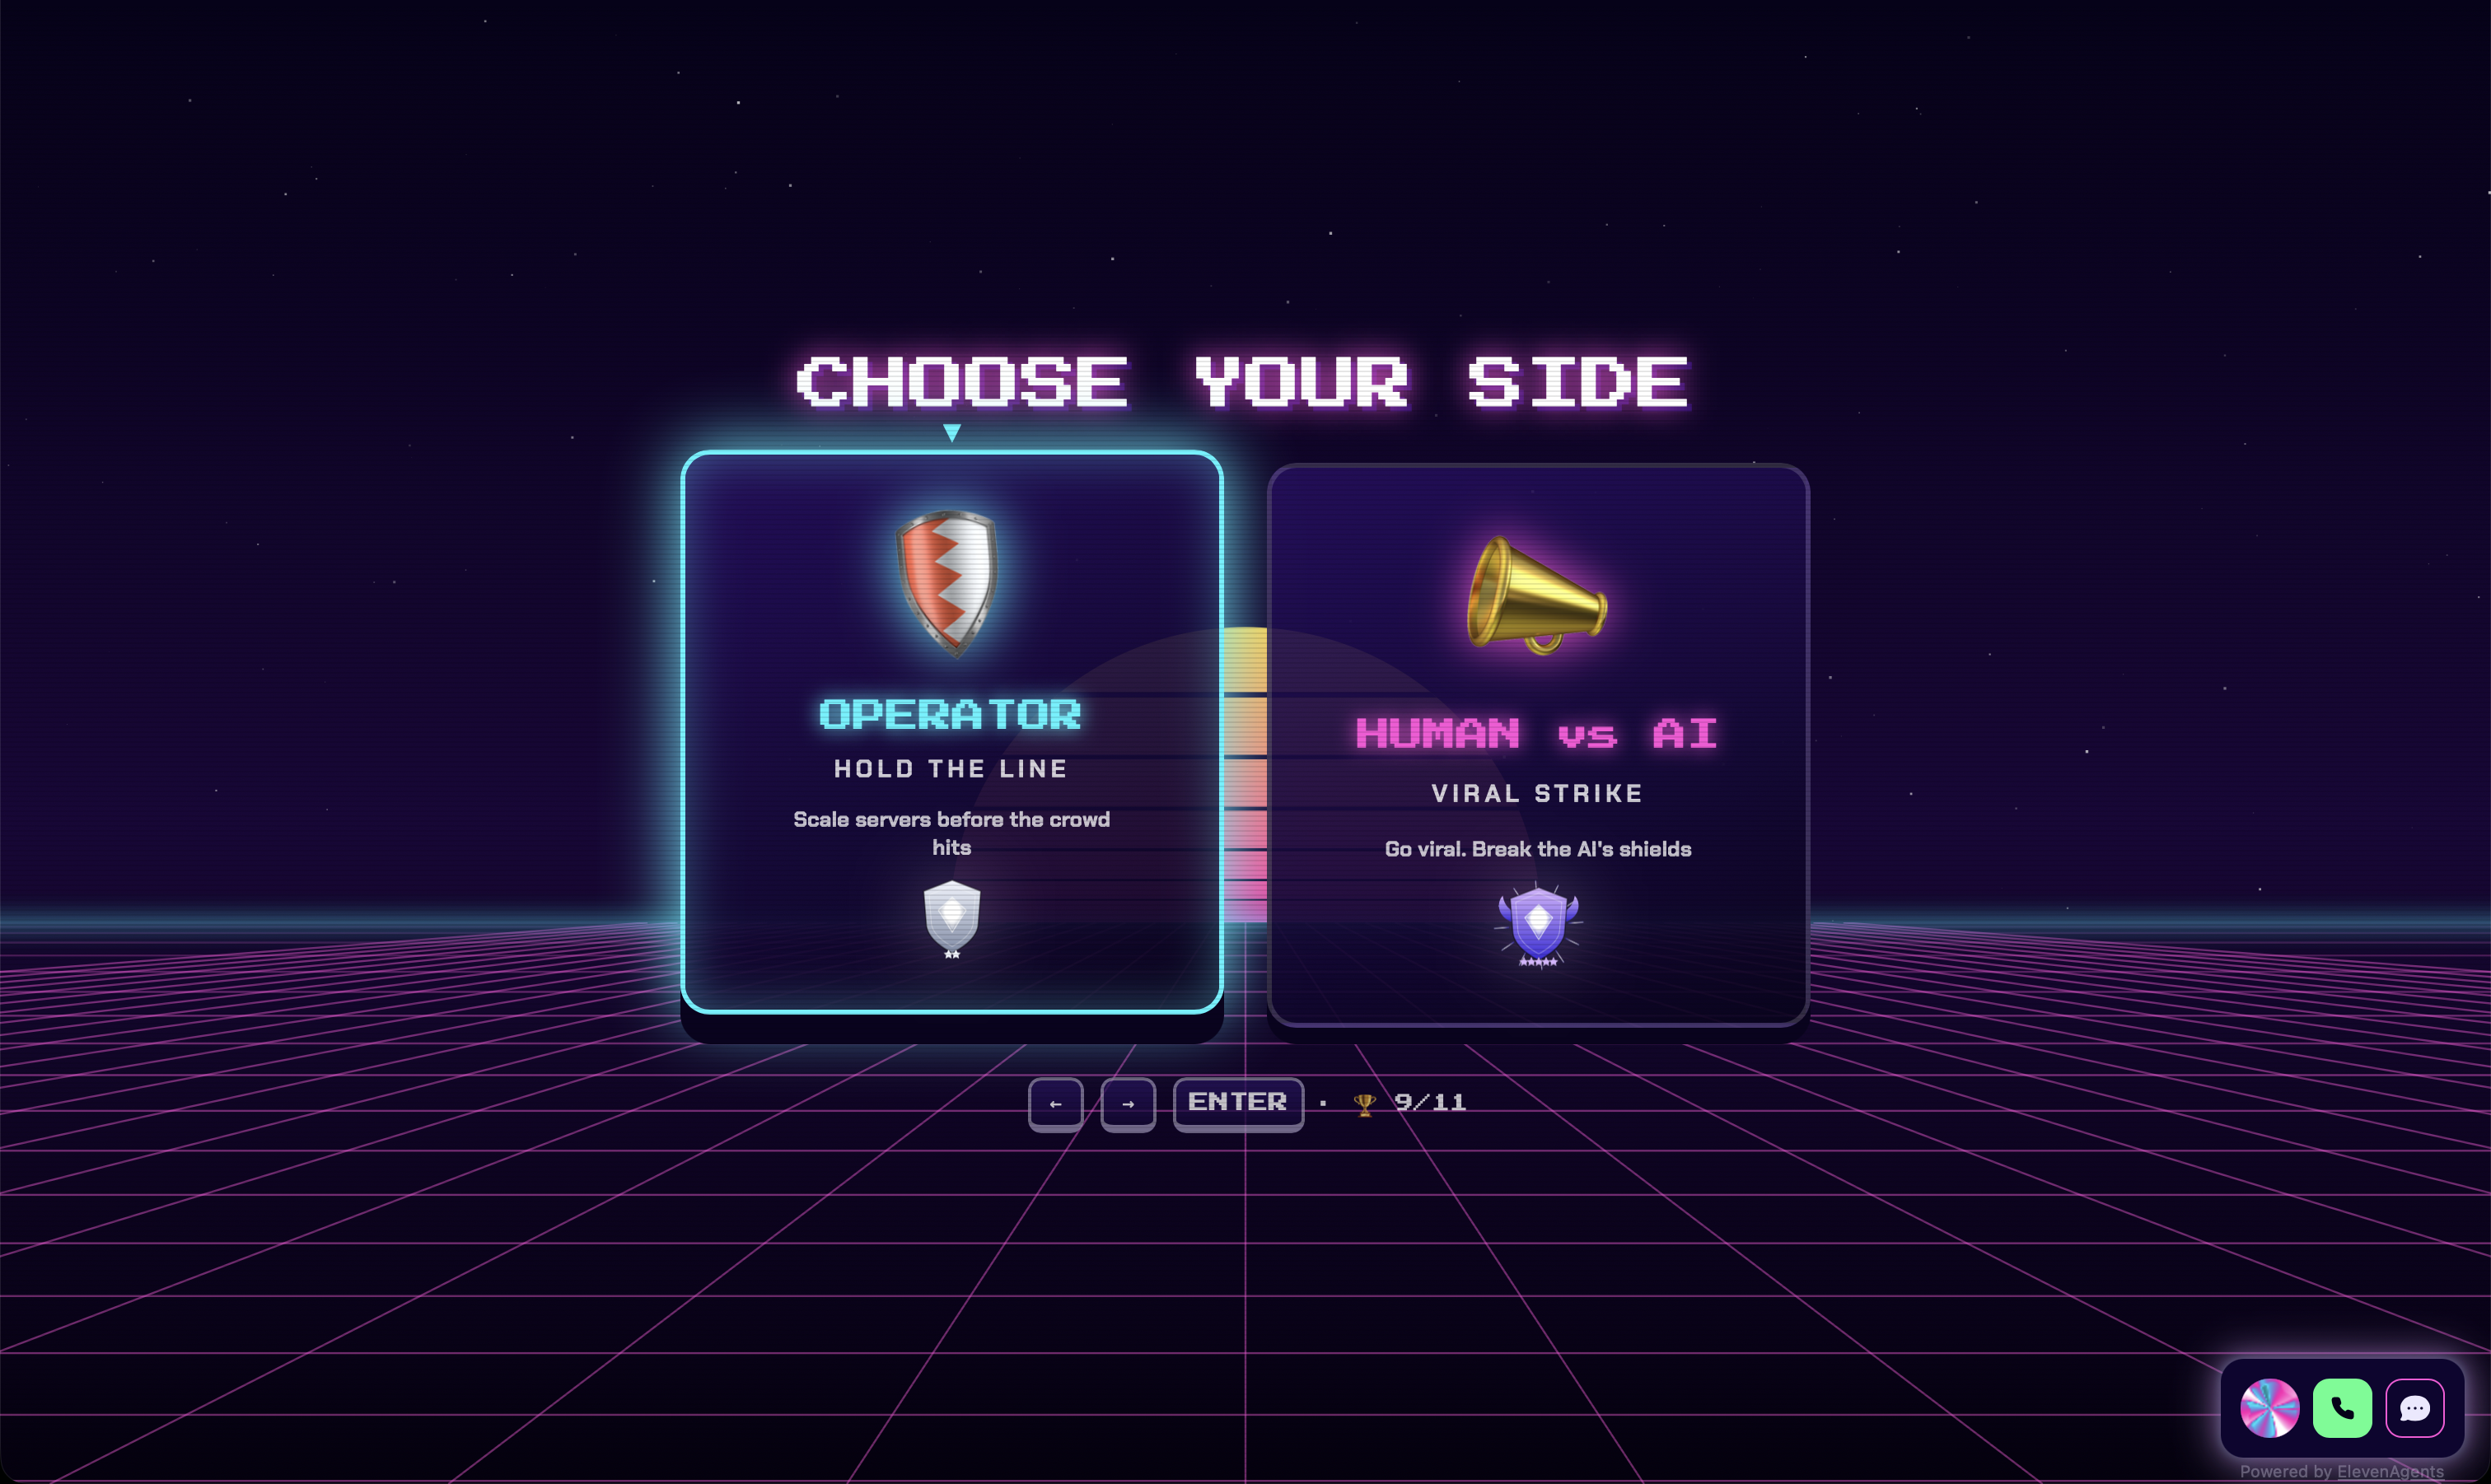
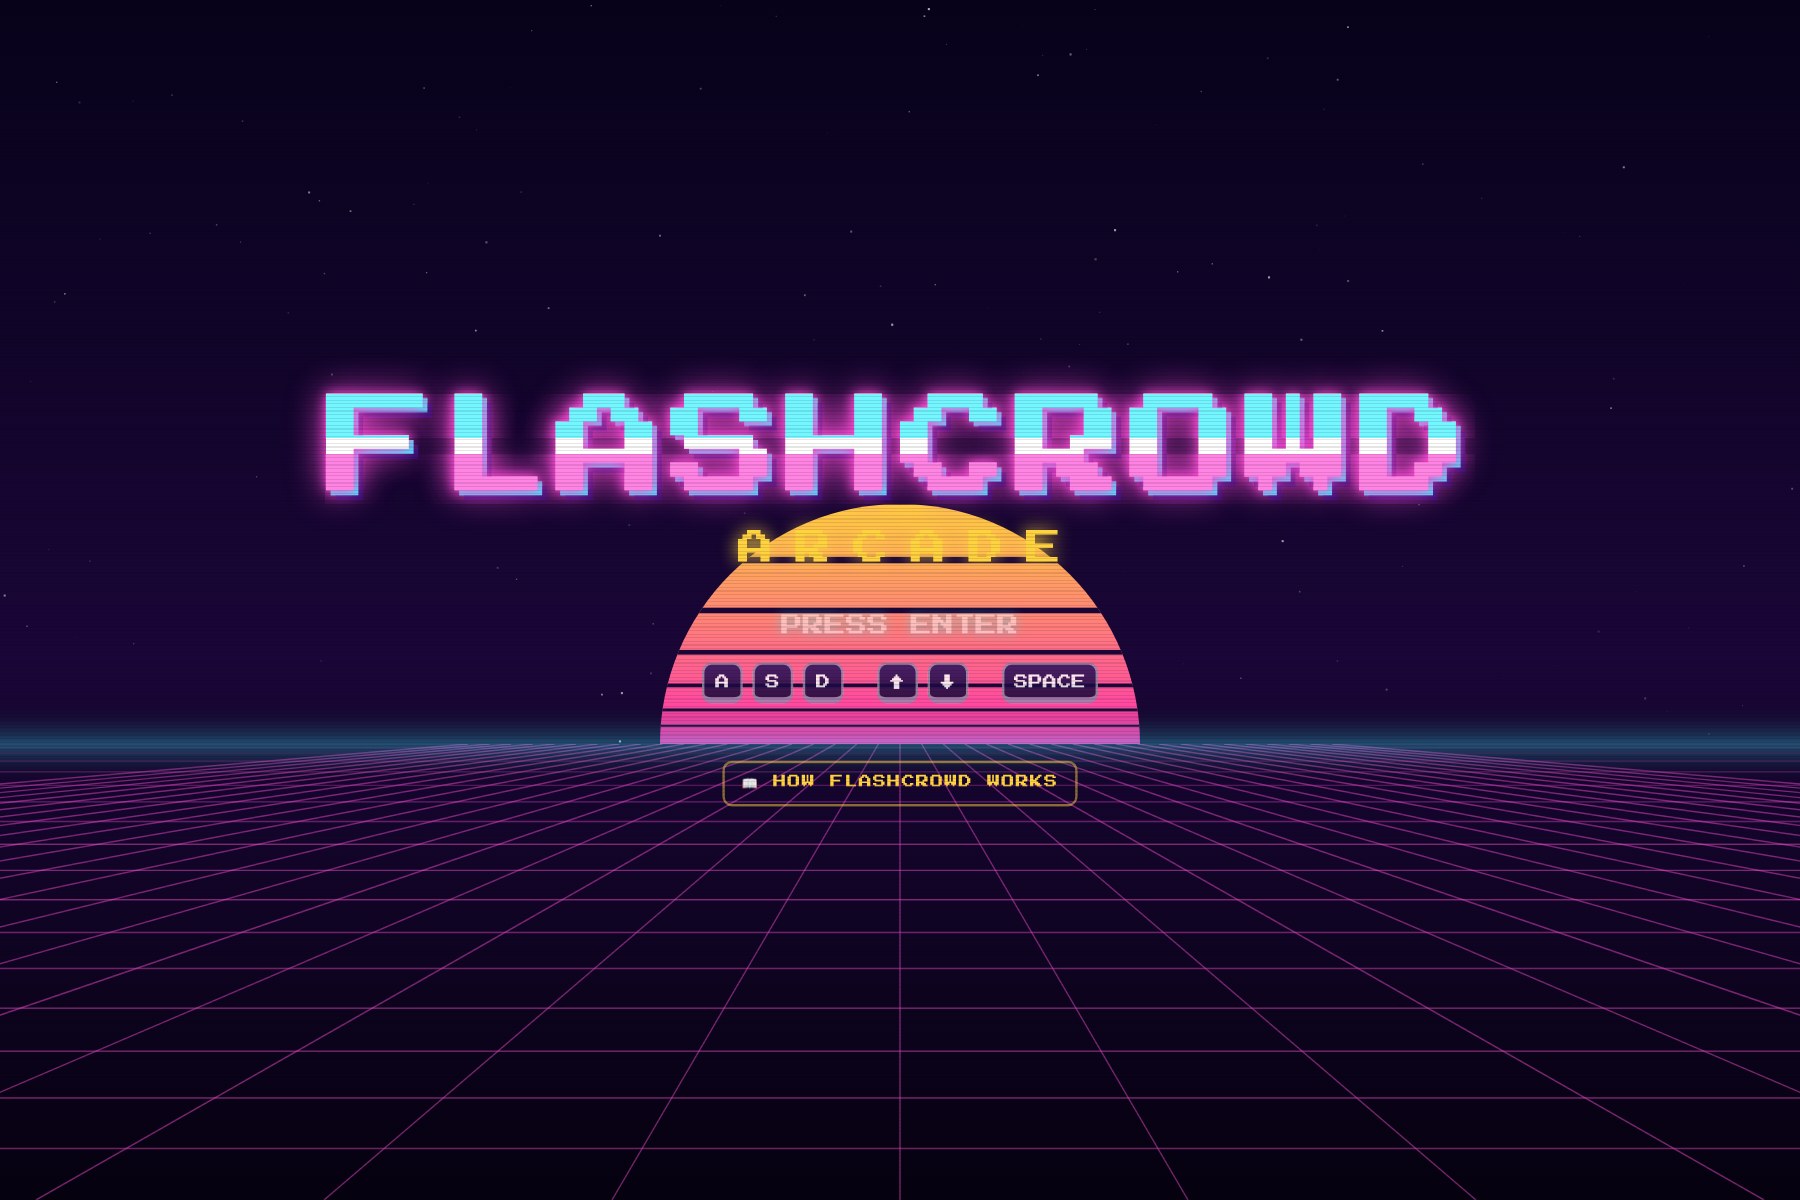
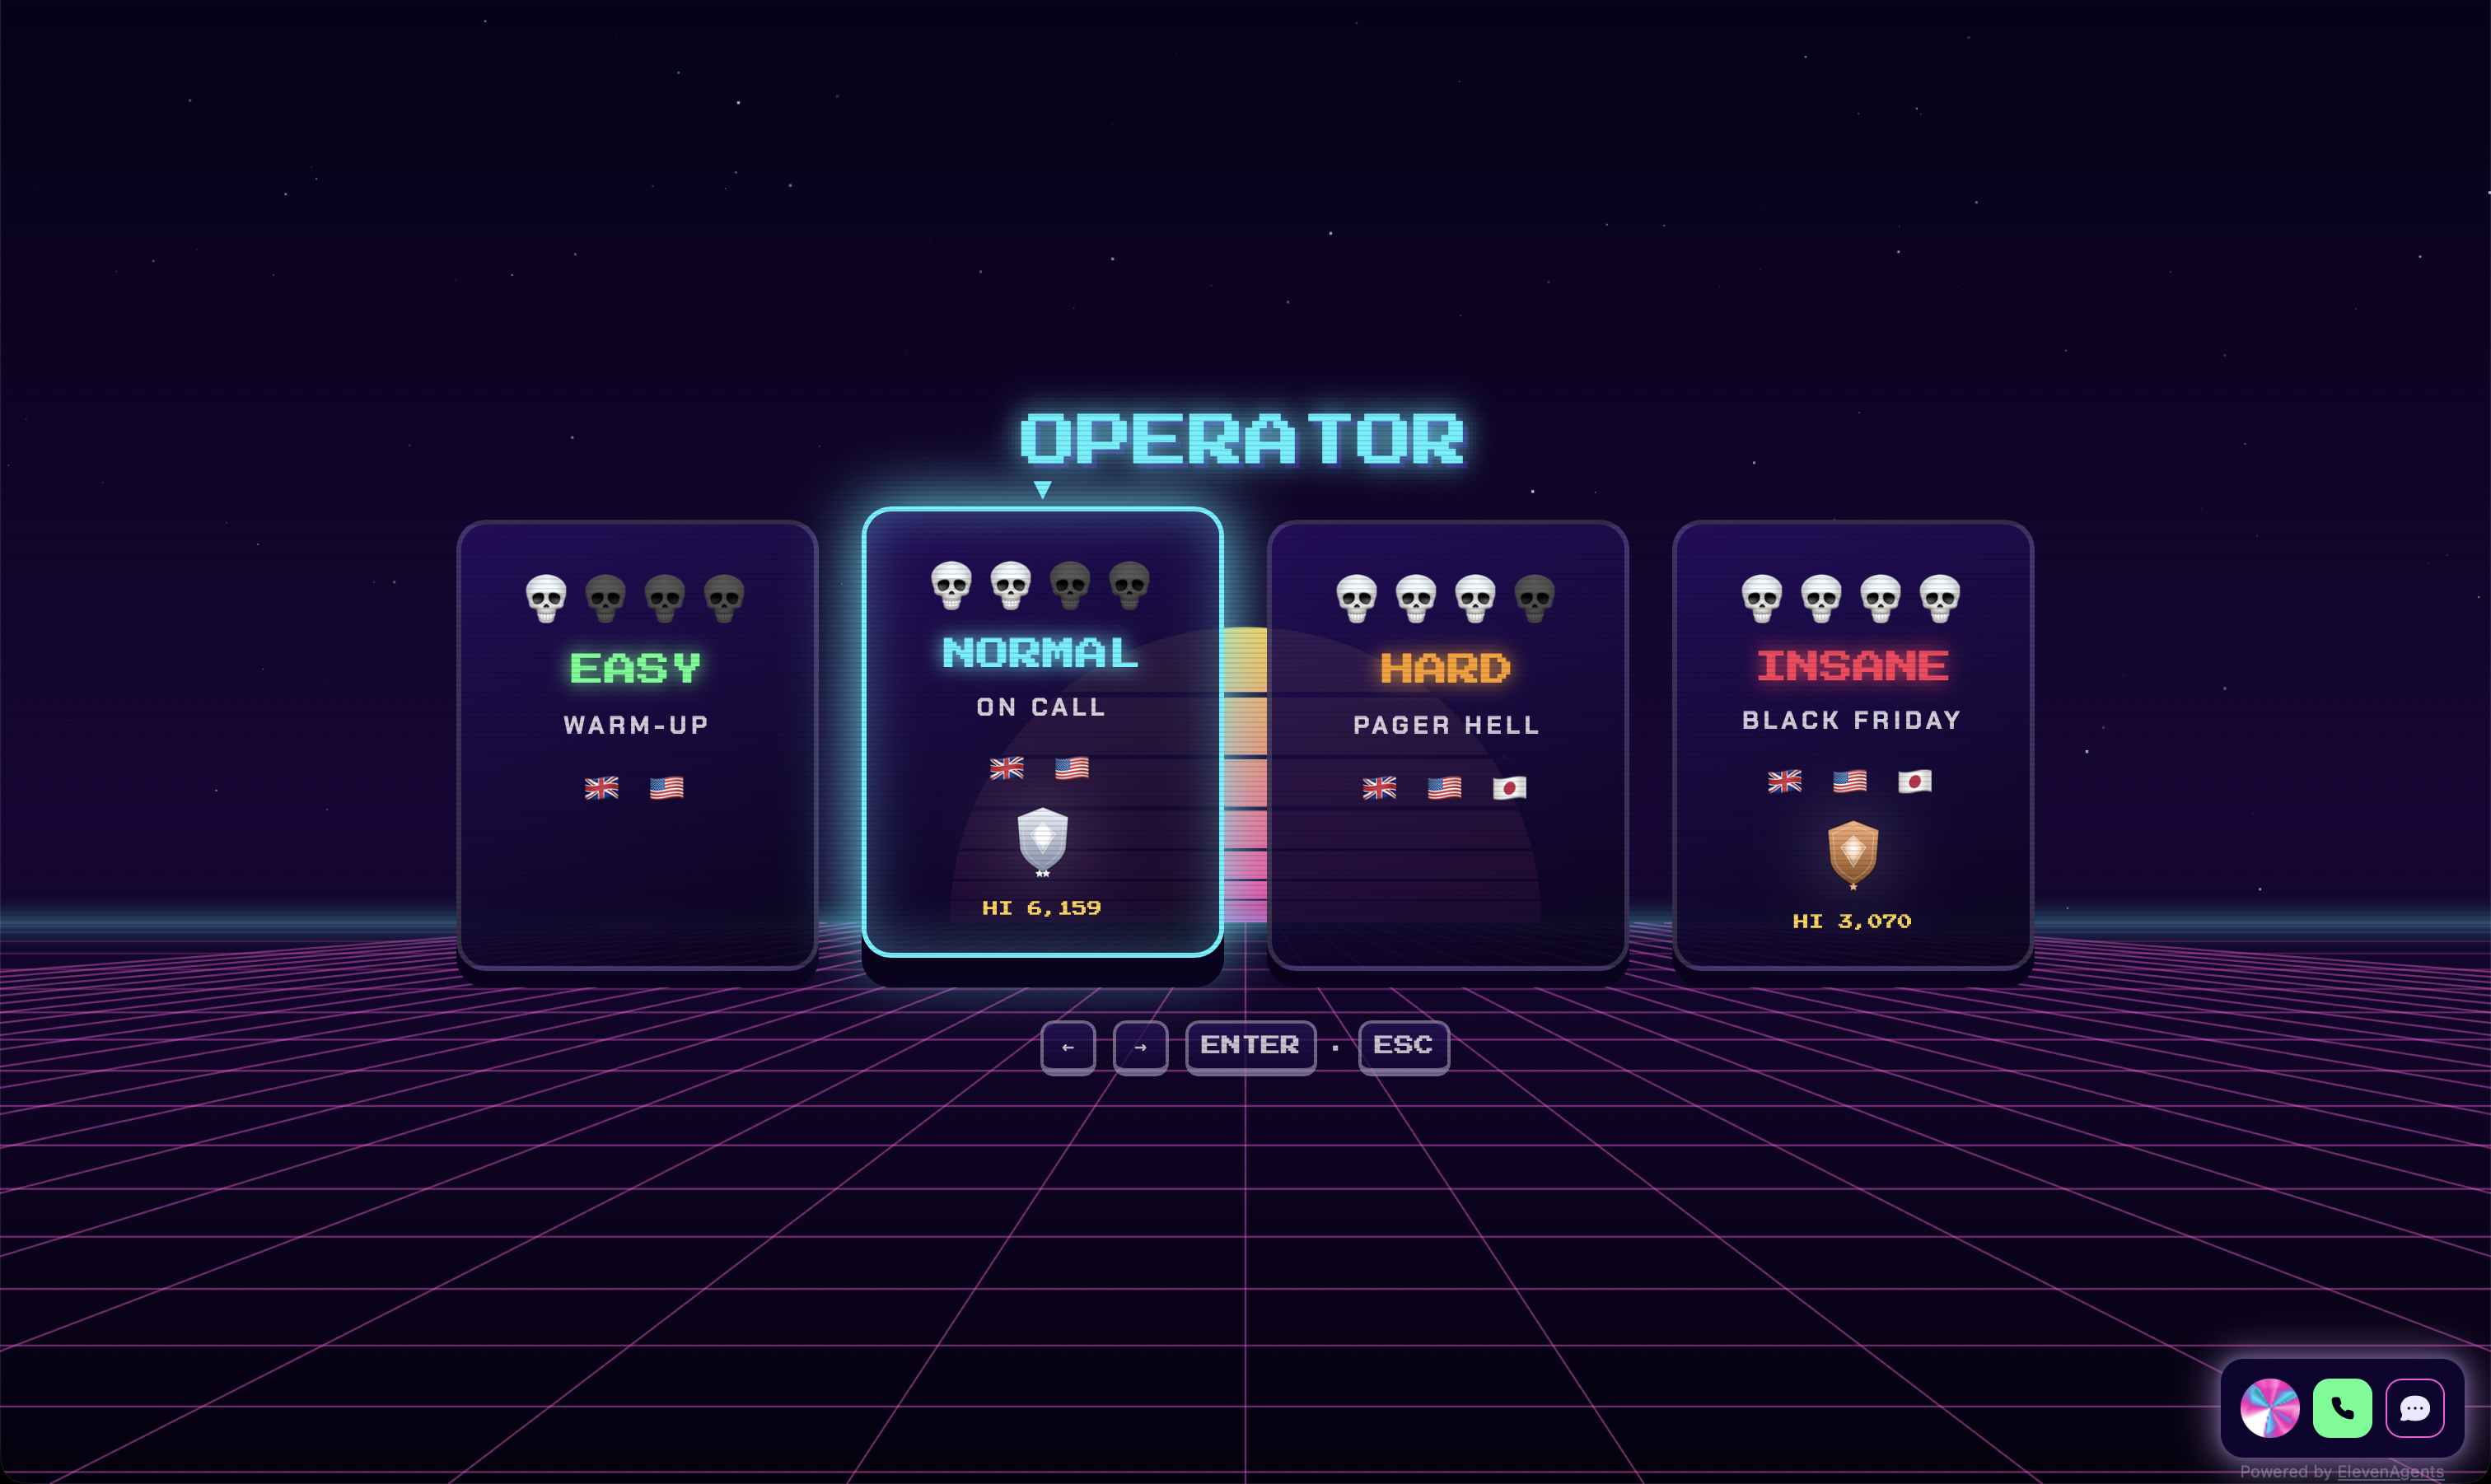
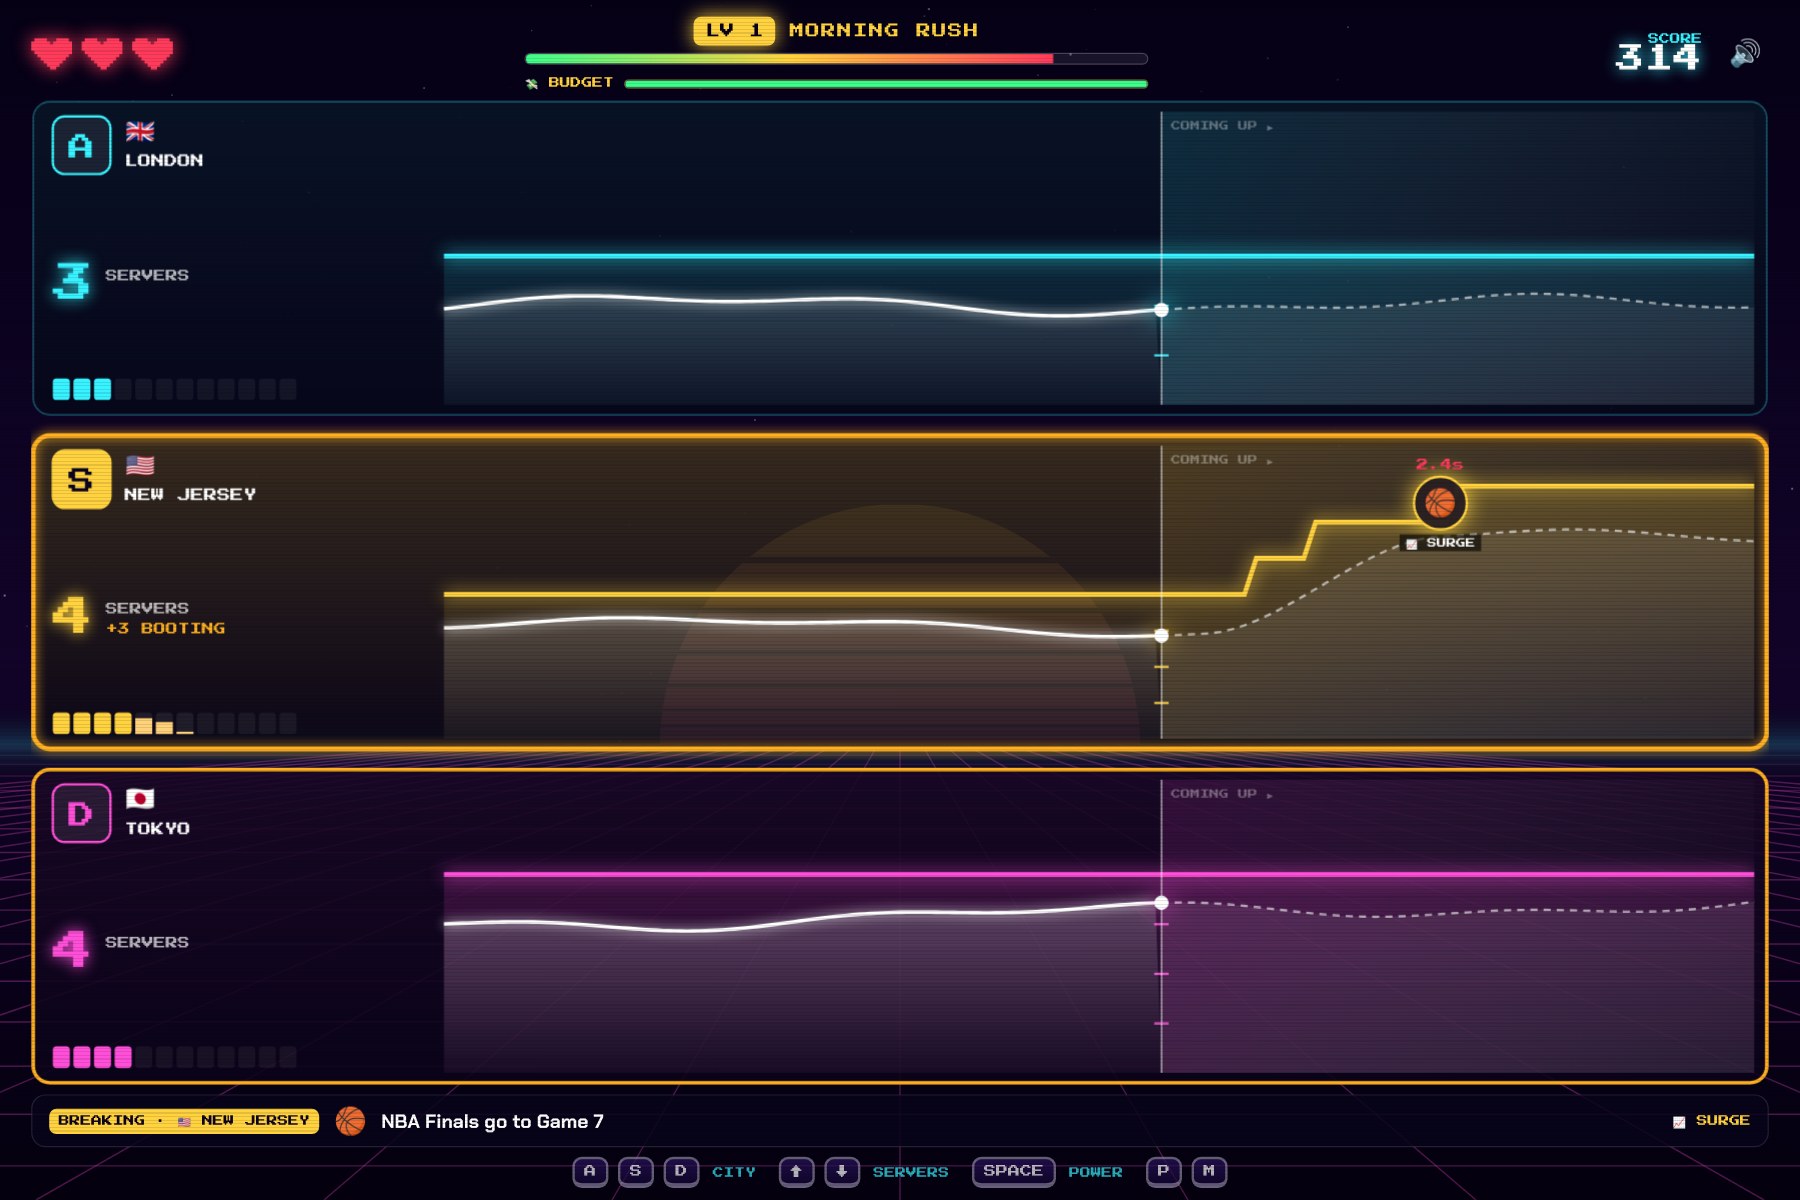
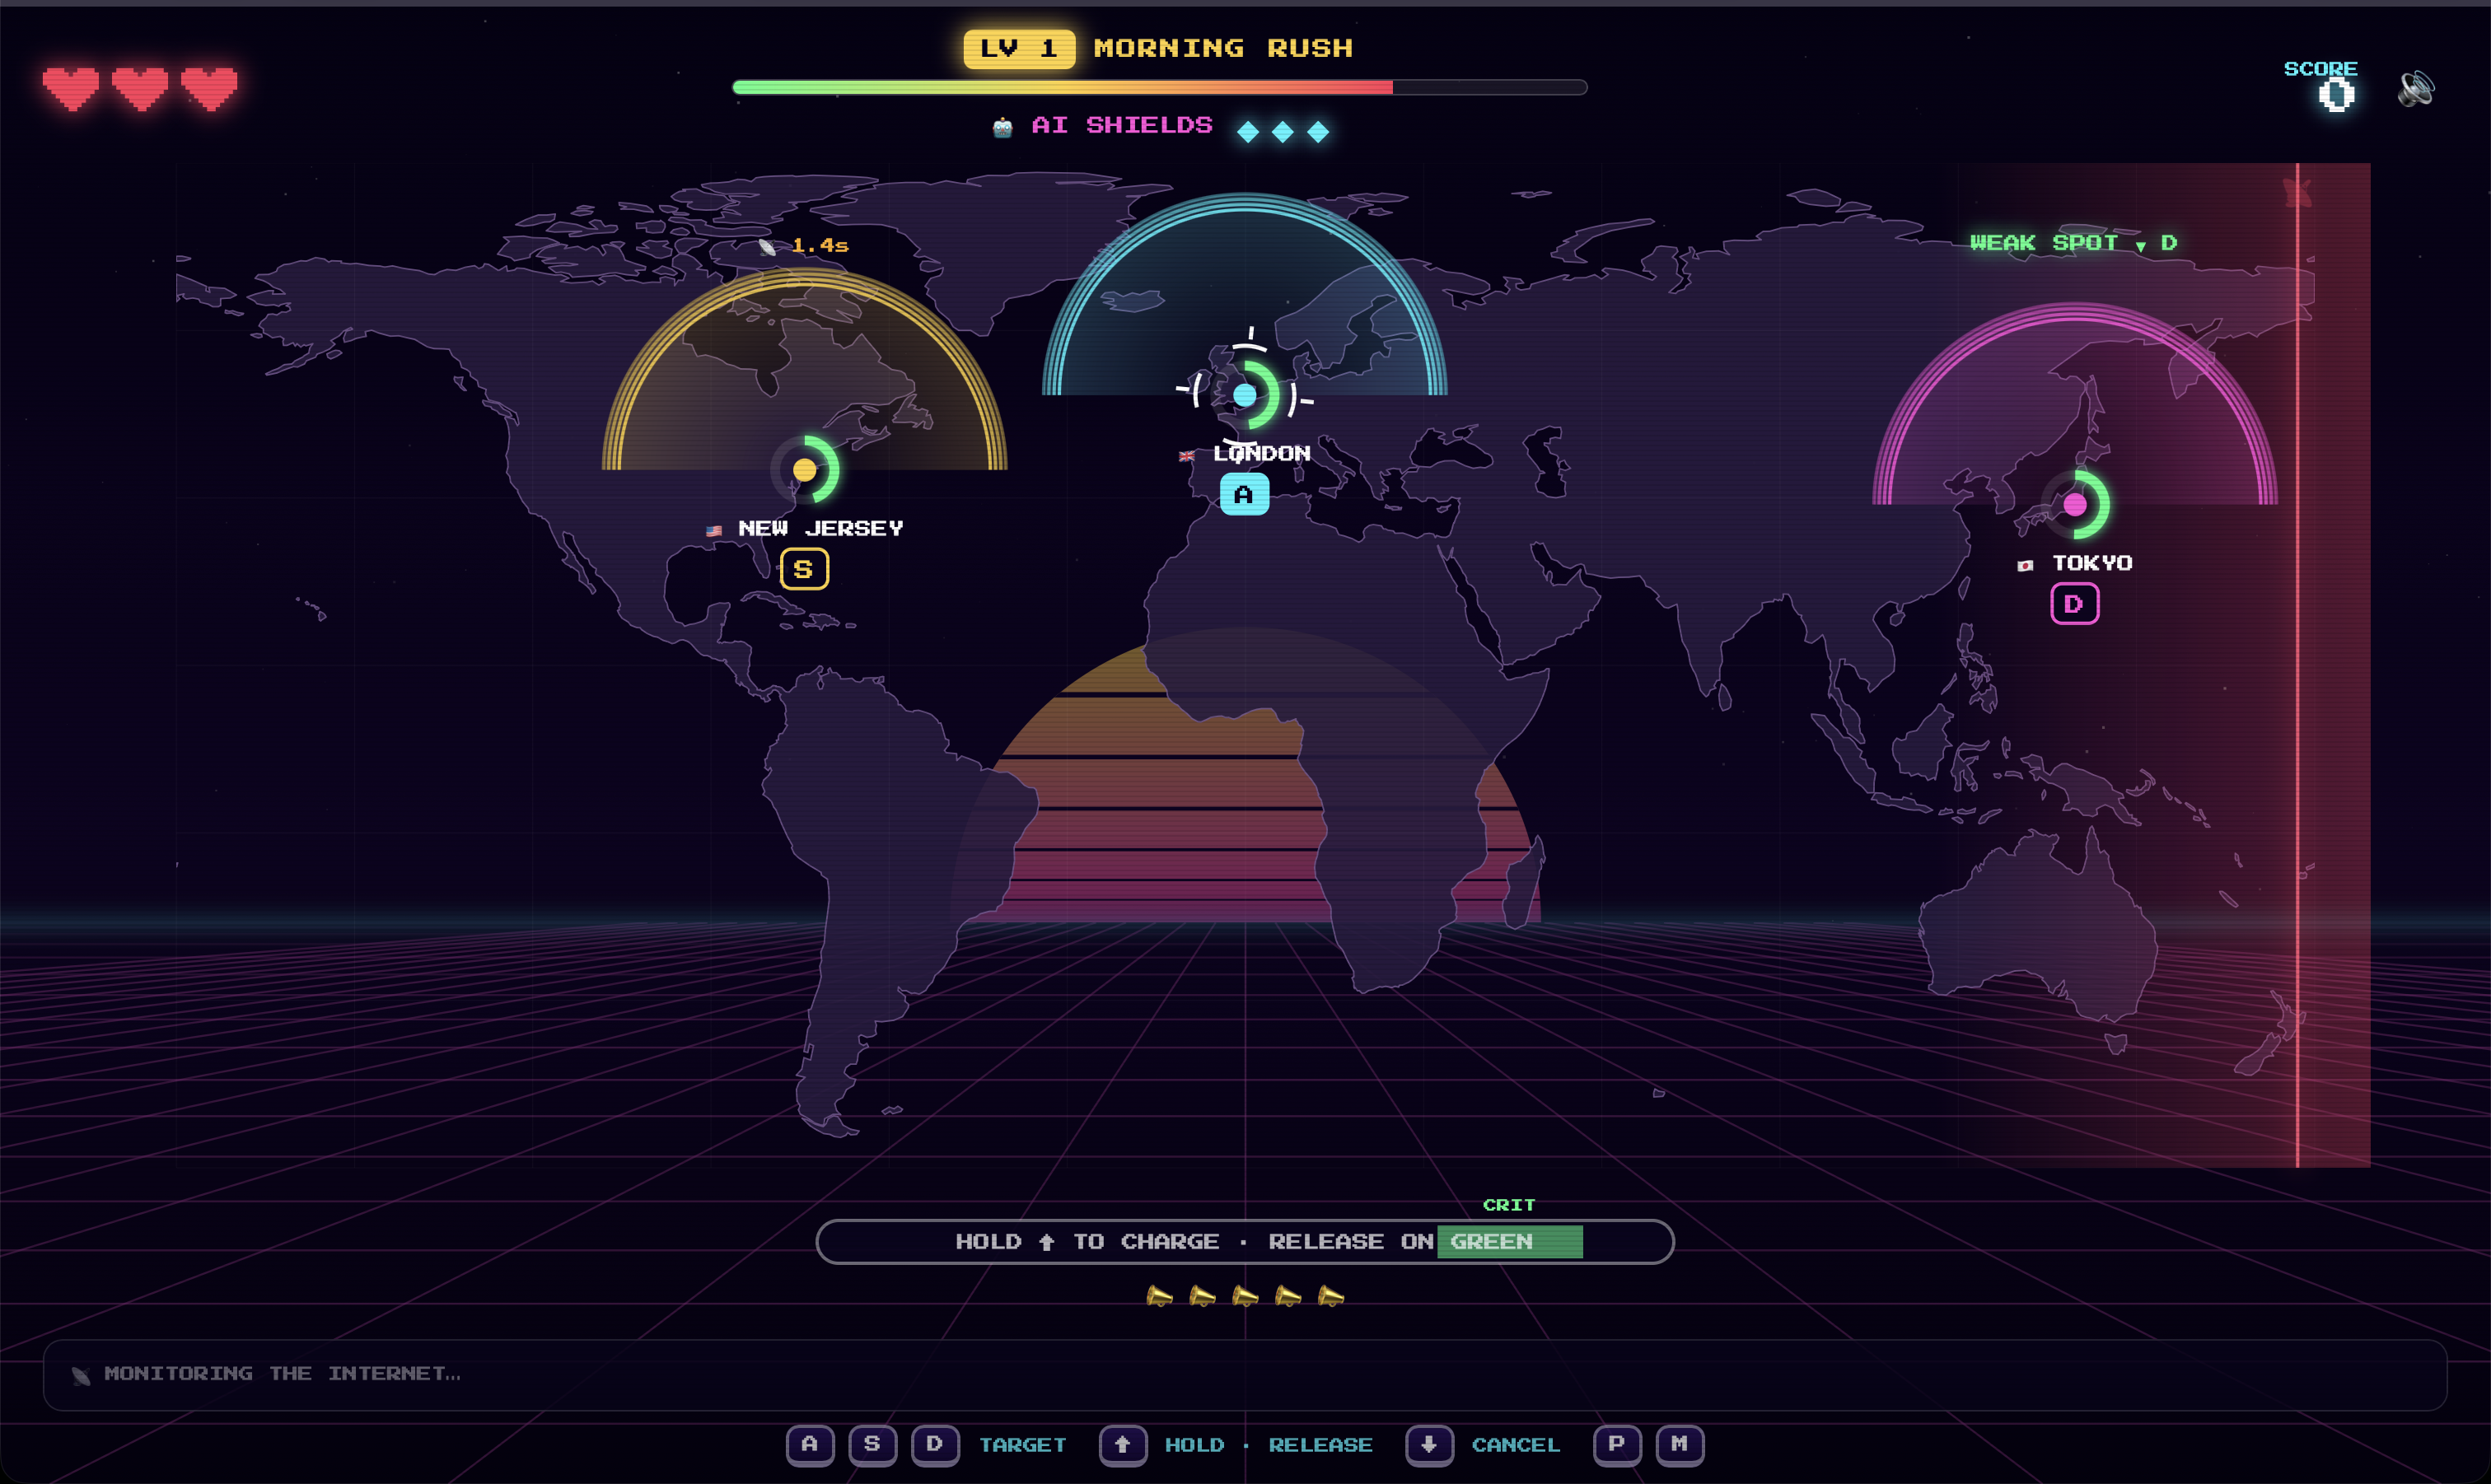
- An arcade with two games that teach the problem: Operator (scale servers before the wave hits, without wasting budget) and Human vs AI (you play the internet and try to overwhelm the autopilot).
How we built it
Data, all collected this weekend:
- 1.3M+ edits recorded live from Wikimedia EventStreams (17–25 Oct). Wikipedia keeps only 7 days of edit history, so the recorder went up in the first hour.
- ~28M hourly page-view rows from Wikimedia's dumps, plus the exact time each hour was published (about 2 h 15 min after the hour ends).
- 40 Main Page events (Today's Featured Article, "In the news"), timed from the template's revision history.
- 87,843 country-share rows to split English traffic between regions.
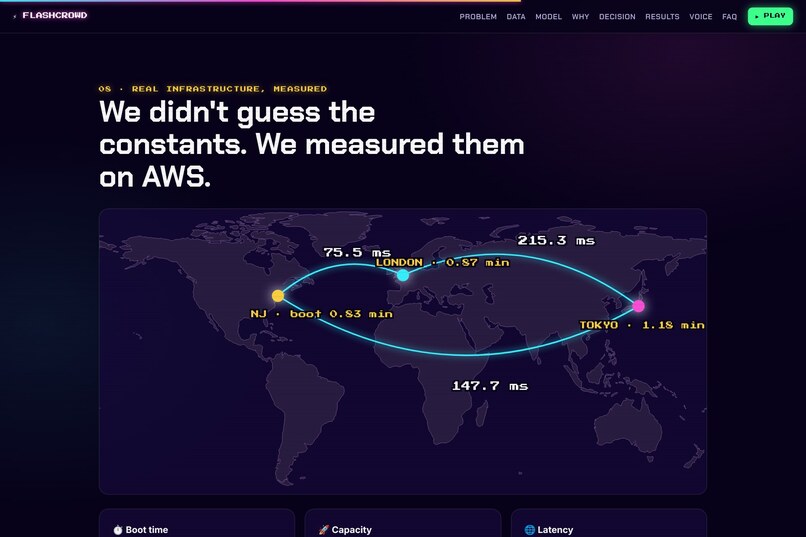
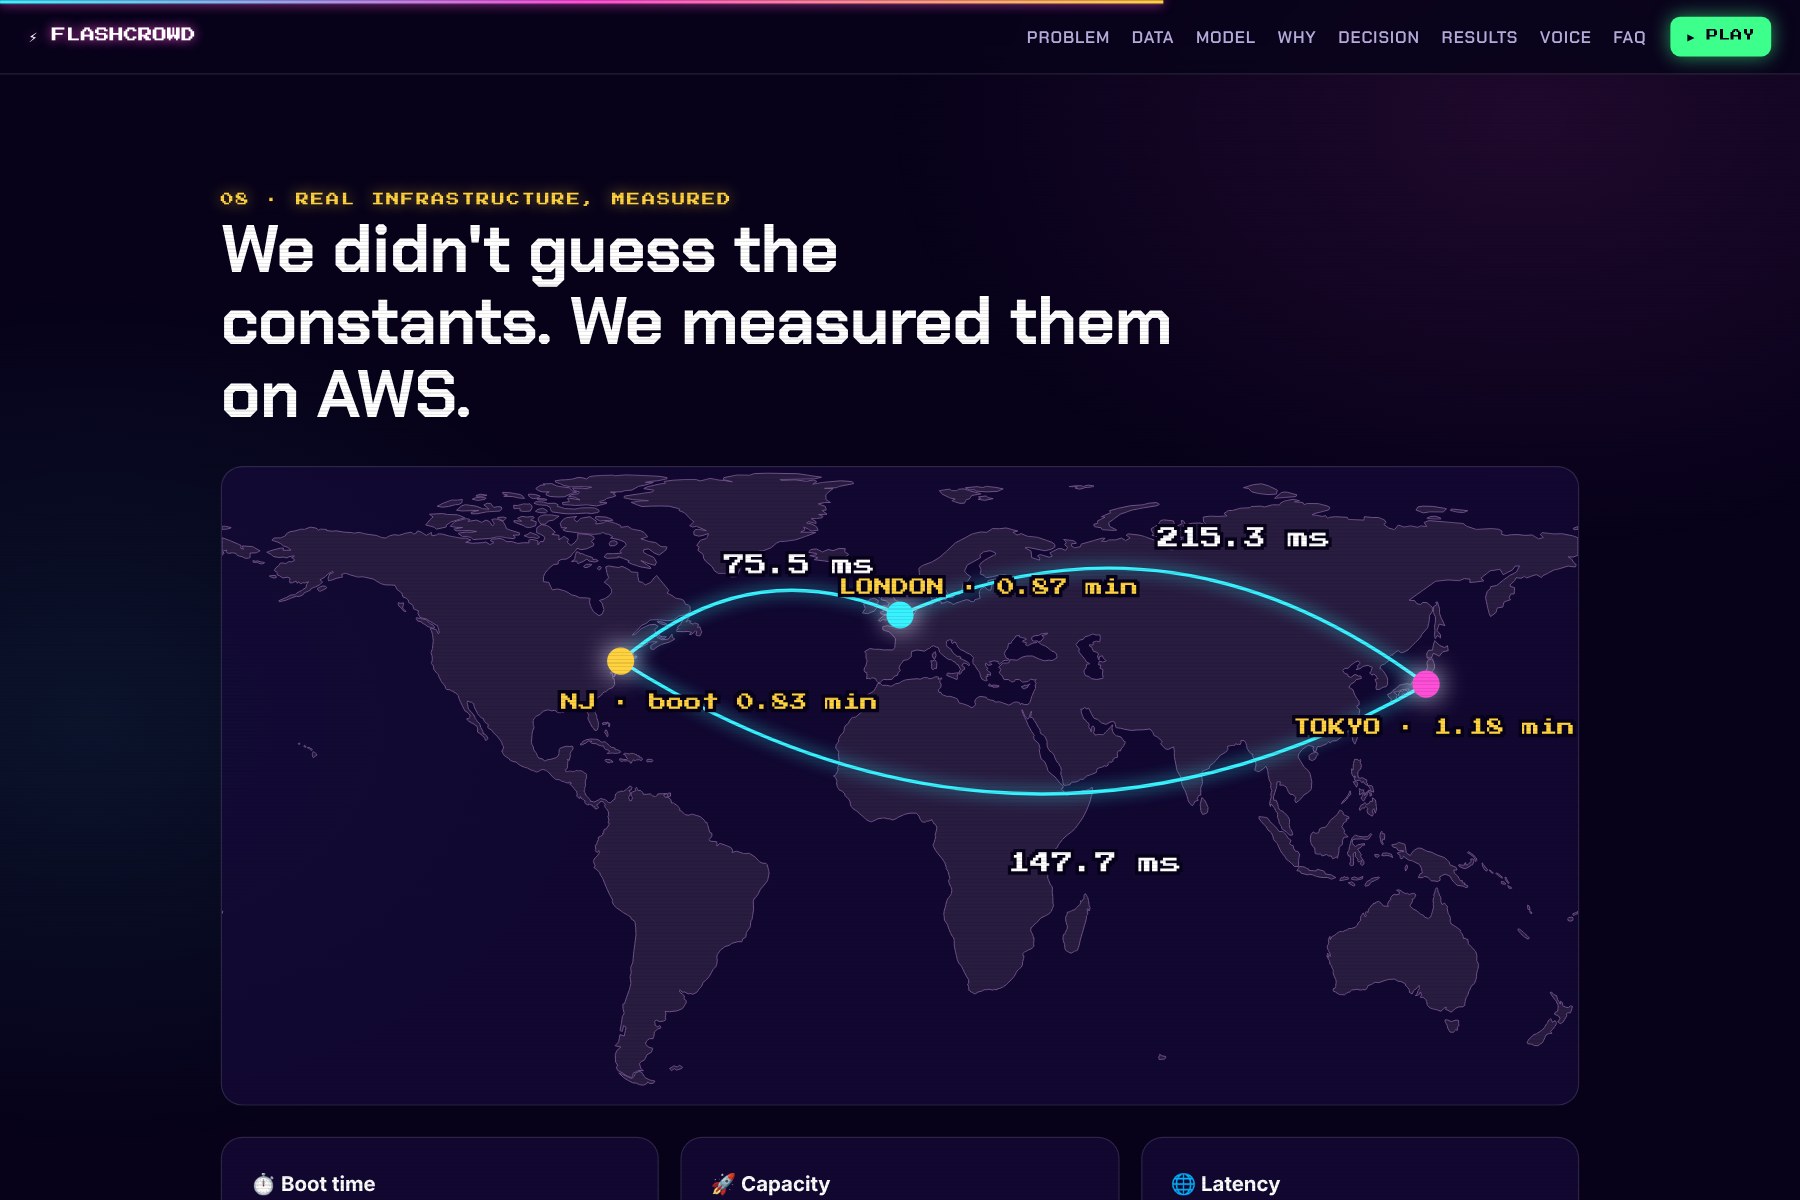
- Real AWS measurements: 15 real server boots (median 0.83–1.18 min), capacity 254 req/s per server, and round-trip times between regions (75.5 / 147.7 / 215.3 ms).
Stack: AWS EC2 runs the recorder, loaders, model jobs, FastAPI + WebSocket API and nginx. Snowflake is the warehouse. LightGBM is the model. Gemini and Snowflake Cortex label causes, ElevenLabs does all the voice and sound, and the front end is Vite + GSAP.
What counts as a surge: an article-hour is a surge when
$$ \text{views}{h} \;\ge\; \max!\big(5 \times \operatorname{median}{7\,\text{days}}(\text{views at the same hour}),\; 3000\big) $$
(the floor is 800 for smaller wikis). We predict the onset: the first surge hour after a calm one.
The model: three LightGBM classifiers predict a surge within 1, 2 and 3 hours, with calibrated probabilities and size ranges. Features include edit counts over 15–180 minutes, unique human editors, bot and revert share, edit acceleration, views relative to normal, Main Page status and the readers' local time of day.
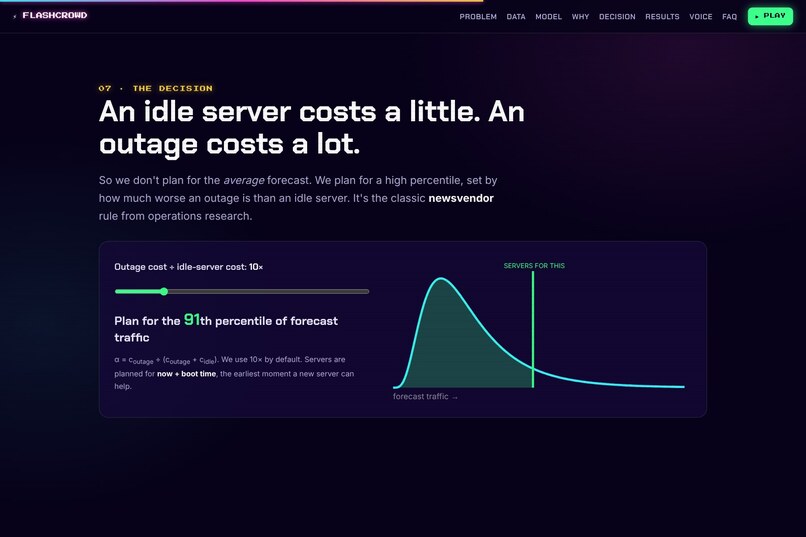
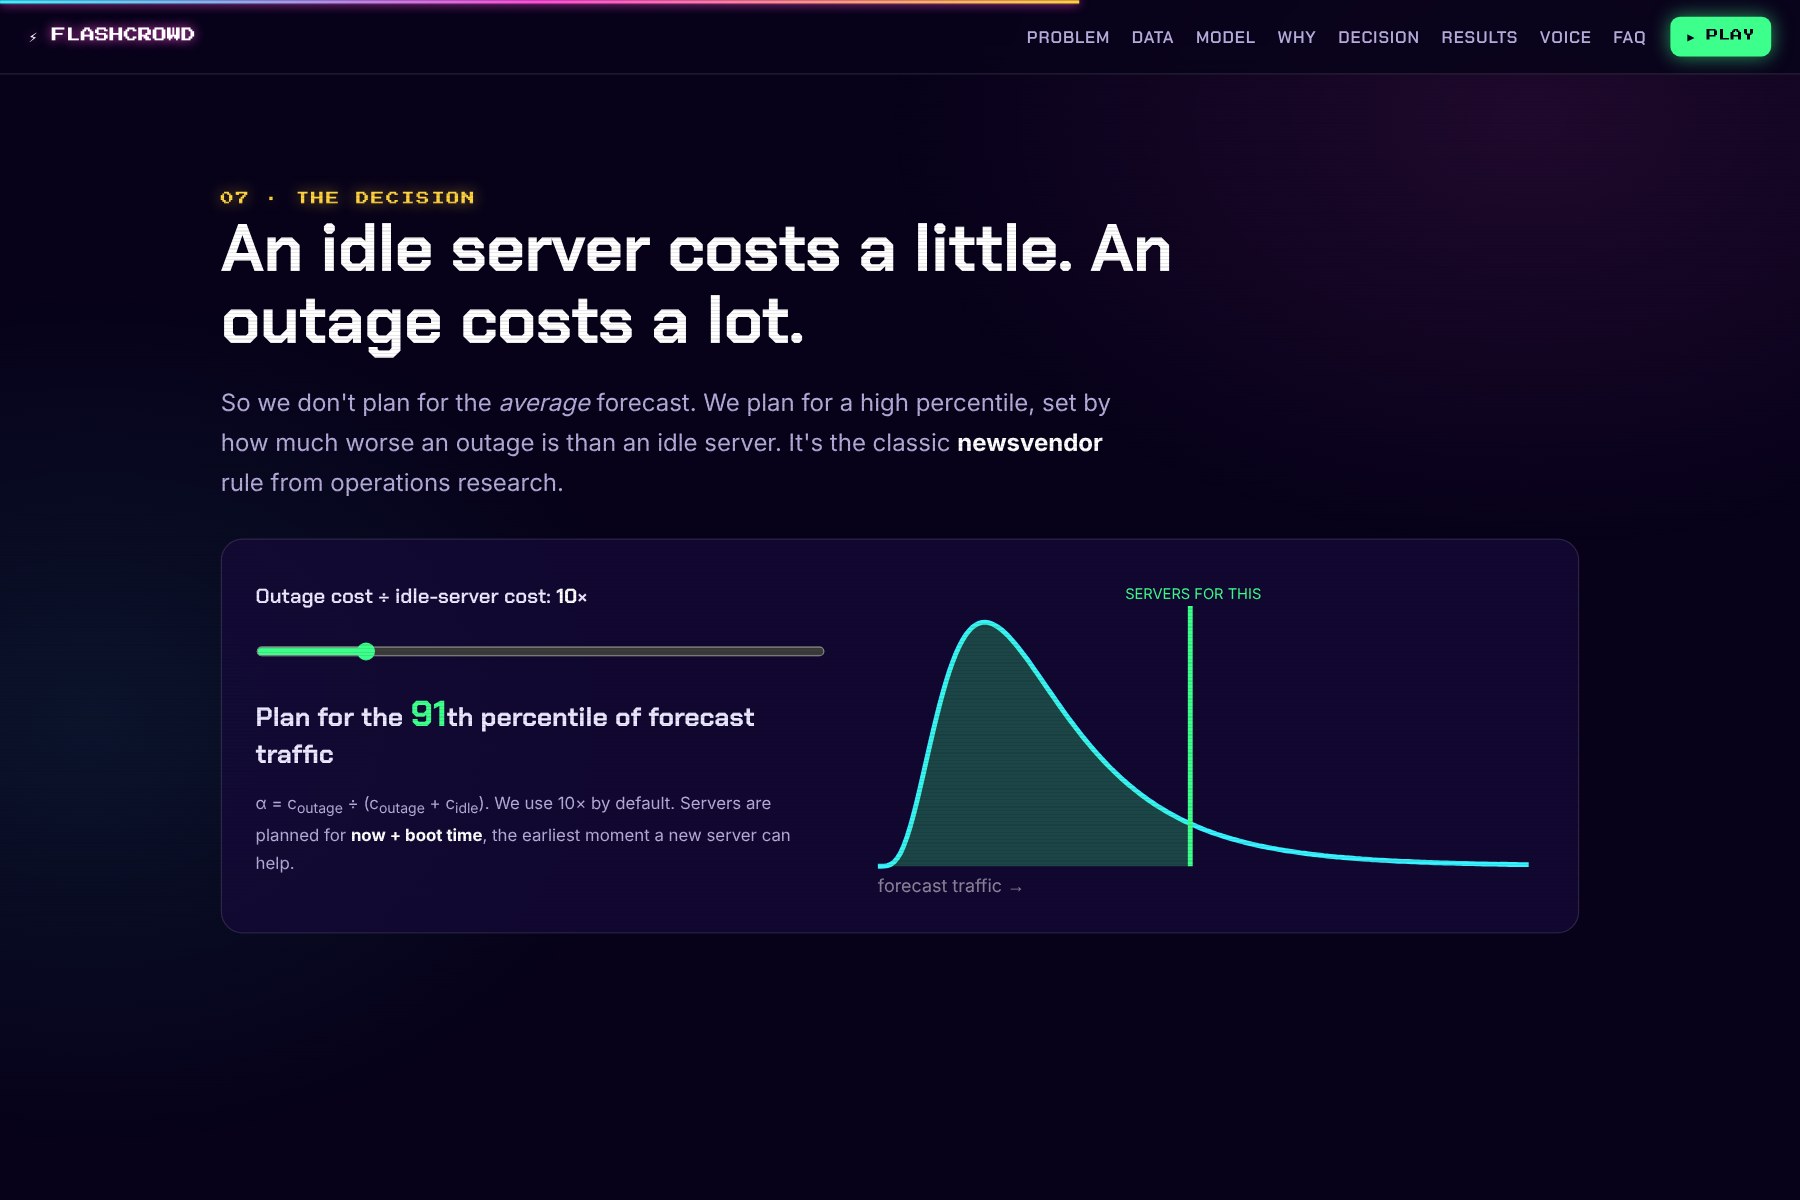
The decision: an idle server costs a little and an outage costs a lot, so we don't plan for the average forecast. We plan for a high percentile using the newsvendor rule:
$$ \alpha \;=\; \frac{c_{\text{outage}}}{c_{\text{outage}} + c_{\text{idle}}}, \qquad \kappa = \frac{c_{\text{outage}}}{c_{\text{idle}}} = 10 \;\Rightarrow\; \alpha \approx 0.91 $$
Servers are planned for time \( t + B_r \), where \( B_r \) is the measured boot time in region \( r \): the earliest moment a new server can help.
Results (honest ones)
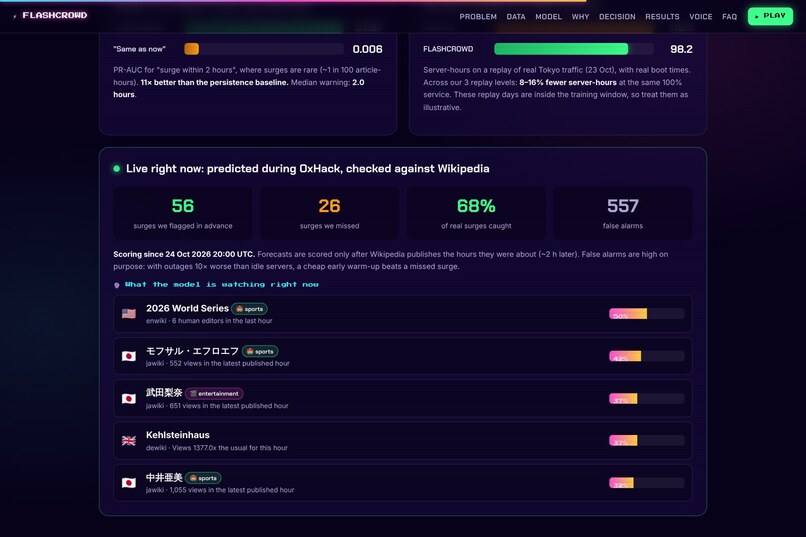
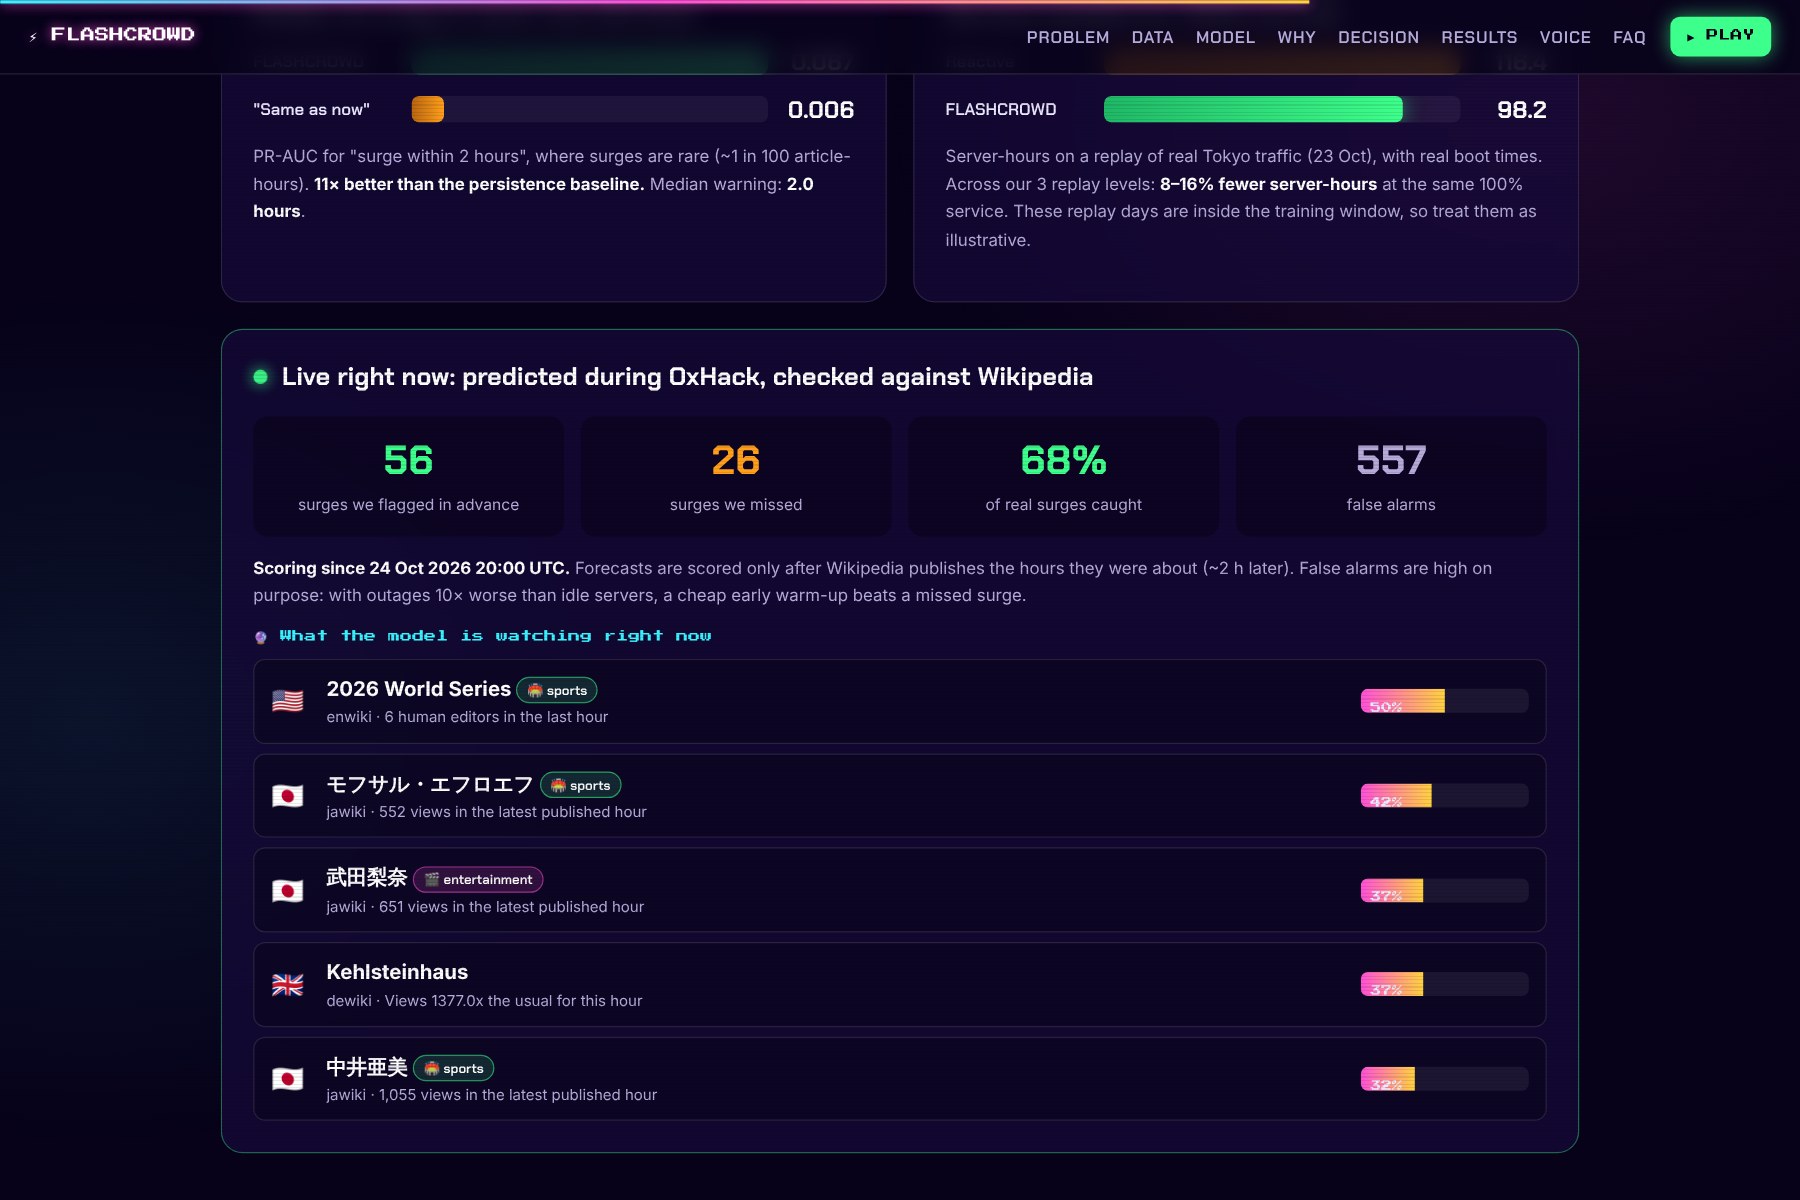
- Held-out day (24 Oct): PR-AUC for "surge within 2 h" is 0.067, against 0.006 for "assume nothing changes". That's 11× better, with a 2.0 h median warning. Surges are rare (about 1 in 100 article-hours), so this is a hard metric.
- Replays of real days with measured boot times: 100% of requests served using 8–16% fewer server-hours than a reactive autoscaler. These days are inside the training window, so we label them as illustrative.
- Live during OxHack: most real surges were flagged in advance, along with many false alarms. That is on purpose: when an outage costs 10× an idle server, a cheap early warm-up beats a missed surge.
Challenges we ran into
- Not cheating with the future. Page views are published about two hours late, so a careless model looks brilliant and is useless. We used as-of joins on the real publication time, an automatic leak test that changes all data after each decision time and confirms no feature moves (it passed on 665,351 decision rows), and a test split by time.
- We caught our own bug. At 20:10 on Saturday, traffic doubled in every region at once, which real traffic doesn't do. Two loaders had loaded the same five hours twice. We removed the duplicates, made the loader unable to repeat it, retrained, and threw away the flattering first results.
- An AI feature that didn't help. The Snowflake + Gemini cause labels separate bursts sharply: 53.5% of breaking-news bursts surged within 3 hours, against 0.4% of vandalism bursts. But as model features they didn't raise accuracy: cross-validation PR-AUC was 0.110 without them and 0.109 with them. The model had already learned it from revert and bot signals (it raised only 2 alerts on 245 vandalism bursts). So cross-validation kept them out, and we use them to explain alerts to humans instead.
- Matching units across the team. Article forecasts, region traffic and simulator demand had to share one definition before the pieces fitted together.
- Platform limits. Snowflake trial accounts block most Cortex AI functions (
AI_SUMMARIZE_AGGstill works), and the ElevenLabs Music API is paid-only, so the adaptive soundtrack is built from looping sound-effect layers instead. Browsers only allow microphone access over HTTPS, so the voice agent needed a Let's Encrypt certificate on our server.
What we learned
- The hard part of prediction is time: knowing exactly what was known at each moment, not just what happened.
- A model is only half the system; the decision rule (how sure you need to be, and what each kind of error costs) matters just as much.
- Measure, don't assume. Boot time, capacity and latency from real servers changed our design.
- Honest negative results (an AI feature that didn't help, replays labelled in-sample) build more trust than a perfect-looking chart.
What's next
- More history (weeks, not days) so cause labels have enough examples to help the model.
- A cause-aware decision rule: warm up harder for breaking news, ignore vandalism.
- Cross-language signals (the same story breaking on several wikis at once).
- Longer, realistic boot times (containers, caches, GPUs), where a 1–3 hour warning is worth even more.
- Try it on a private traffic source.
Built With
- amazon-ec2
- amazon-web-services
- elevenlabs
- fastapi
- git
- google-gemini
- gsap
- html5
- javascript
- lets-encrypt
- lightgbm
- nginx
- pandas
- playwright
- python
- scikit-learn
- snowflake
- snowflake-cortex
- systemd
- uvicorn
- vite
- web-audio-api
- websockets
- wikimedia-eventstreams
- wikipedia-api


Log in or sign up for Devpost to join the conversation.