Inspiration💡
California's natural beauty is juxtaposed with its susceptibility to wildfires, a recurring environmental challenge that has gained considerable attention in recent years. Some of the factors attributed to this include:
- Climate Factors: The Mediterranean climate prevalent in much of California features hot, dry summers and mild, wet winters. This creates ideal conditions for the ignition and spread of wildfires. 2.Drought: Drier conditions also lead to reduced moisture content in soil and plants. Santa Ana Winds: These strong, dry winds originating from the desert can fan the flames of wildfires, causing rapid and unpredictable spread.
- Human Activity: Many wildfires are sparked by human activities, including power lines, discarded cigarettes, campfires, and equipment use. Accidental or intentional ignitions contribute to fire incidents.
For these reasons, we have found that wildfires in California are severe and happen usually which has affected people's lives for several years, so we have developed this routing application that can visualize the routes and has capabilities to calculate the best routes between different locations, considering factors such as distance, travel time, traffic conditions, and more. Moreover, this platform helps us to analyze the effect of wildfire and the distribution of particulate chemicals from the combustion, which can harm people's health.
What it does⚙️
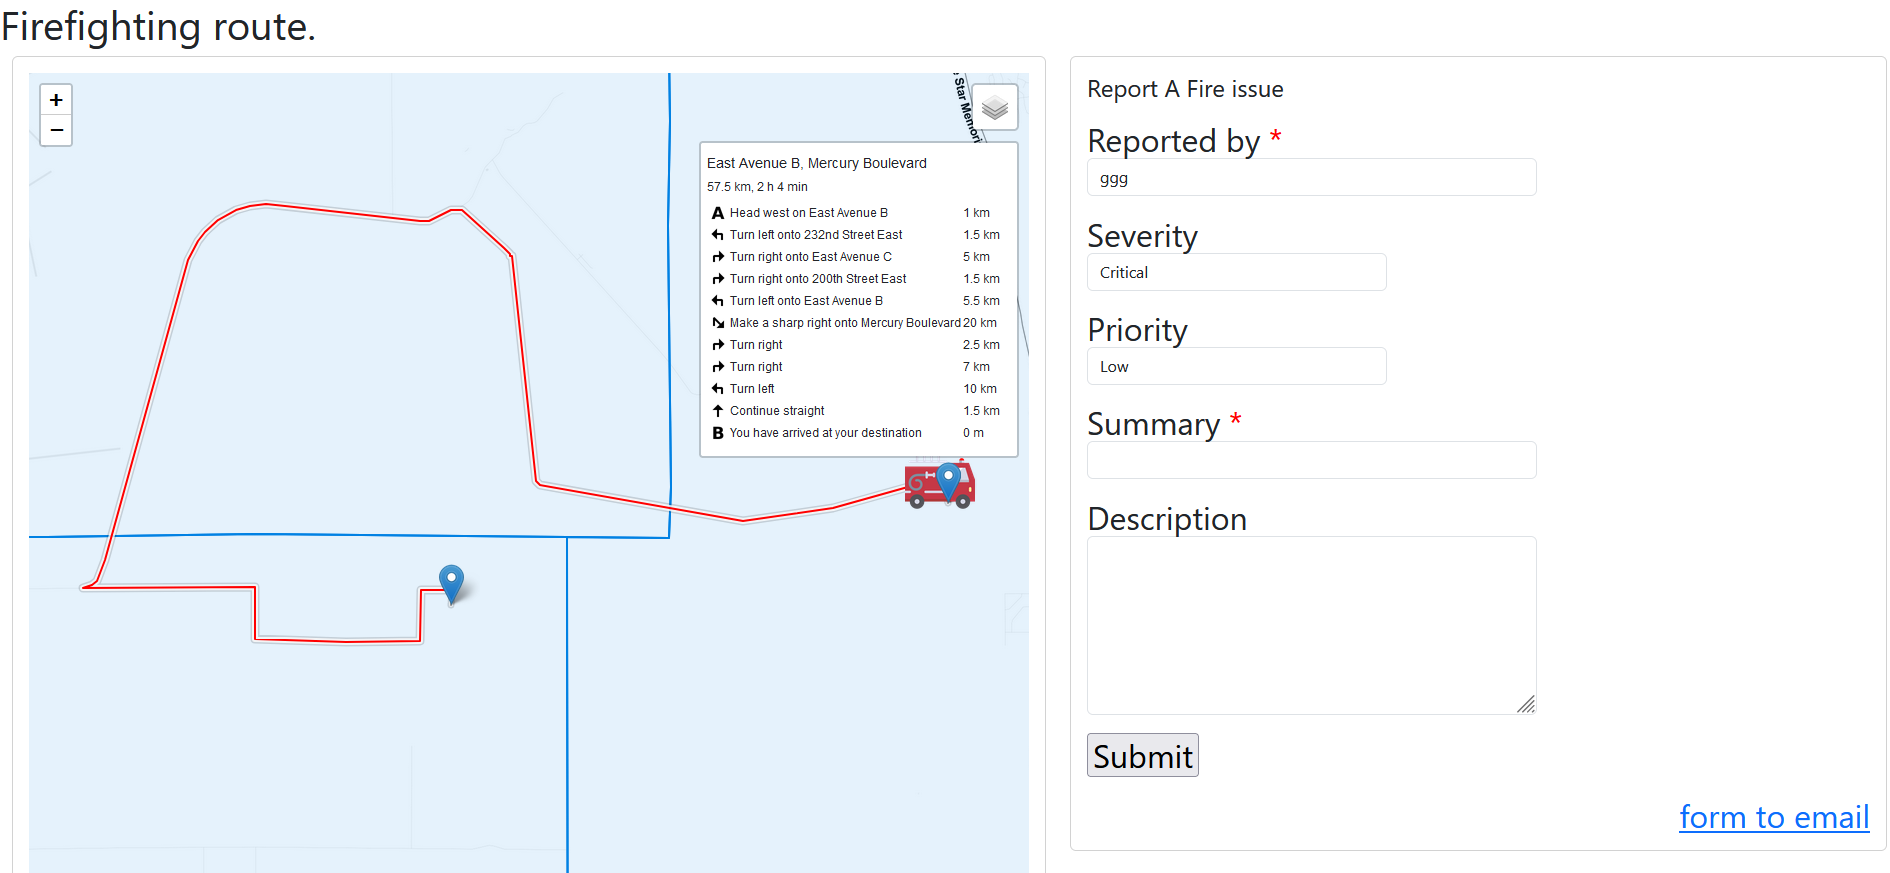
This platform is designed to simplify and optimize the process of routing and navigation within geographic information systems (GIS) with JavaScript and HTML. It offers It allows firefighters and local people to find possible the best routes and calculate distances between hospital, fire station and fire hotspots, considering factors such as distance, travel time, traffic conditions, and more.
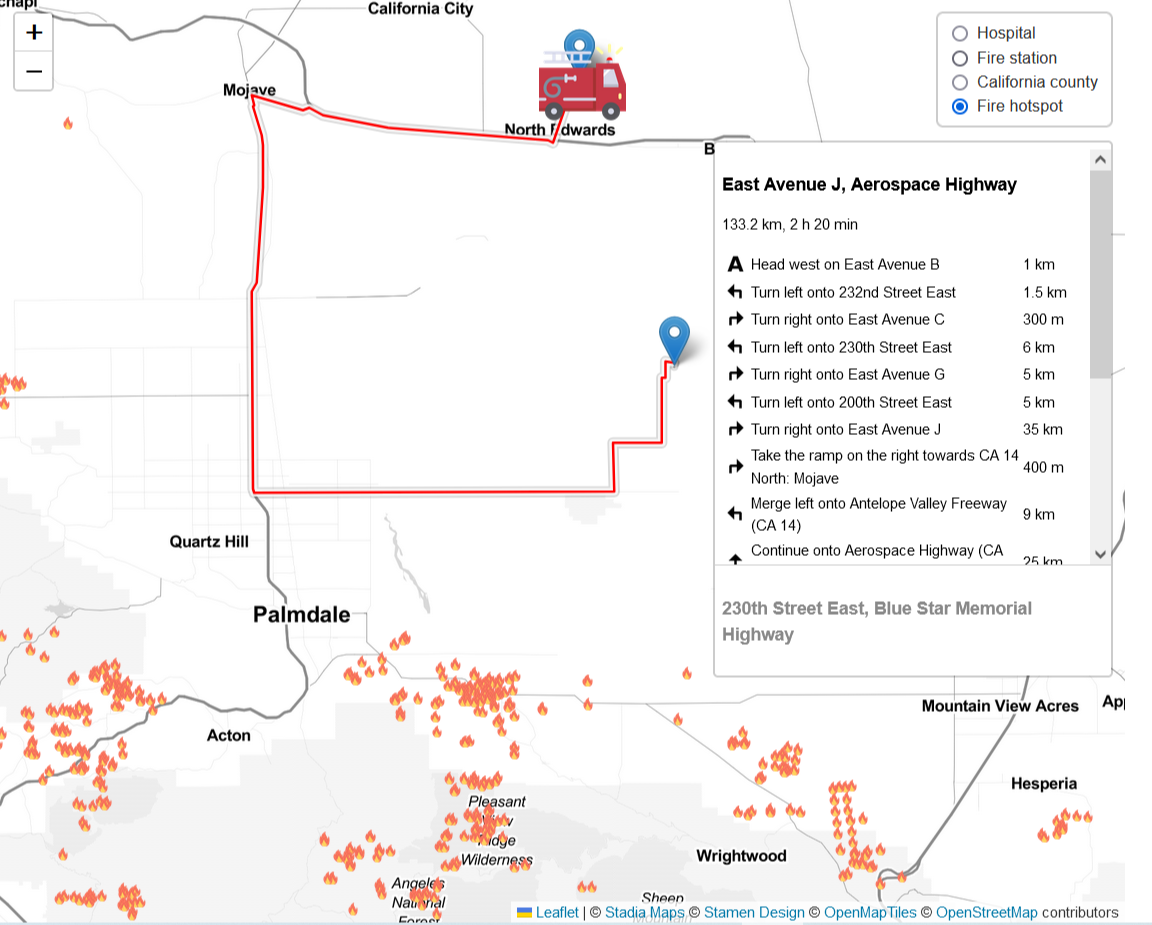
The application allows users to identify the start and the end locations (fire station to fire events) and also can define the third location as a hospital. And users also can explore the statistics of gasses in the study area from our dashboard analytics.
Our innovation aims to
- Facilitate fire departments and local people in California to investigate the route and estimate the distance from fire stations to fire locations.
- Plan and transfer victims to hospitals nearby in a timely manner.
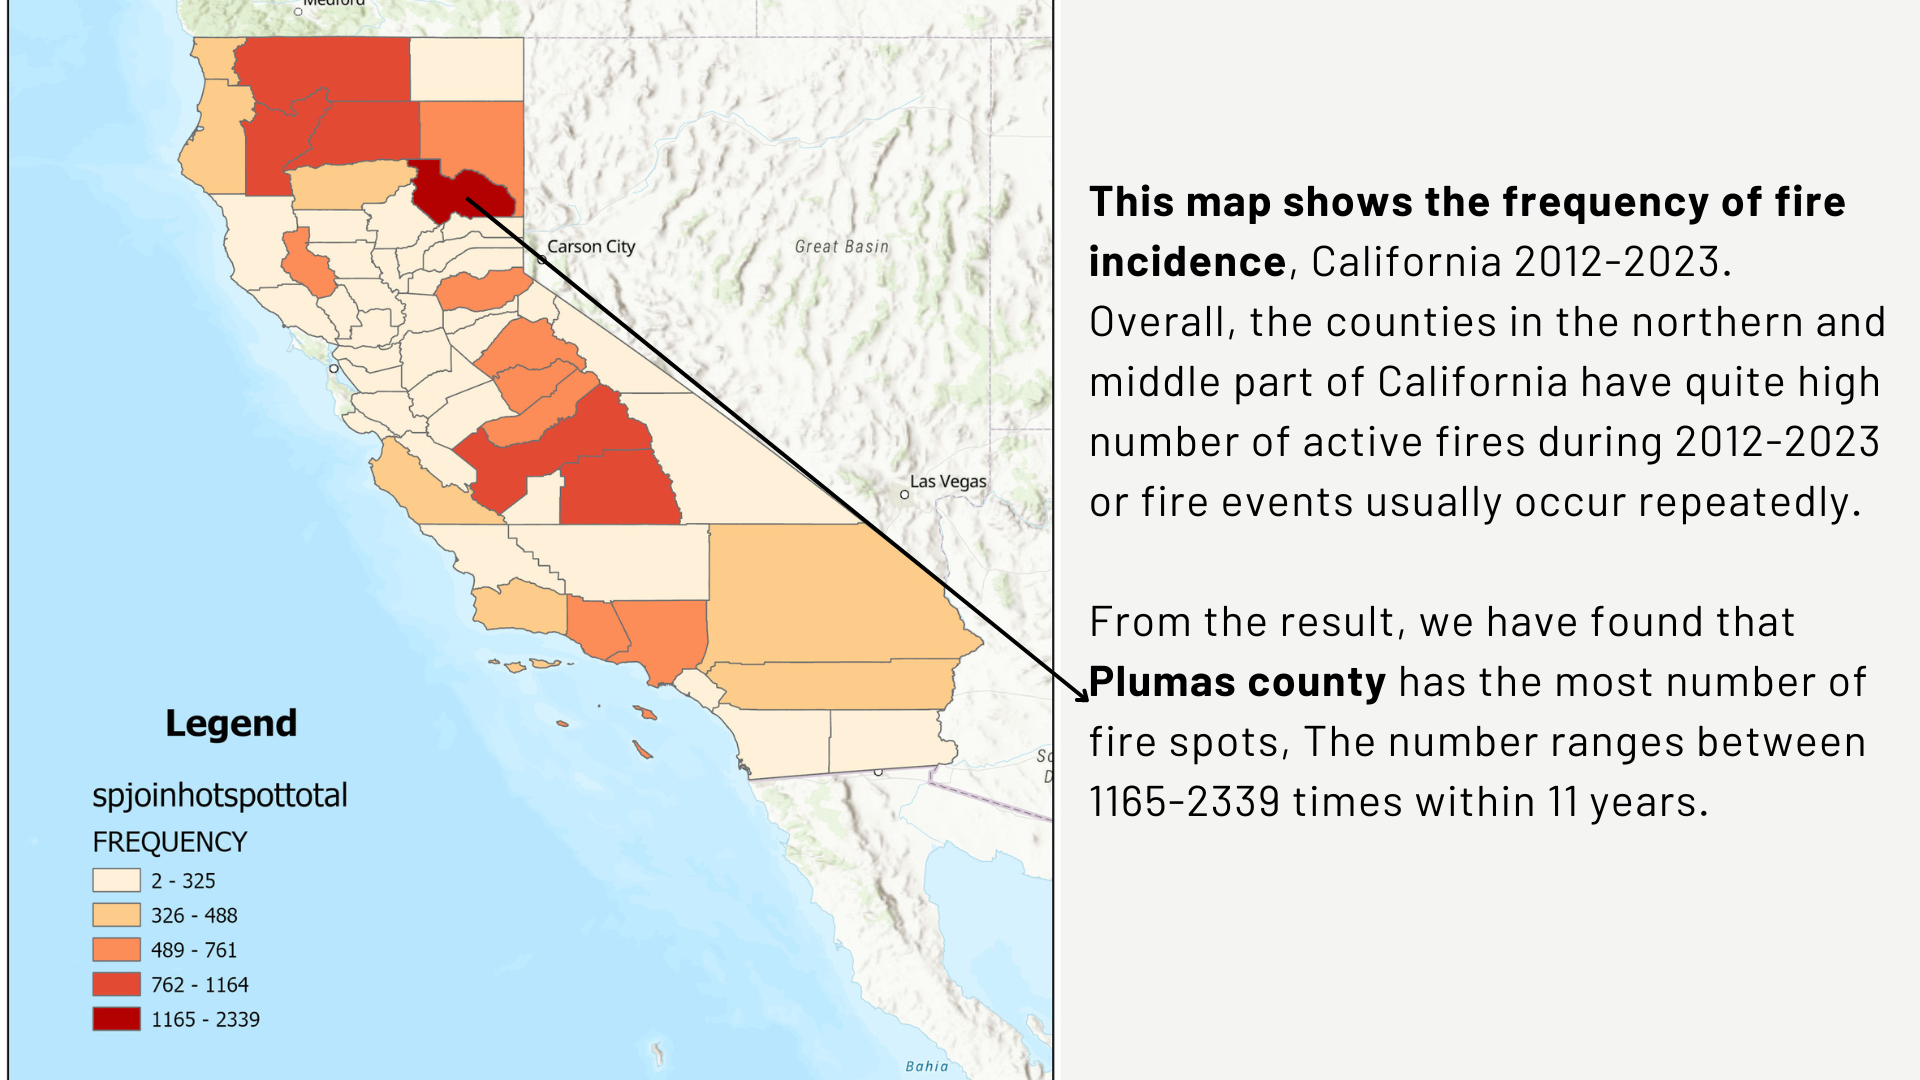
- Analyze the severity of fire events such as hotspot locations and number of active fires.
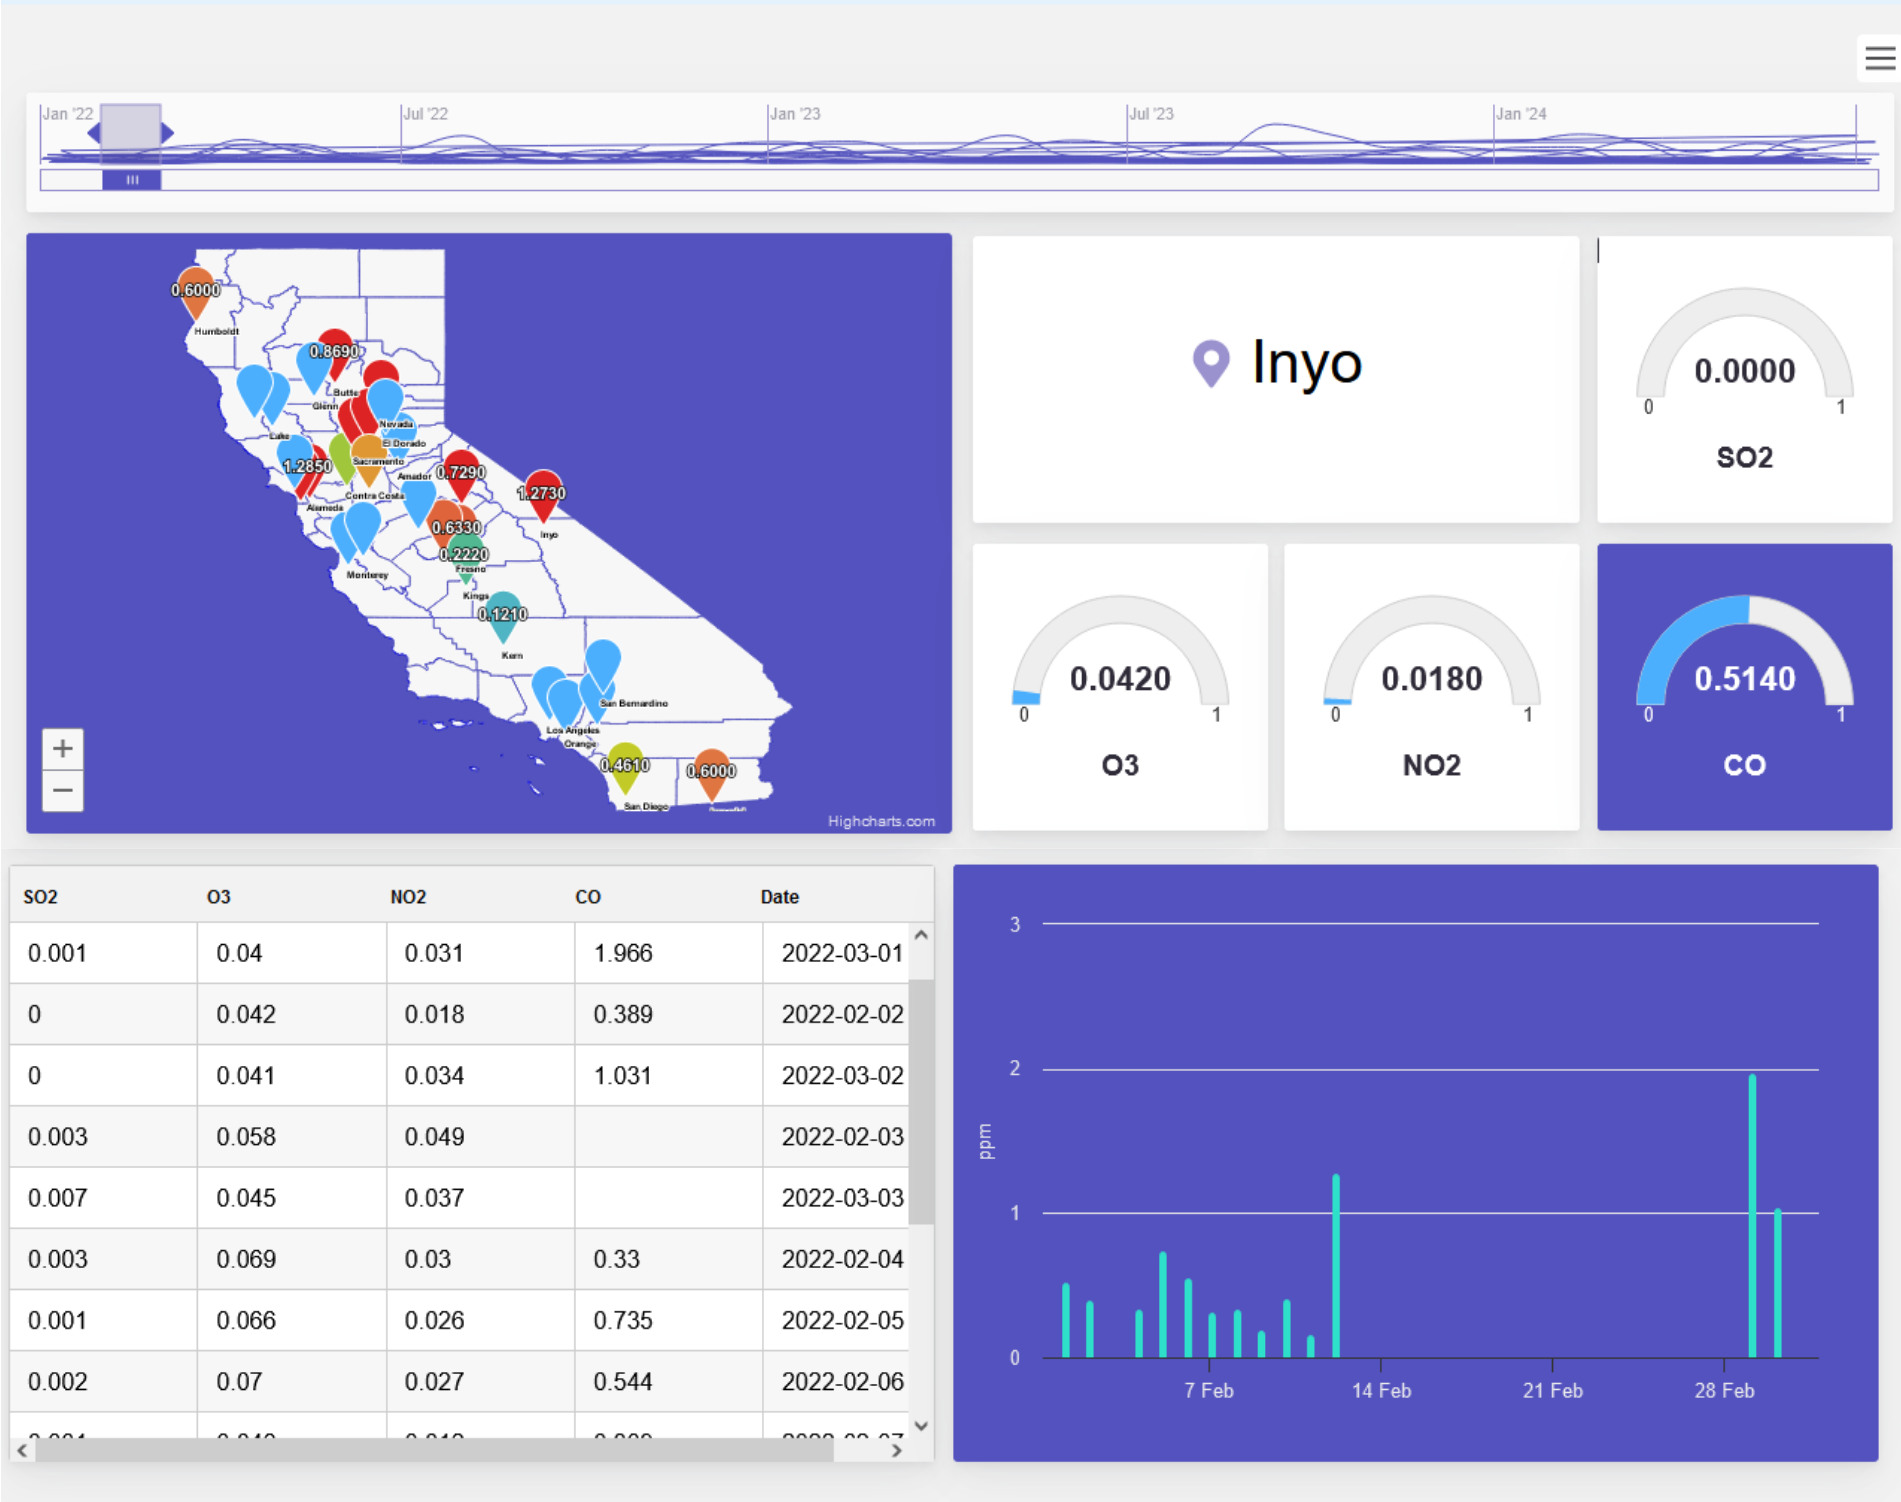
- Present the chemical gasses from the combustion in California as time-series and spatial data then visualize them in Dashboard.
How we built it🛠️
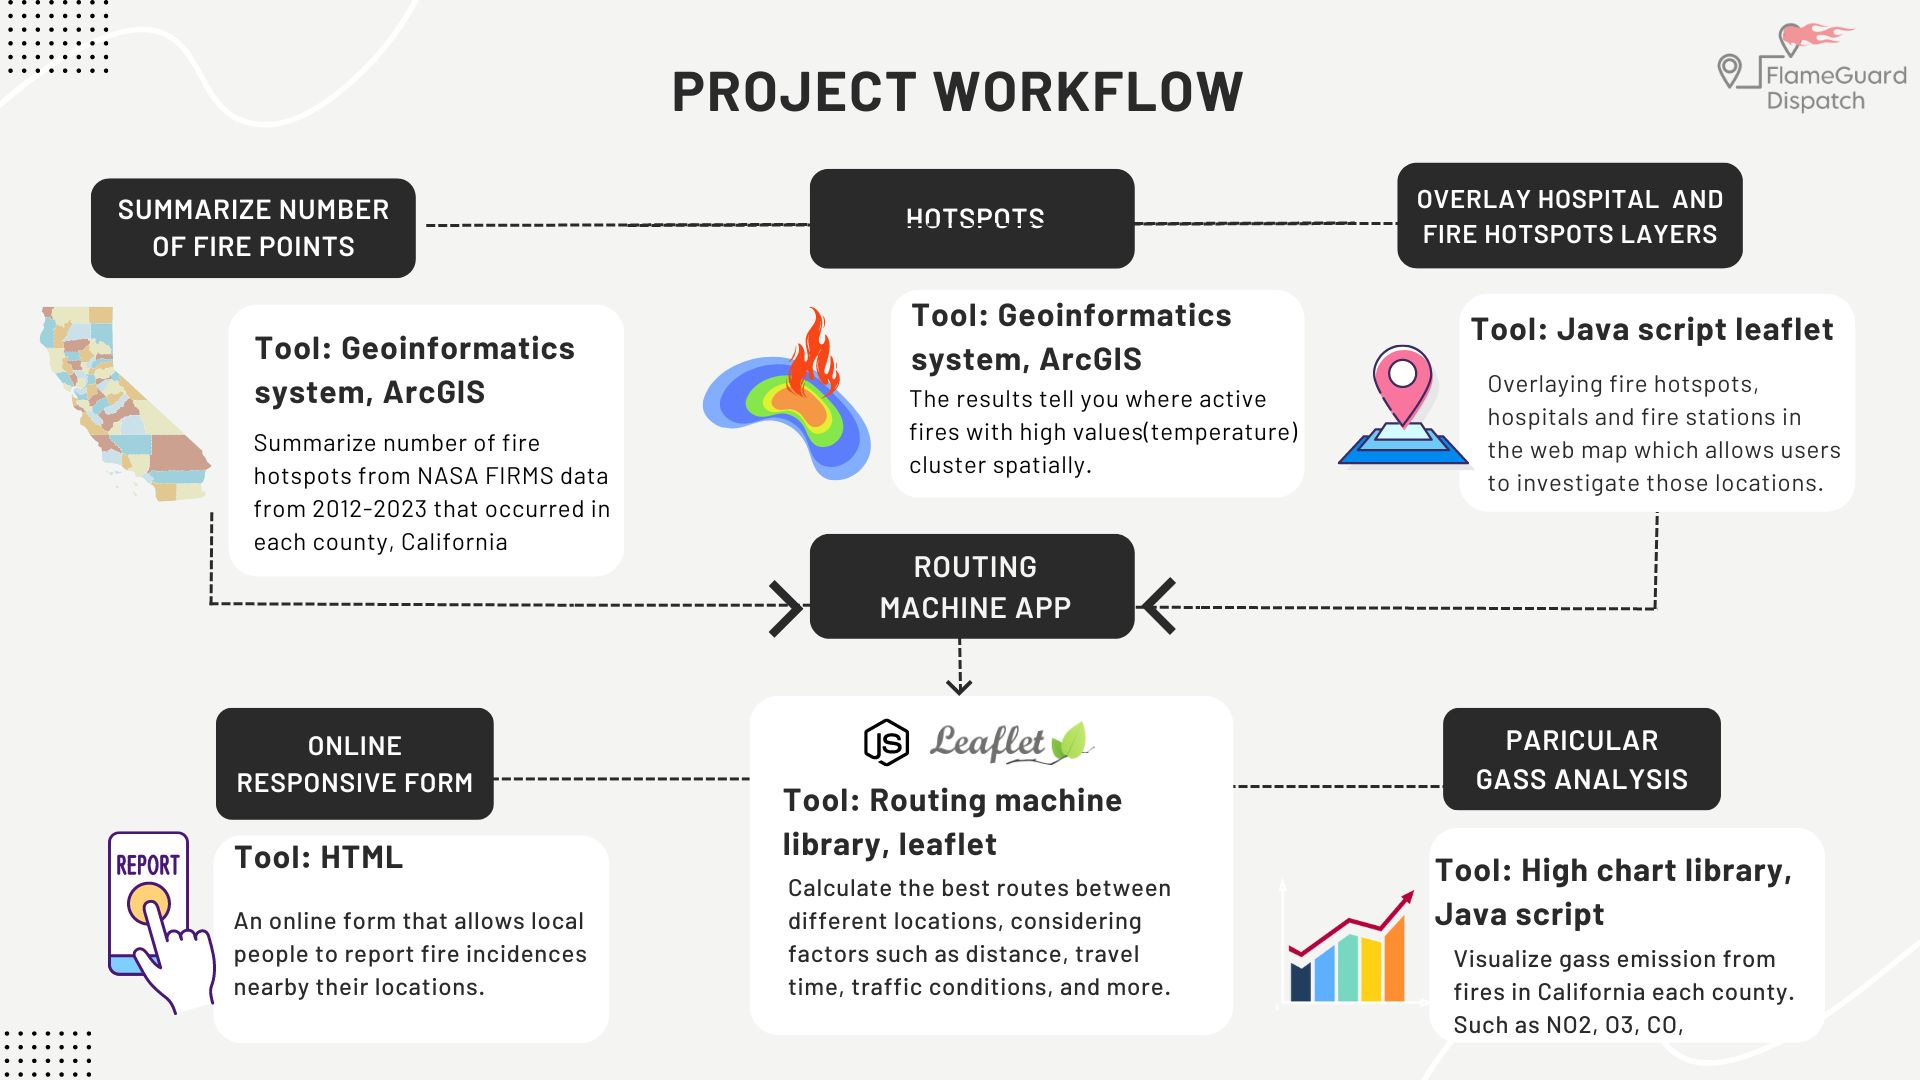
This project is built by using JavaScript to create the web map using Leaflet library and HTML to show the shortest route between locations and HighCharts library to develop an interactive dashboard of particulate gasses such as NO2, Ozone. Moreover, we performed spatial analysis by using GIS tools in order to get the results of hotspot locations. This platform , we utilized or downloaded all datasets from open-source websites such as California government website and NASA-FIRMS.
Challenges we ran into⌛
- There are many lines of GeoJson format so when we added it into our script, it took times.
- Many fire points from 2012-2023 so we needed to aggregate them all into 1 attribute in order to do a hotspot analysis of 11 years
- The dataset of Chemical gas from open sources is available only daily so we have to visualize them daily instead of yearly(2012-2023).
- The dataset of Chemical gas from open sourecs are stored as 1 year/gas/county so it is quiet hard to download a bunch of data then we selected only year 2022.
- We could only deploy our web application locally at the moment.
- It took some time to do our data preparation since we have data formats shapefile, csv and geoJson.
- There is a difficulty in setting geoJson marker styles.
- The version of Leaflet that can support routing function are quiet old. So, we have to use plain JavaScript.
Accomplishments that we're proud of👏
There are 3 steps of our methods: Firstly, Performing spatial problem analysis using Geoinformatics tools. Secondly, Creating an emergency route application using Javascript and HTML. And developing dashboard that visualize the number of gas emission each county in California.
Utilizing a leaflet Javascript to create an application that can deal with real events. Trying to use new libraries such as HighCharts. Managed to fix the issue that was found on the code in time. Fixed the problems about visualizing the layers because we have multiple lines of code so it was difficult to manage but we could fix it finally.
Overall, we integrate the knowledge in the fields of Geoinformatics, earth observation and computer science altogether in these3 phases.
What we learned✏️
- Learning how to develop an interactive dashboard from JavaScript.
- Dealing with geospatial datatype such as shapfile and GeoJson in order to work with JavaScript and HTML.
- Learning how to perform data pre-processing of converting shapefile to GeoJson in order to add layers in Javascript.
- Gaining more skills in creating interactive website which integrating Geospatial data.
- Learning how to create webmap with useful leaflet library 'Routing machine'.
- Knowing how to set and manage complicated layers in Javascript language.
What's next for FlameGuardDispatch📈
Next implementation:
- Improve the performance of the web
- Allow users to put location's name
- Develop with real-time data by connecting with our databases. Because the opensource websites that we used, they have updated near-real time data, so it would be really useful to connect API with these datasets to our website.
- Deploy it in public, we can run it locally in the moment.


Log in or sign up for Devpost to join the conversation.