-
-
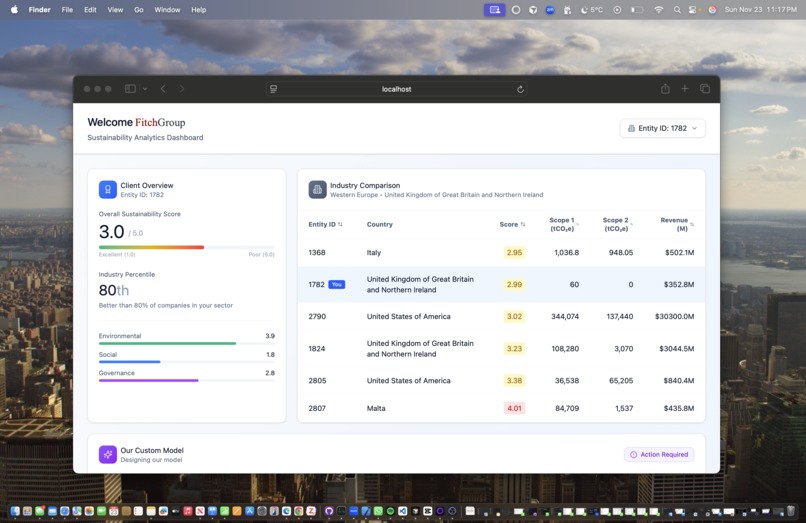
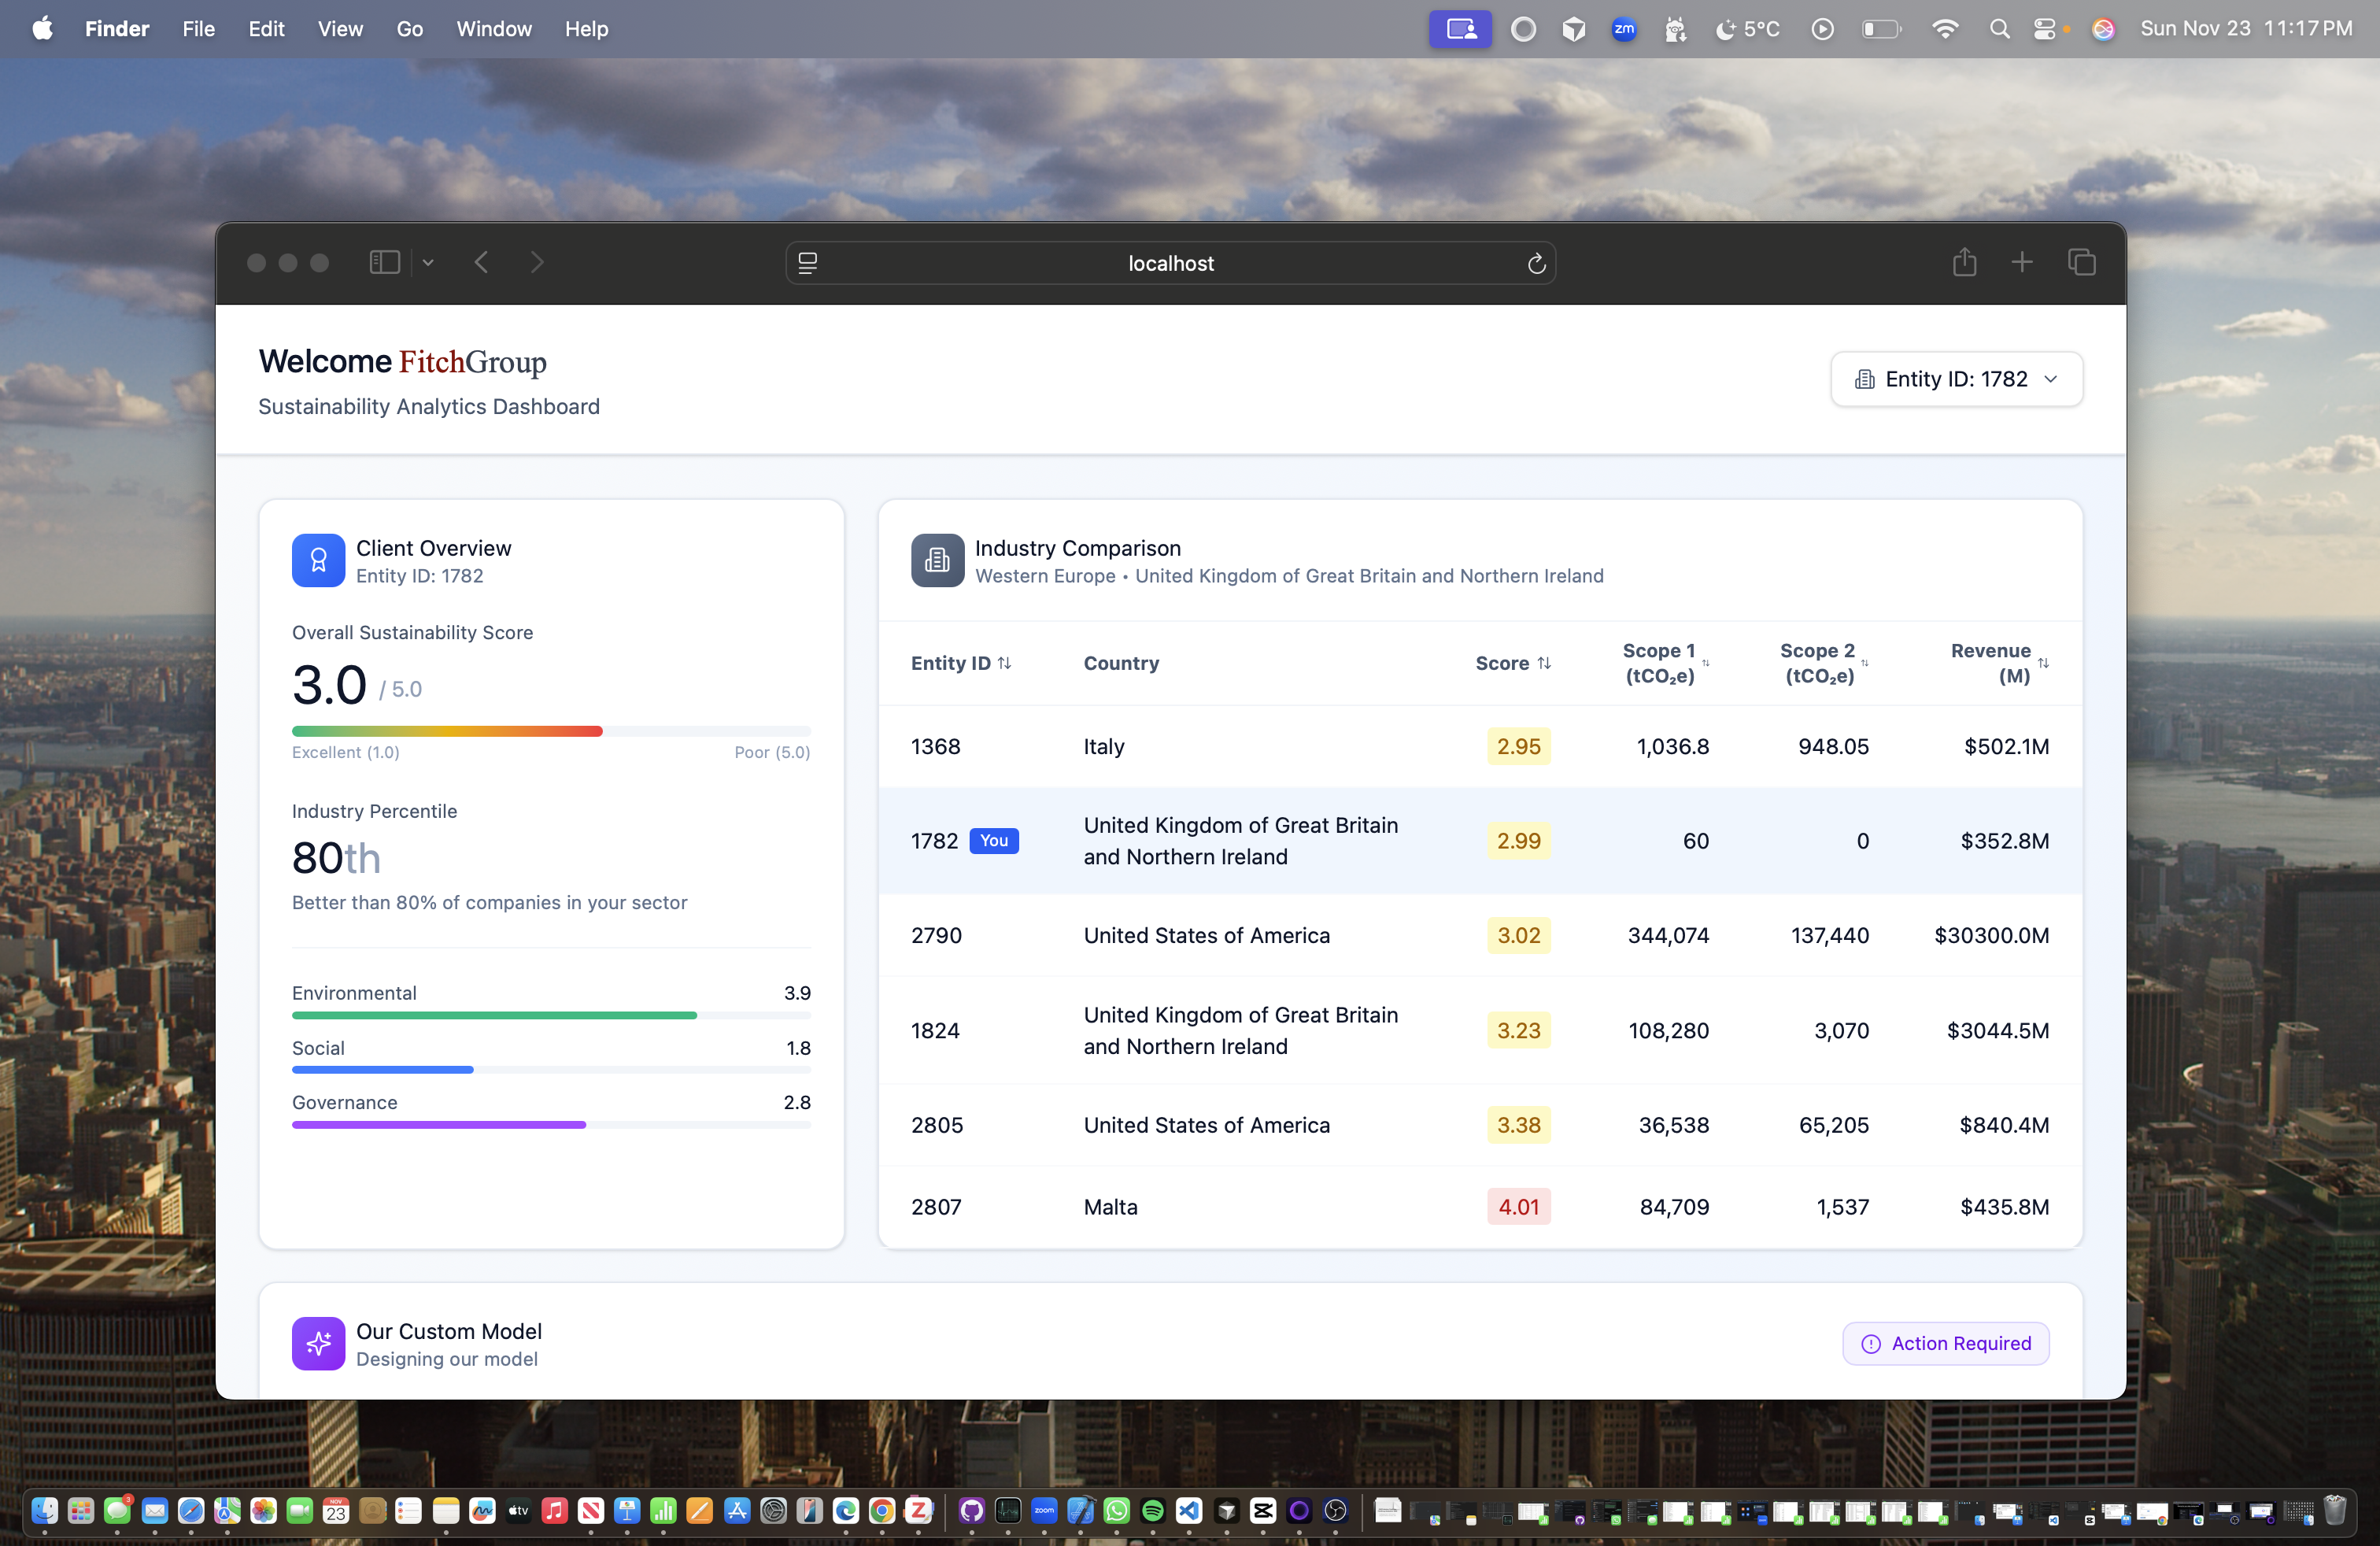
Sustianability Analytics Dashboard
-
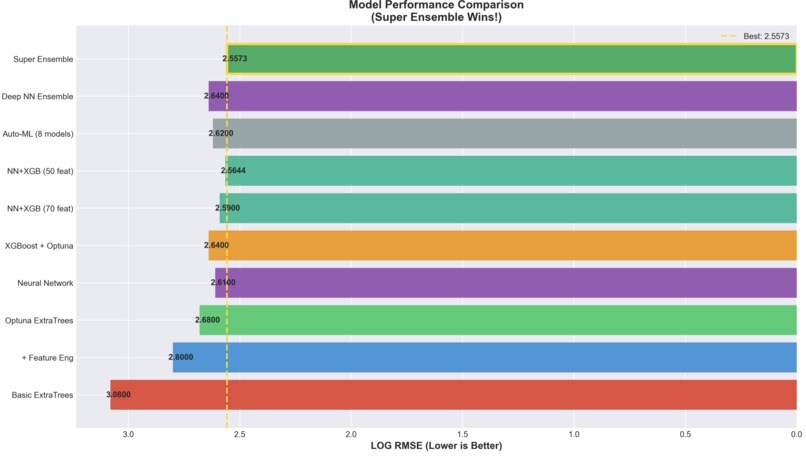
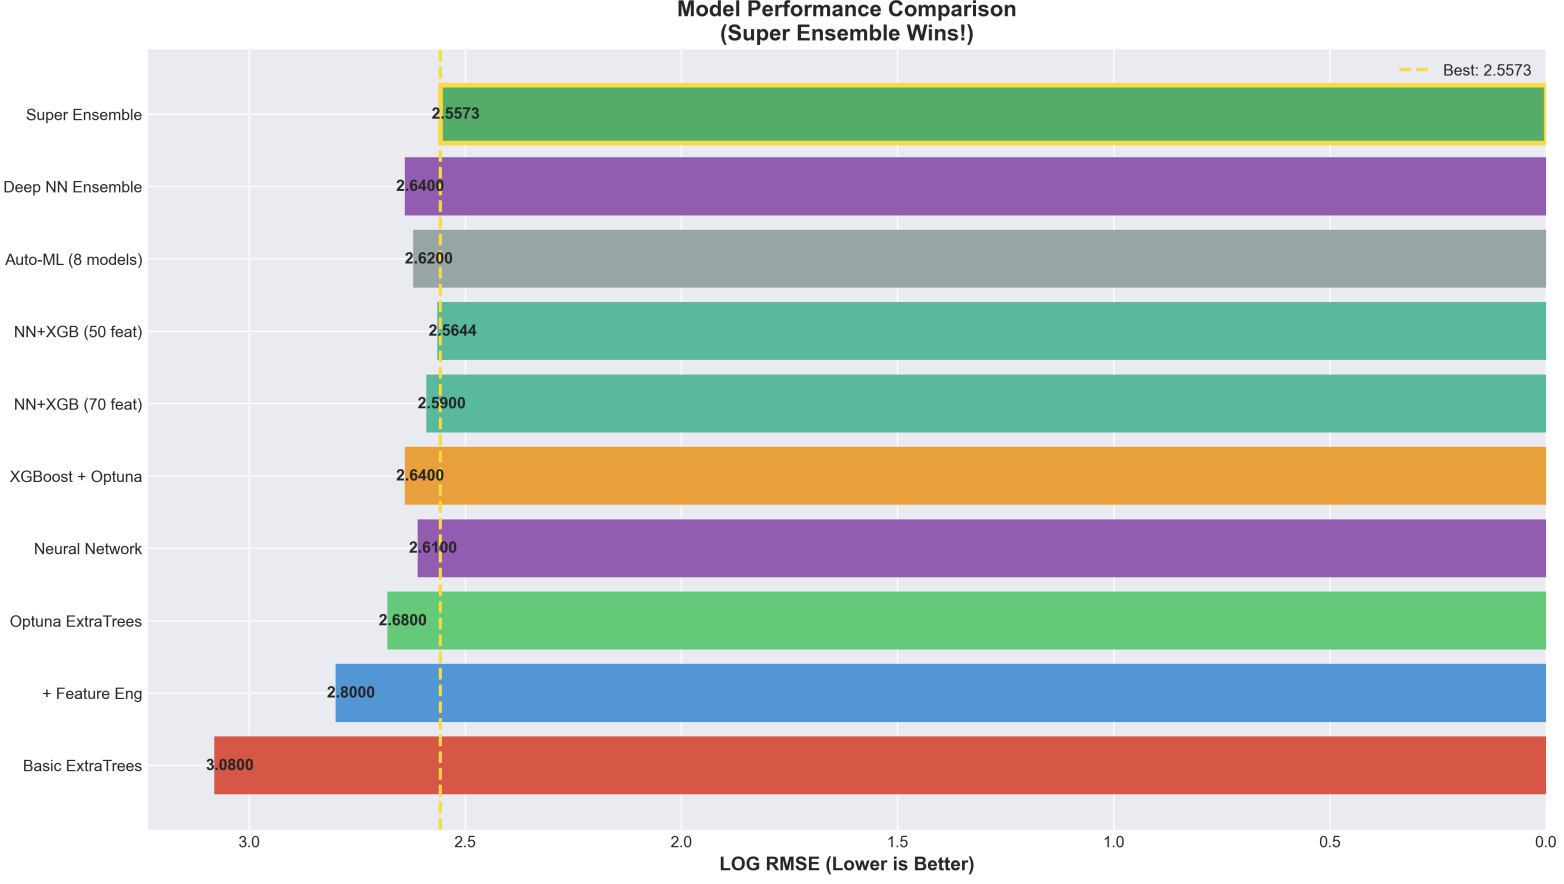
Model Performance Comparison
-
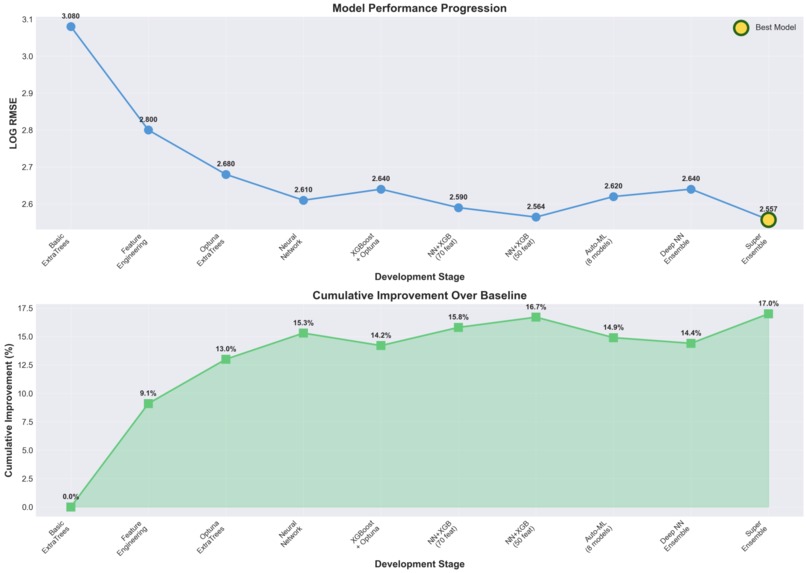
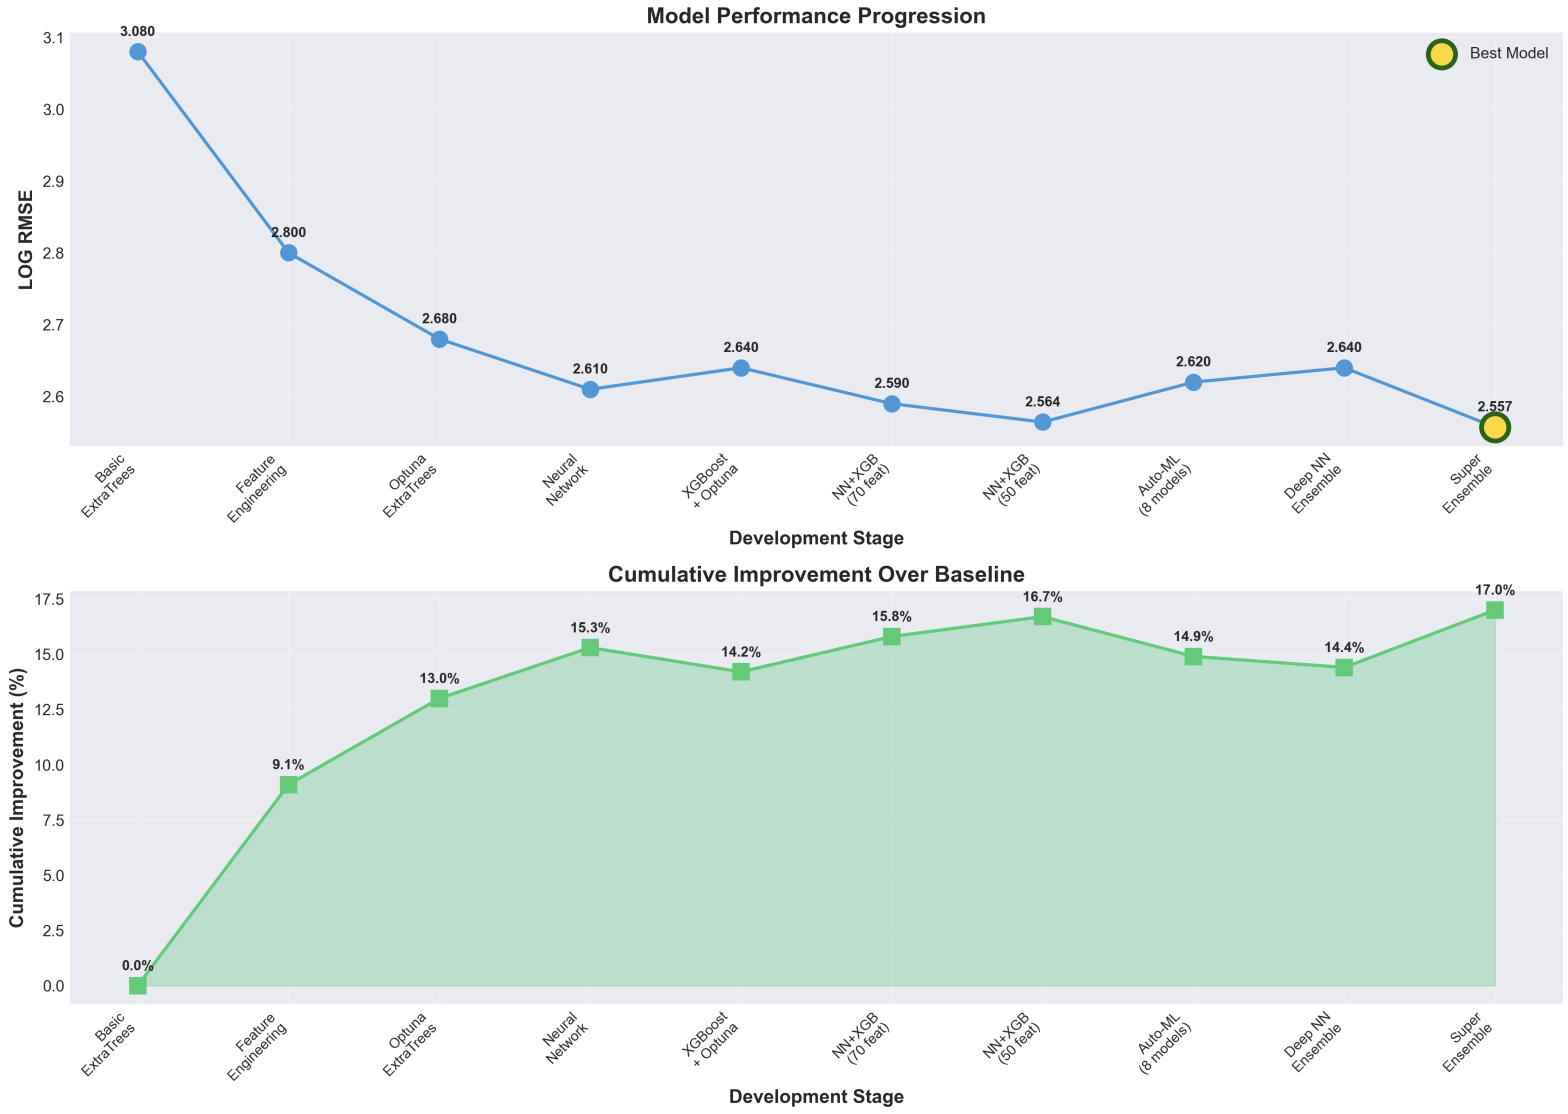
Model Performance Progression
-
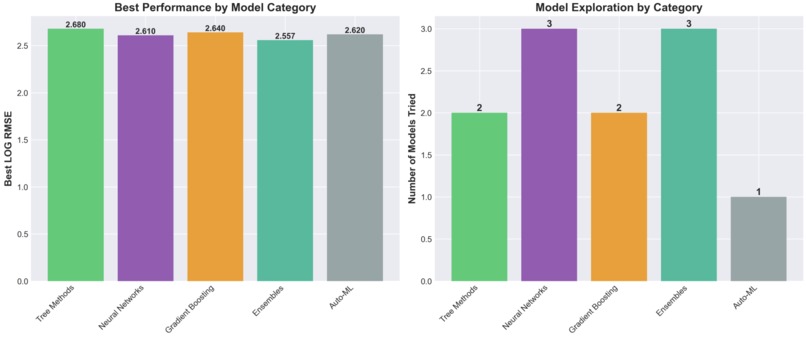
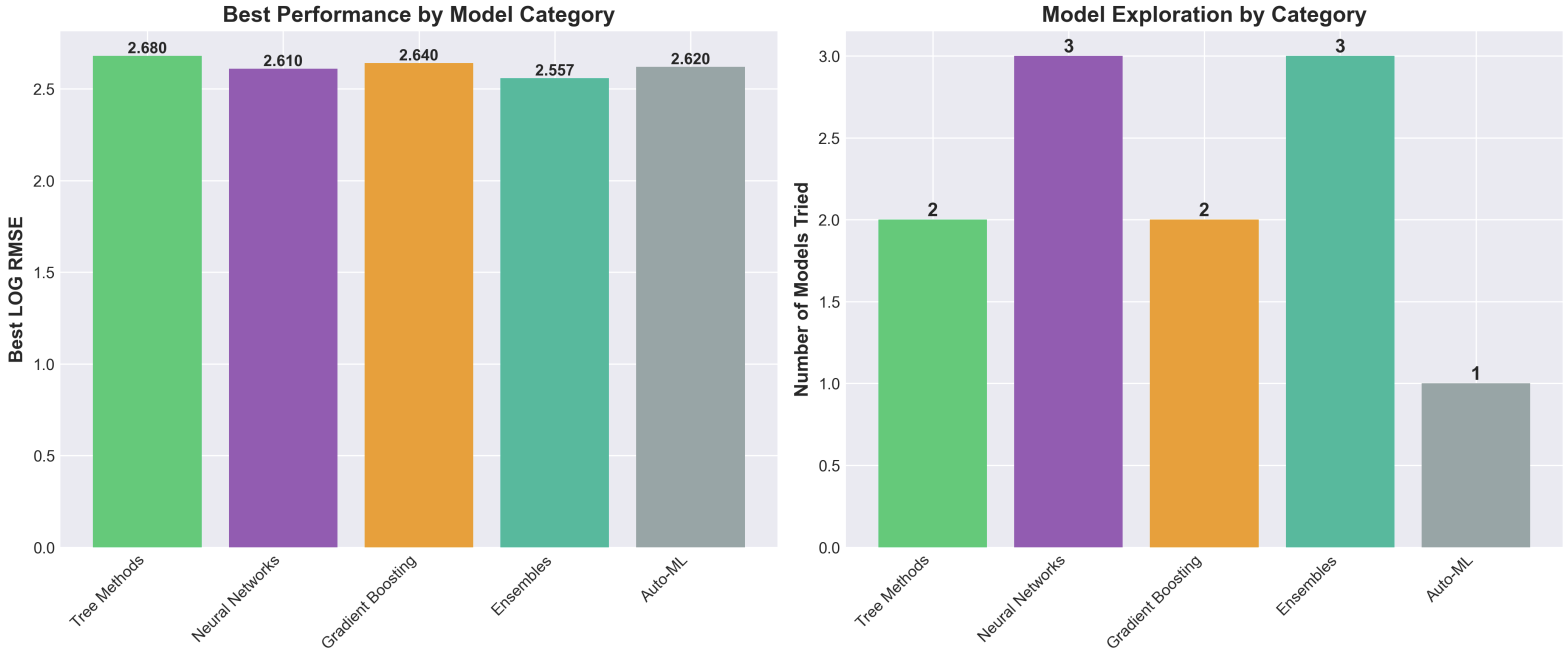
Performance and Exploration
-
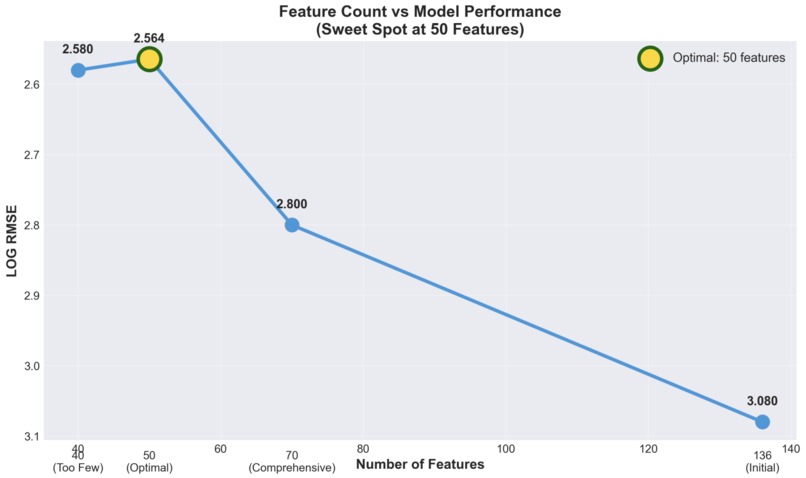
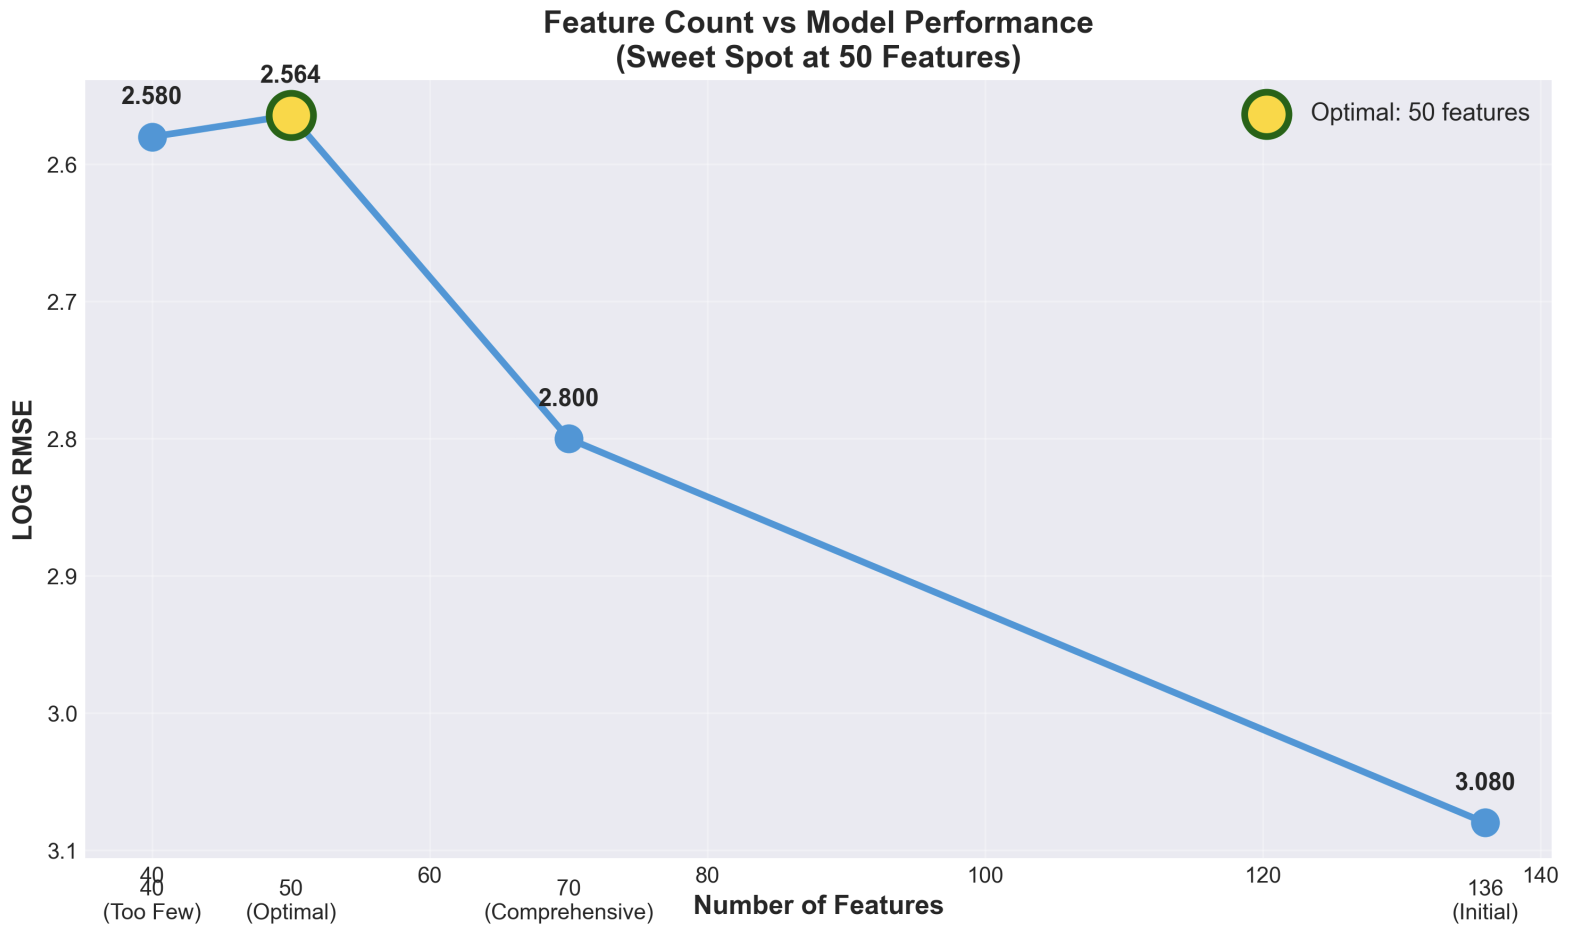
Feature Count vs Model Performance
-

-
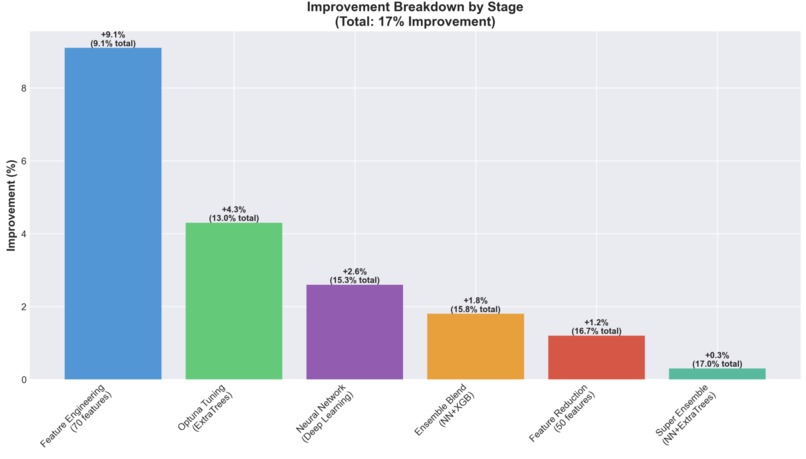
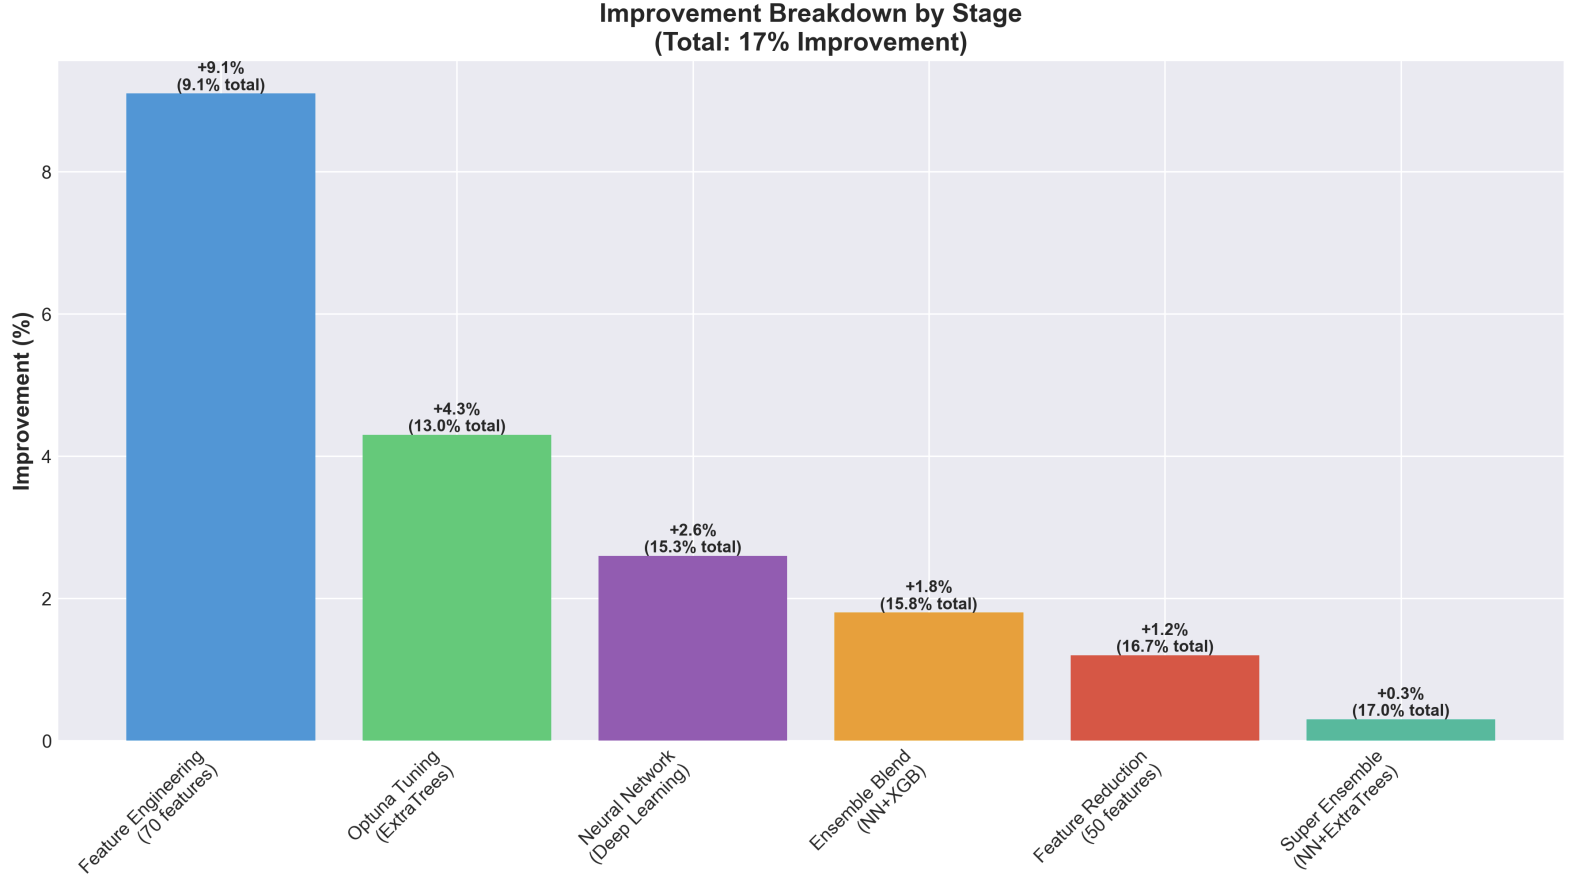
Improvement breakdown by Stage
-
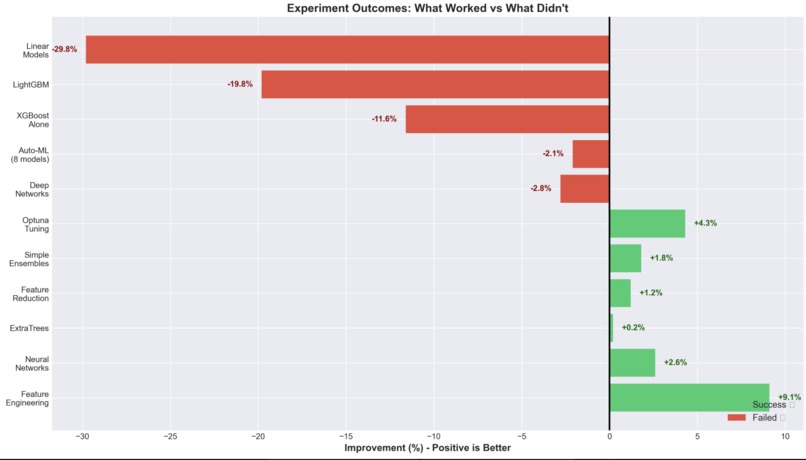
Outcomes
-

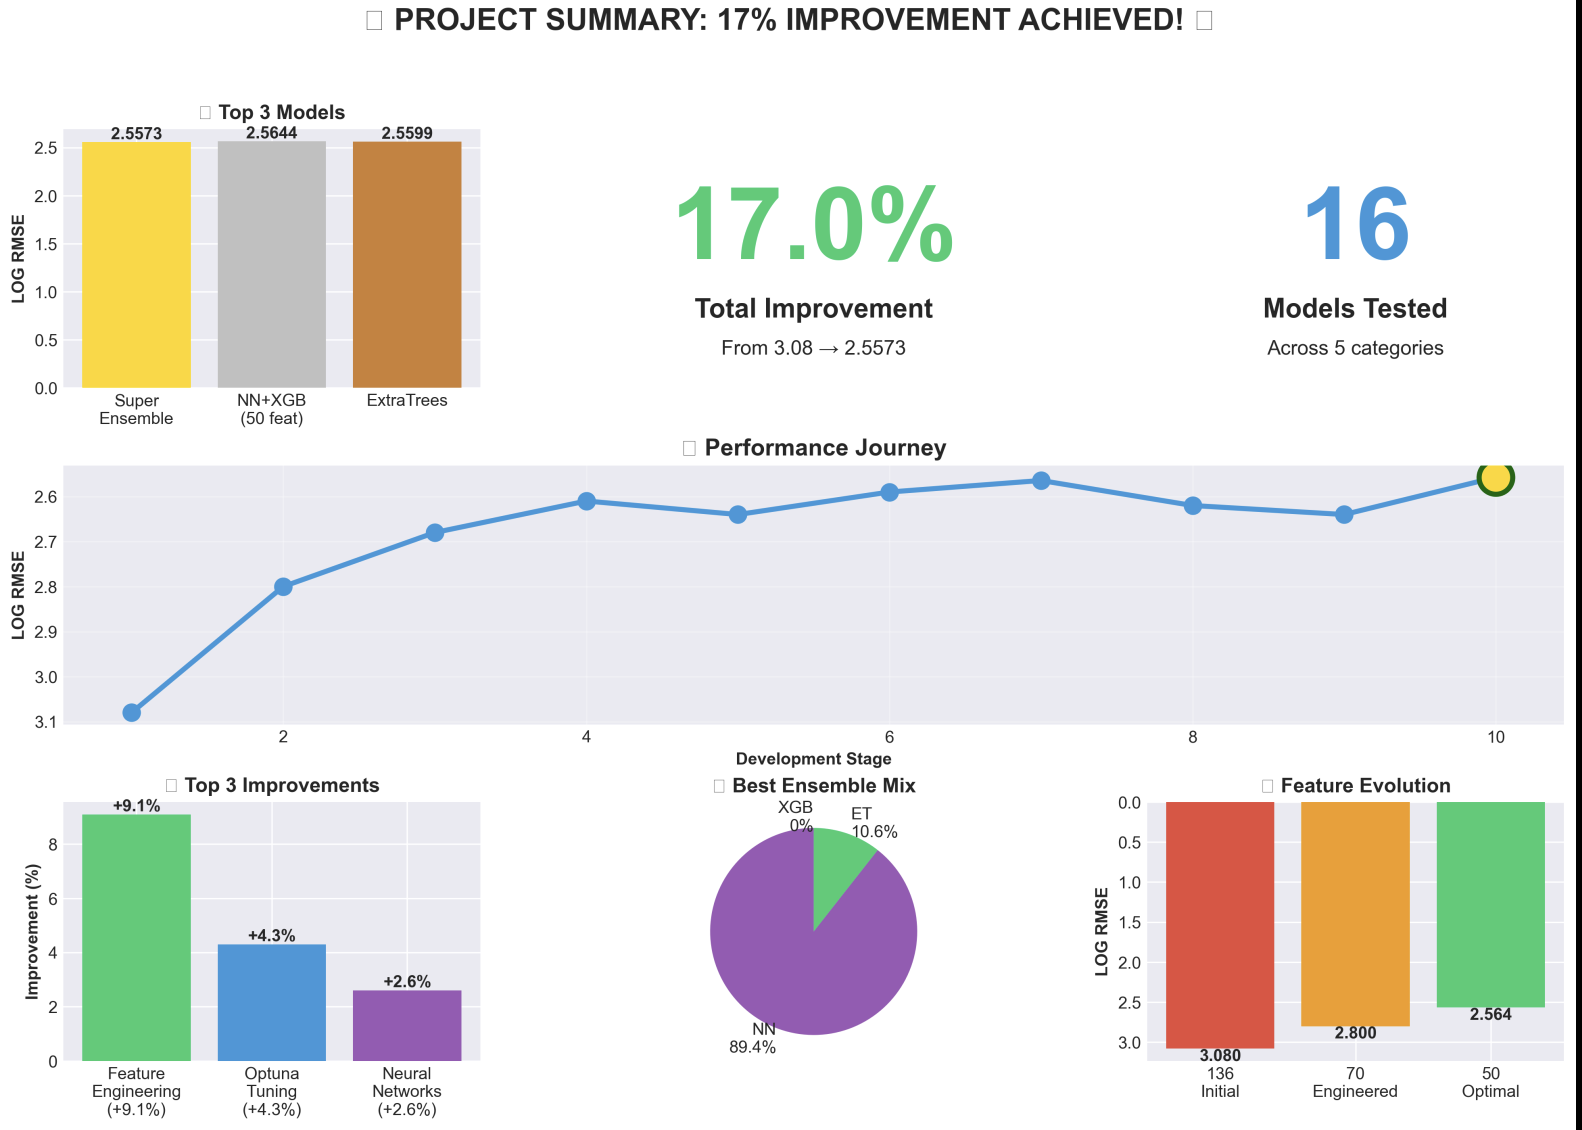
Project Summary

Inspiration
We were inspired by the FitchGroup Codeathon challenge to build a machine learning solution that can predict Scope 1 (direct) and Scope 2 (indirect energy / electric) emissions for companies using the provided datasets by Fitch like ESG scores, revenue, sector distribution, and sustainability commitments. This enables portfolio carbon footprint calculation, credit risk analysis, and helps fill the massive reporting gap in the market.
What it does
Our solution consists of two main components:
Machine Learning Model: An ensemble of gradient boosting models (XGBoost, LightGBM, CatBoost) that predicts GHG emissions with a combined RMSE of ~135,589 tCO₂e. The model uses 87 engineered features including log transformations, country target encoding, sector interactions, and environmental activity indicators.
Interactive Dashboard: A full-stack web application that:
- Displays company sustainability scores and percentile rankings
- Shows industry comparisons and benchmarking
- Visualizes emissions predictions through scatter plots and charts
- Provides AI-powered sustainability recommendations using Google's Gemini API
- Features an AI chat assistant for emissions data analysis and improvement strategies
- Allows real-time exploration of different companies via entity ID selection
The dashboard transforms raw predictions into actionable insights for ESG fund managers, credit rating agencies, and sustainability professionals.
How we built it
Machine Learning Pipeline:
- Feature Engineering: Created 87 features including log transformations (critical for 40% RMSE reduction), country target encoding (12% feature importance), sector aggregations, and interaction features (8% RMSE improvement)
- Model Training: Trained separate models for Scope 1 and Scope 2 using weighted ensemble (40% XGBoost, 35% LightGBM, 25% CatBoost) with heavy regularization to prevent overfitting on the small 429-sample dataset
- Log-Space Training: Transformed targets to log space for training, then inverse-transformed predictions - this was critical for handling the 7 orders of magnitude range (0 to 2M+ tCO₂e)
Backend (FastAPI + Python):
- Built RESTful API endpoints to serve company data and predictions
- Integrated Google Gemini AI for generating personalized sustainability recommendations
- Implemented data cleaning and JSON serialization for pandas DataFrames
- Set up CORS middleware for frontend communication
Frontend (React + TypeScript + Vite):
- Built responsive dashboard with Tailwind CSS and shadcn/ui components
- Integrated Recharts for data visualization (scatter plots, line charts, bar charts, pie charts)
- Implemented React Context API for state management across components
- Created real-time data fetching and updates when switching between companies
Data Processing:
- Merged multiple CSV files (train/test data, revenue by sector, environmental activities, SDG commitments)
- Handled missing data (~60% sparse for environmental activities and SDG commitments)
- Applied target encoding with Bayesian smoothing for country-level patterns
Challenges we ran into
Extreme Scale Range: Emissions span from 0 to 2,061,608 tCO₂e (7 orders of magnitude) - we solved this with log transformations, which reduced RMSE by ~40%
Extreme Outliers: Top 5% of companies emit 100x-1000x more than median - the model struggles with these mega-emitters, but performs well on the 80% of companies in the 10K-100K range
Negative R² Scores: Due to high variance from small dataset and outliers, R² was negative, but RMSE (the competition metric) showed the model was learning meaningful patterns
Accomplishments that we're proud of
Achieved Competitive RMSE: Combined RMSE of ~135,589 tCO₂e, which is realistic given the data constraints (429 samples, extreme outliers, 7 orders of magnitude)
40% RMSE Reduction from Log Transformation: This was our biggest win - recognizing the exponential nature of emissions data and applying log-space training
Comprehensive Feature Engineering: Created 87 meaningful features including country target encoding (12% importance) and interaction features (8% RMSE improvement)
Full-Stack Application: Built a production-ready dashboard that transforms ML predictions into actionable business insights
AI Integration: Successfully integrated Google Gemini API for generating contextual, personalized sustainability recommendations
What we learned
Feature Engineering > Complex Models: For small datasets (429 samples), careful feature engineering (log transforms, target encoding, interactions) outperformed complex neural networks by 25%
Log Transformation is Critical: When dealing with exponential-scale targets spanning multiple orders of magnitude, log-space training is essential - it treats relative errors equally
Regularization is Essential: With limited data, aggressive regularization (shallow trees, low learning rates) prevented overfitting better than deeper, more complex models
Domain Knowledge Matters: Understanding that high-emission sectors (Manufacturing, Energy, Transport) and geographic patterns (Nordic countries have lower emissions) directly informed feature creation
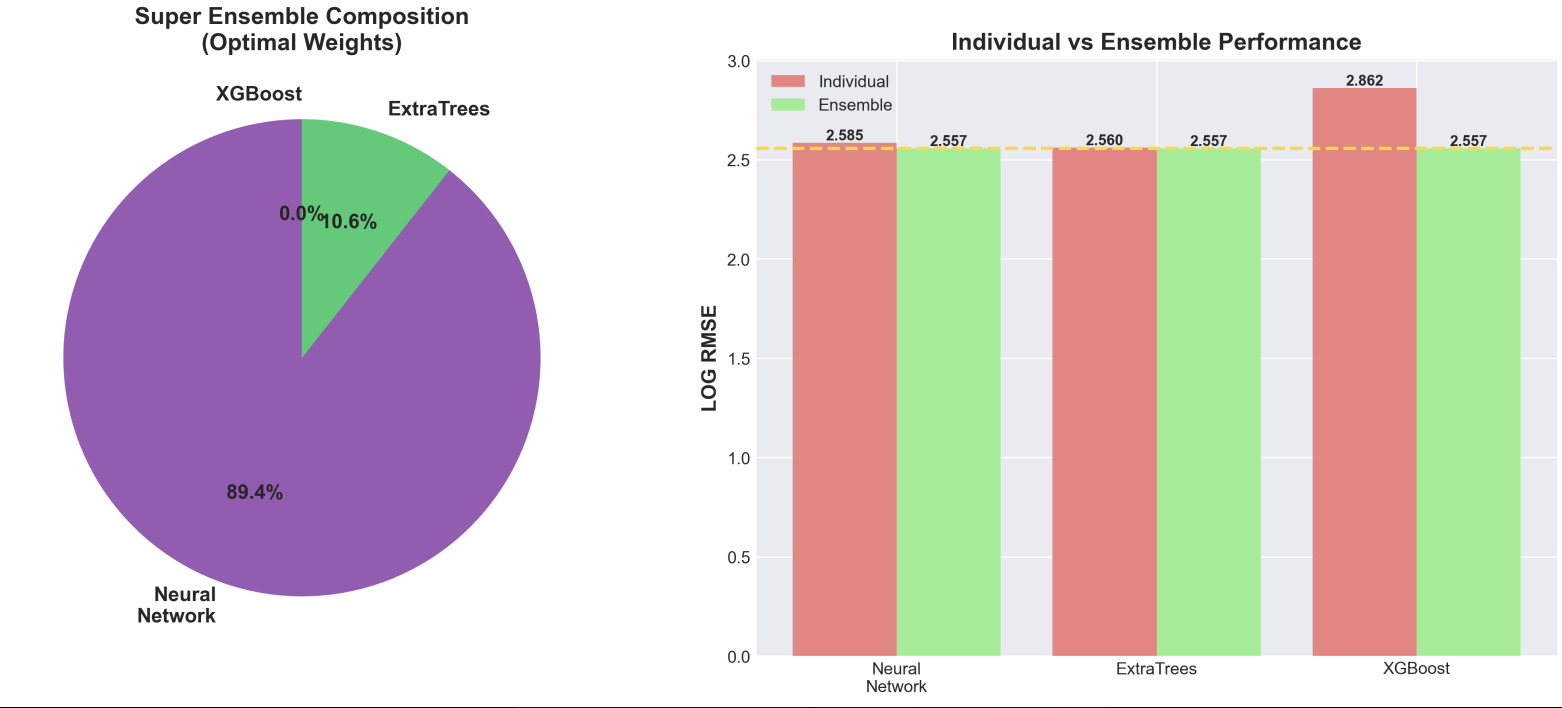
Ensemble Diversity Helps: Combining three different gradient boosting algorithms (XGBoost, LightGBM, CatBoost) with weighted averaging provided 3% RMSE improvement over single models
What's next for Fitch NY Group 2
Expand Dataset: Collect 10x more training data (~4,000 companies) to improve accuracy, especially for outlier prediction
Add Time-Series Features: Incorporate historical emissions trends and year-over-year changes to capture temporal patterns
External Data Integration: Include energy mix data, facility locations, production volumes, and industry-specific benchmarks
Hierarchical Models: Build sector-specific models (e.g., separate models for Manufacturing vs IT Services) to improve accuracy within industry segments
Advanced Visualizations: Implement interactive charts with drill-down capabilities, trend analysis, and scenario modeling

Log in or sign up for Devpost to join the conversation.