-
-
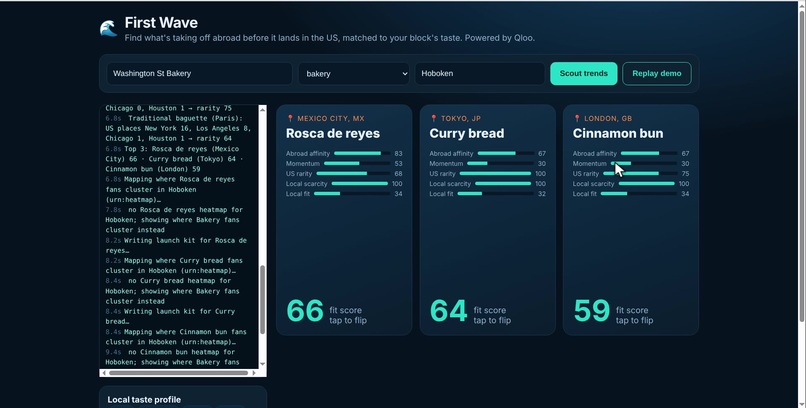
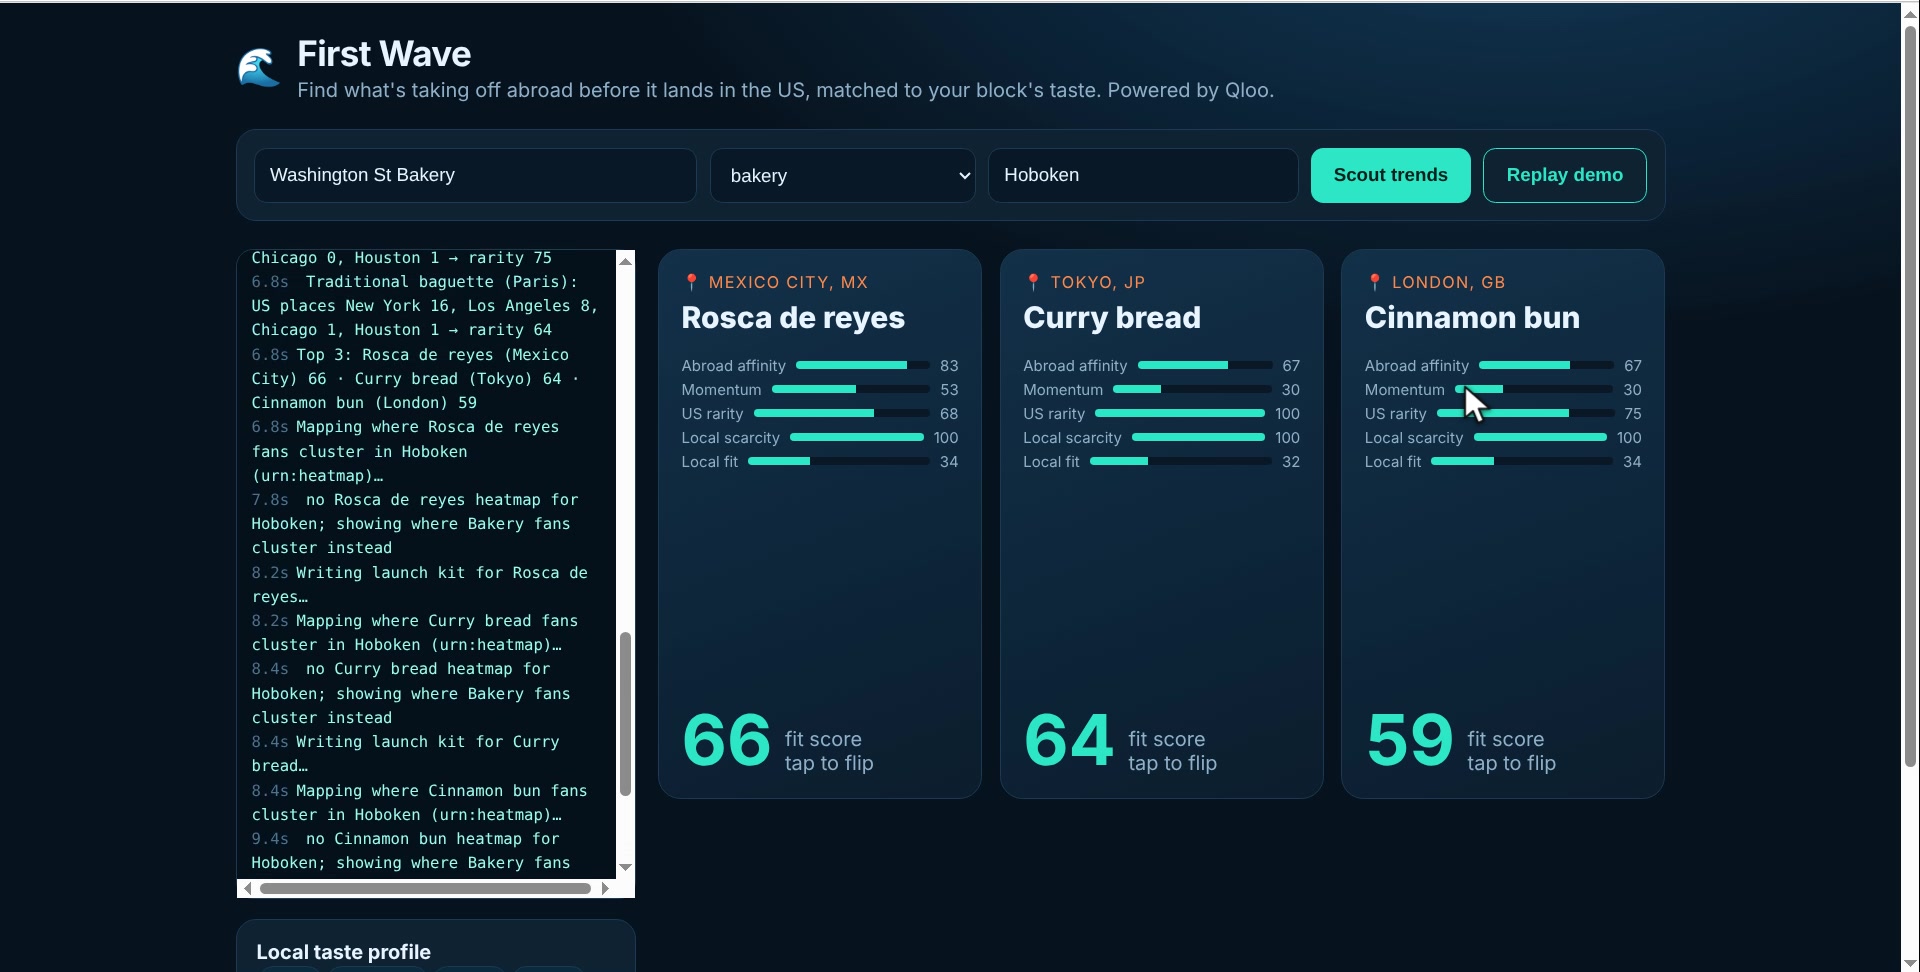
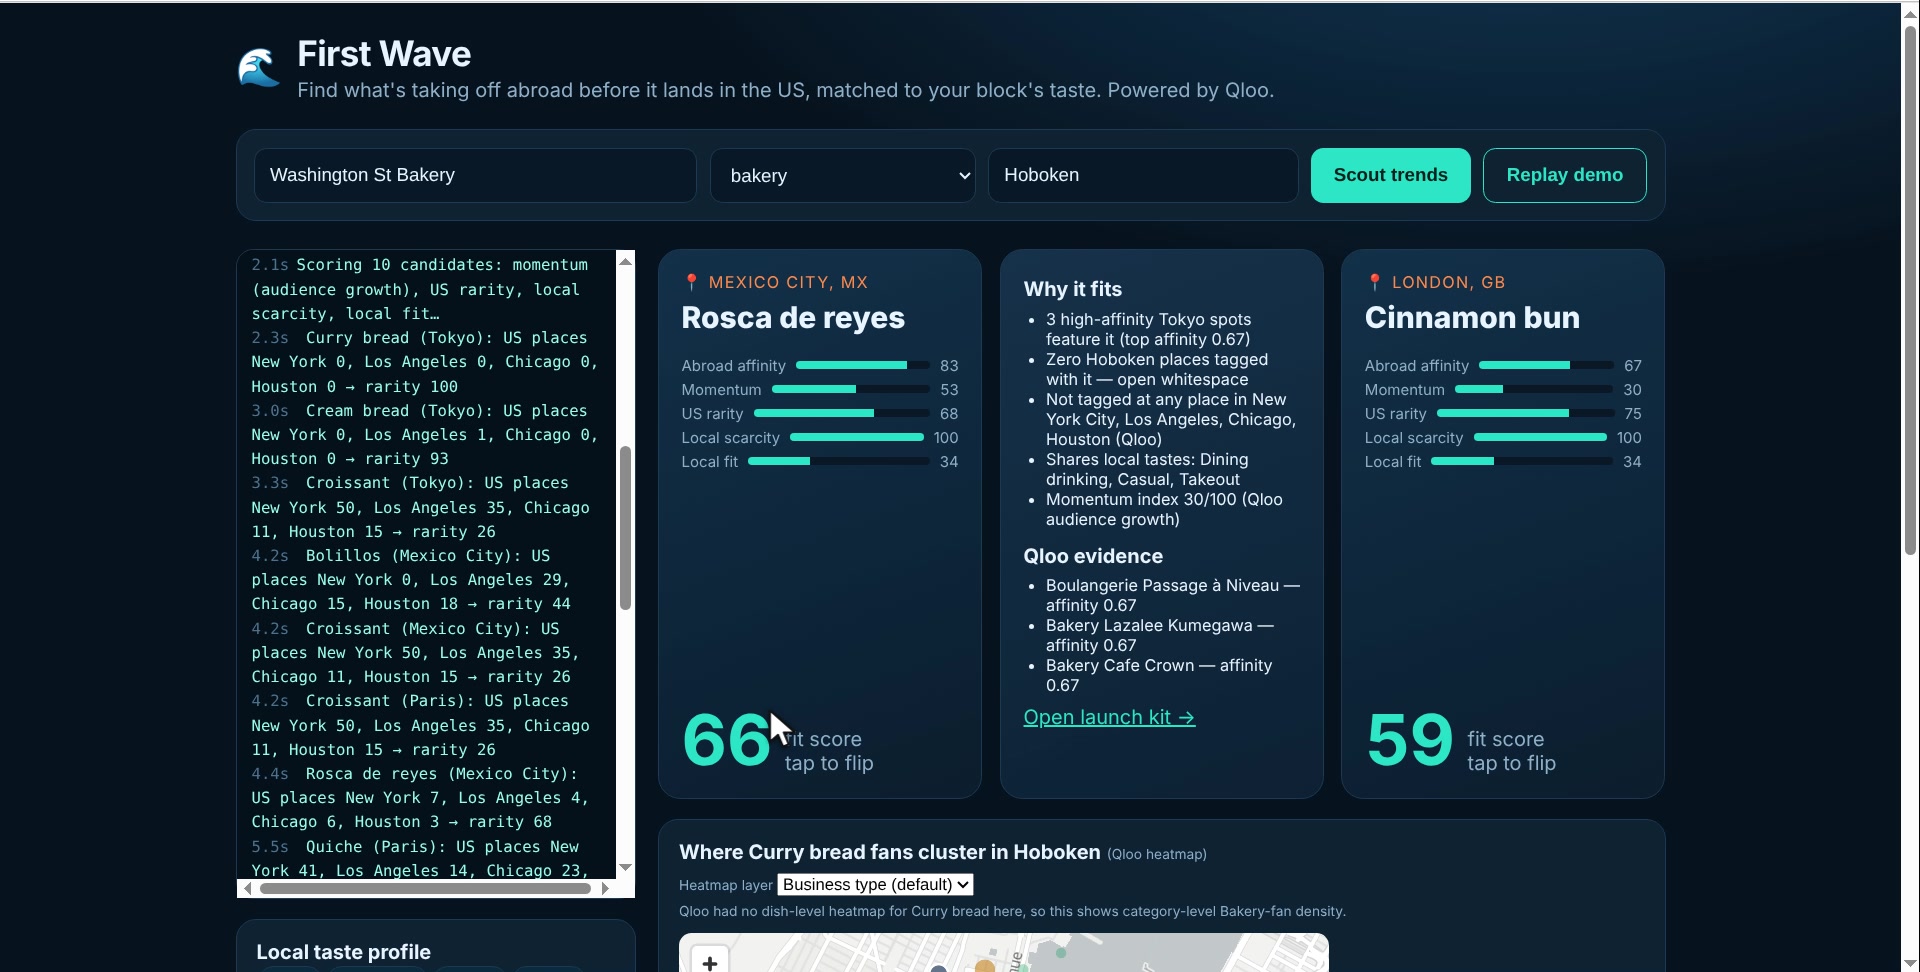
Live run for a Hoboken bakery: the agent log streams every Qloo call; three trend cards land in about ten seconds.
-
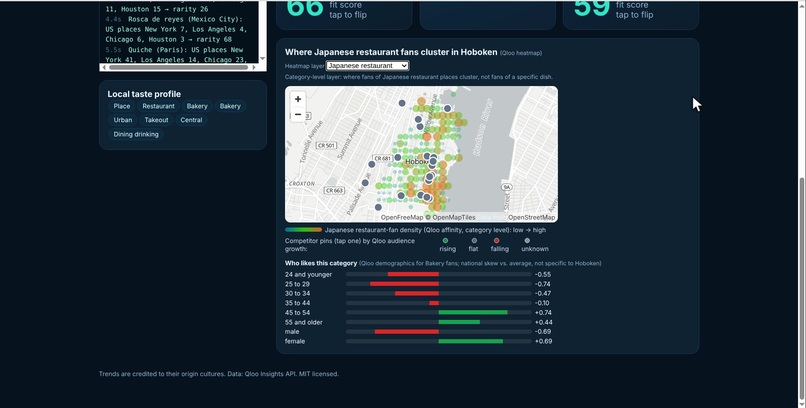
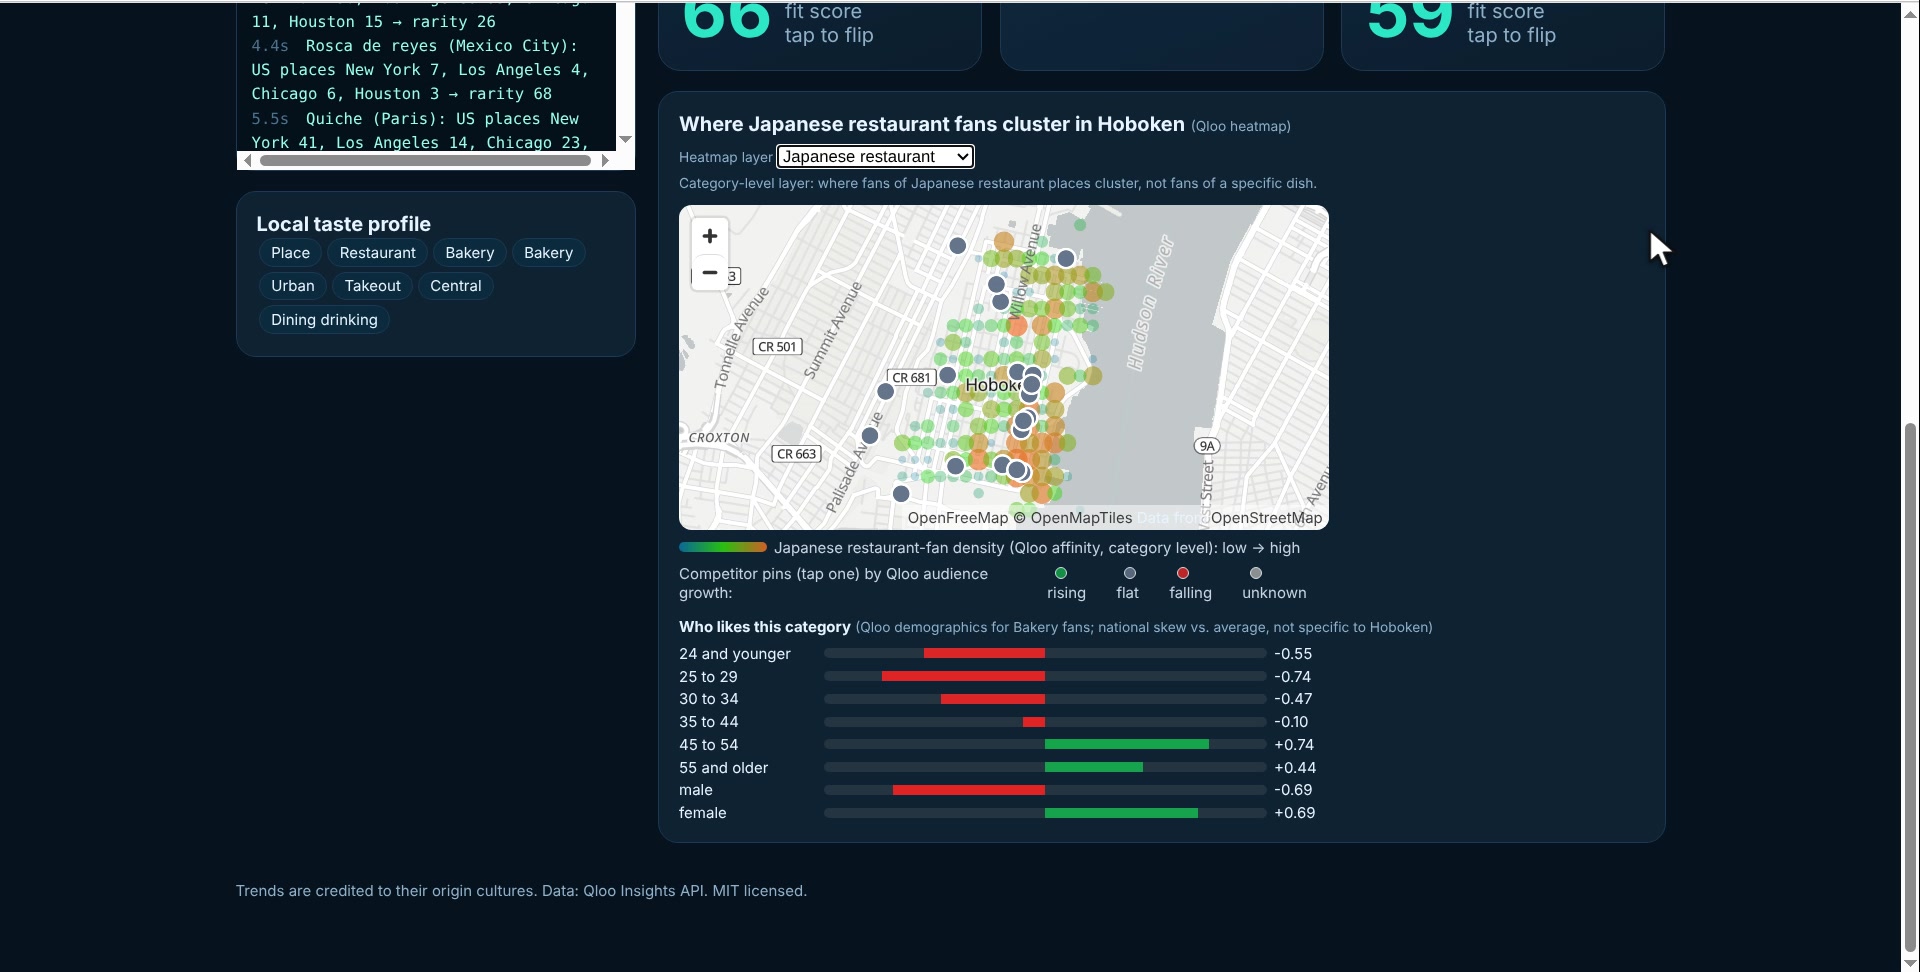
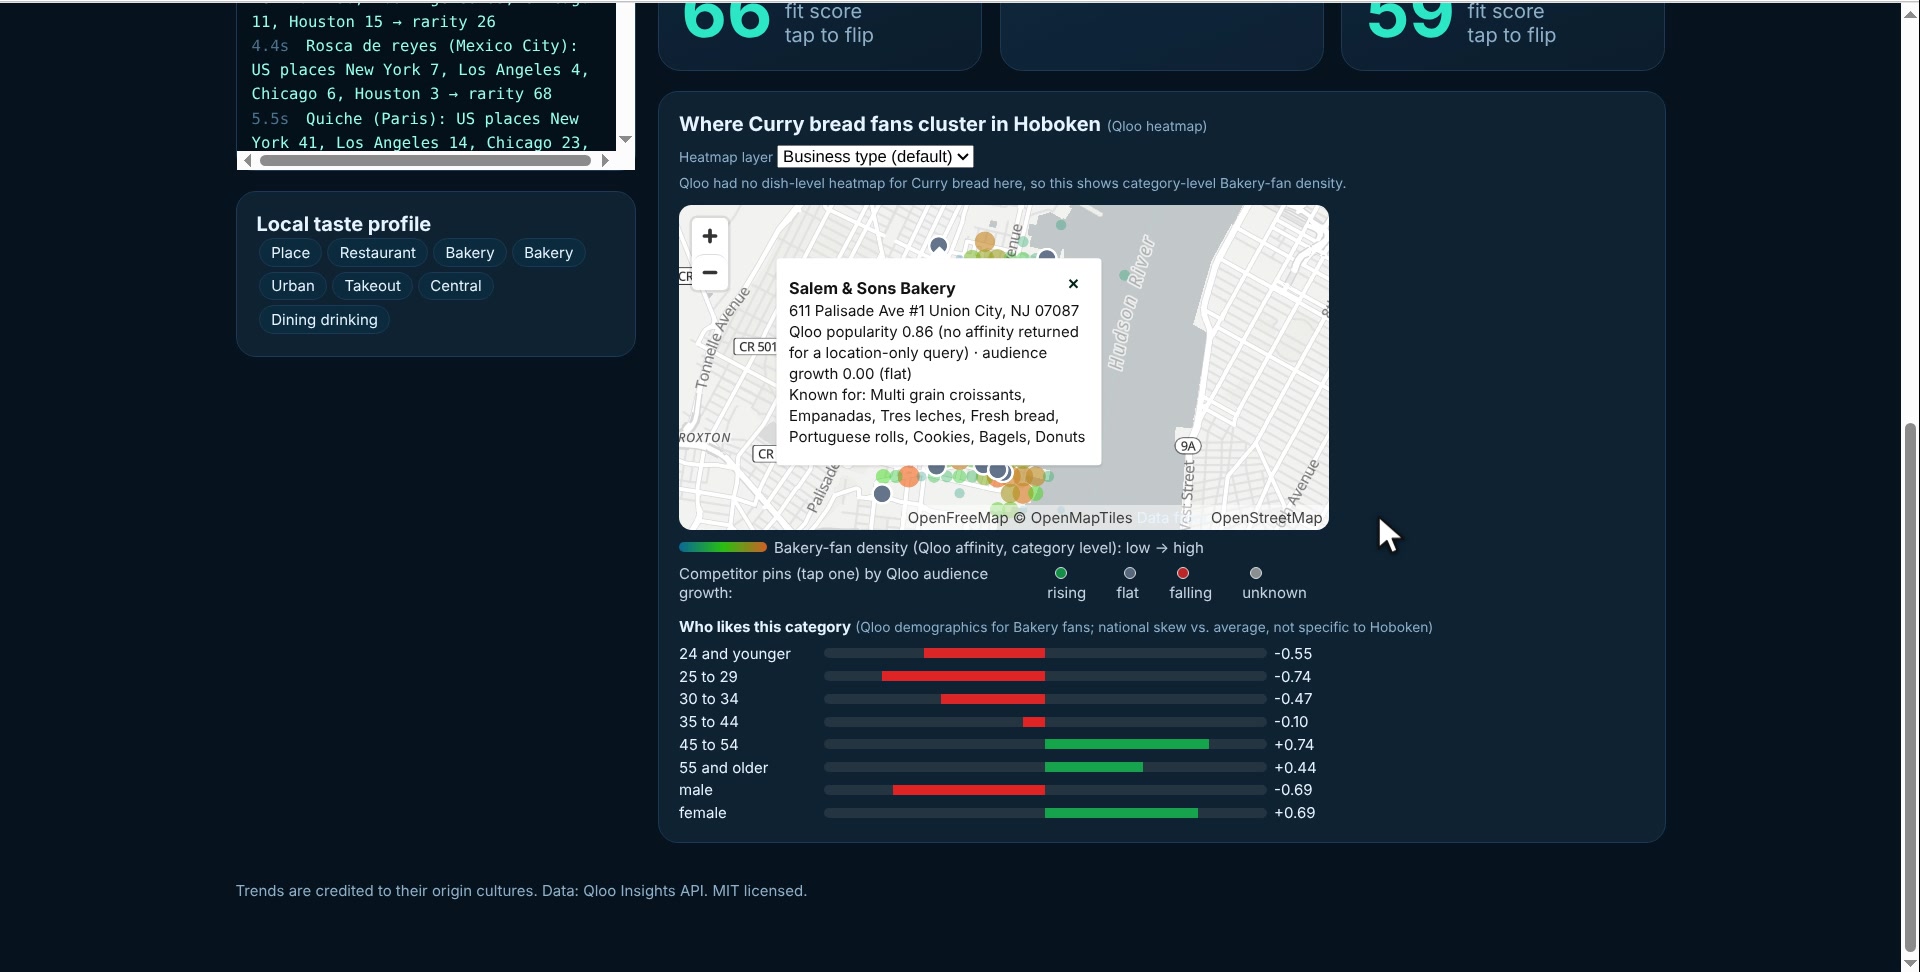
Heatmap layer switched to Japanese-restaurant fans, plus Qloo demographics for bakery fans.
-
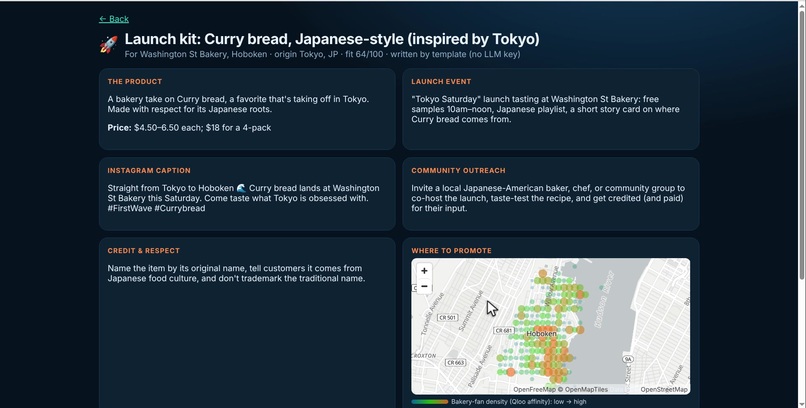
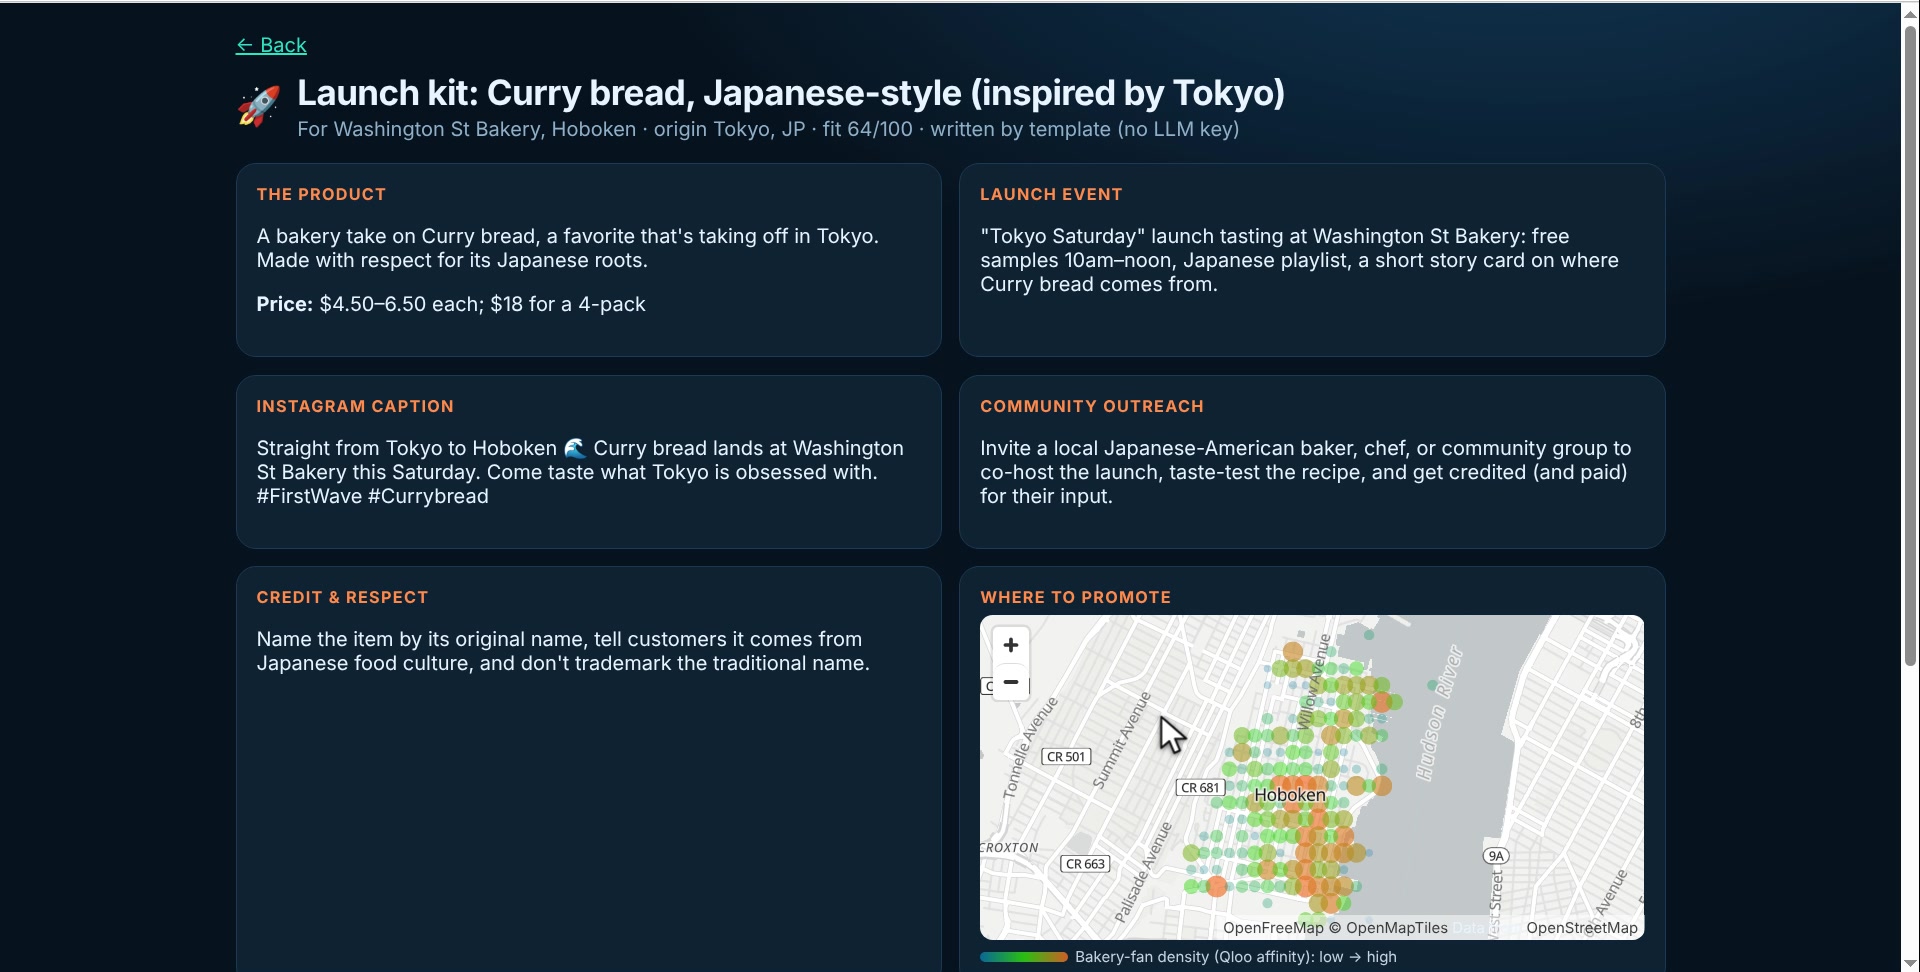
The launch kit for curry bread: product, event, caption, outreach, credit & respect, and where to promote.
-
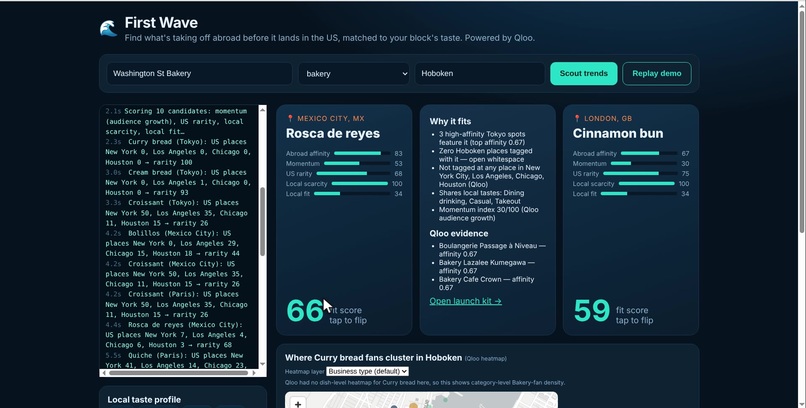
Curry bread (Tokyo) flipped: not tagged at any place in NYC, LA, Chicago or Houston. Croissants: 50 / 35 / 11 / 15.
-
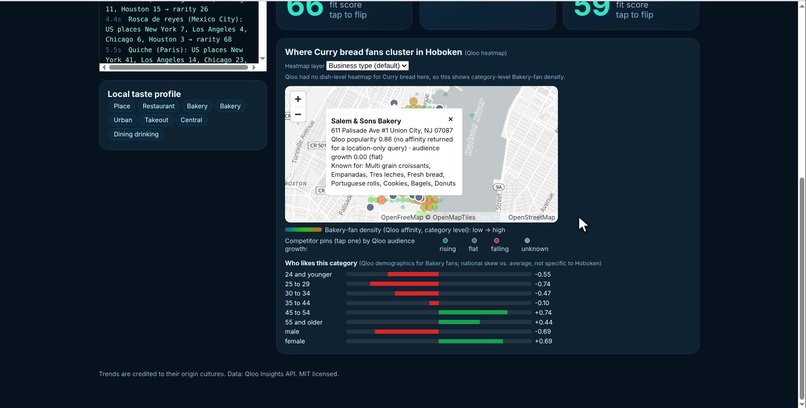
Qloo heatmap of bakery fans over Hoboken streets, with competitor pins; a tapped pin shows what that bakery is known for.
Inspiration
Every food trend in America started somewhere else first. By the time it shows up on TikTok here, the big chains already have it. Small shops don't have trend analysts; they hear about the next big thing at the same moment everyone else does. I wanted an agent that watches other cultures and tells a local shop what to launch before it gets here, and gives credit to where it came from.
What it does
You enter a business (name, type, city). First Wave runs a scouting loop on Qloo's taste data and streams its reasoning live into an agent log:
- Resolves the business type to a Qloo tag and builds a local taste profile for the neighborhood (the places there and the tastes they share).
- Scouts four cities abroad (Tokyo, Mexico City, Paris and London) for dishes that are rising there (
bias.trends=high). - Checks US rarity: for each candidate dish it counts the places in New York City, Los Angeles, Chicago and Houston that actually carry that dish tag. Zero everywhere means the dish hasn't landed yet.
- Checks local scarcity and local fit: how many places in the shop's own city already carry it, and how well its audience overlaps the neighborhood's taste profile.
- Scores and ranks the candidates into three trend cards, each with a fit score, five sub-scores, the Qloo evidence (the high-affinity places abroad) and a one-page launch kit (product, price, launch event, caption, community outreach, a credit-and-respect note, and where to promote).
- Maps the audience: a heatmap of category fans over real streets, competitor pins (tap one to see what that place is known for and its audience growth), switchable heatmap layers (Mexican, Japanese, British restaurant, café) and a "who likes this category" demographics panel.
In the demo, a real bakery in Hoboken gets Rosca de reyes (Mexico City) 66 · Curry bread (Tokyo) 64 · Cinnamon bun (London) 59. Curry bread is a staple at bakeries in Tokyo, yet across New York, LA, Chicago and Houston Qloo shows zero places known for it. Croissants, by comparison, show up at 111. That gap is the opportunity. The run in the video is live data streamed in real time (about ten seconds), not a recording.
What makes it Qloo-powered
Without Qloo there is no cross-city taste data and no local gap, so the app cannot work. Every number on a trend card comes from a Qloo call:
- Resolve business type to a tag:
GET /v2/tags?filter.query=bakery - Local taste profile:
GET /v2/insights?filter.type=urn:entity:place&filter.location.query=Hoboken&filter.tags=<type tag> - Scout abroad:
GET /v2/insights?filter.type=urn:entity:place&filter.location.query=Tokyo&filter.tags=<type tag>&bias.trends=high(same for Mexico City, Paris, London) - Momentum:
query.measurements.audience_growthfrom thebias.trends=highinsights call - US rarity:
GET /v2/insights?filter.type=urn:entity:place&filter.location.query=<New York City / Los Angeles / Chicago / Houston>&filter.tags=<dish tag>&take=50. Places that actually carry the tag are counted; 0 everywhere = rare - Local scarcity: the same insights call for the shop's own city with the trend tag (fewer results = more whitespace)
- Where to promote (heatmap):
GET /v2/insights?filter.type=urn:heatmap&filter.location.query=Hoboken&signal.interests.tags=<trend tag>, falling back to the category-level heatmap when a dish has no heatmap yet - Competitor pins: the same-category places already returned by the local-profile call (lat/lon, dish tags,
audience_growth), tinted rising / flat / falling - Cuisine heatmap layers:
urn:heatmapcalls for the origin cuisine of each top-3 trend (e.g. Mexican, Japanese, British restaurant) plus café - Who likes this category:
GET /v2/insights?filter.type=urn:demographics&signal.interests.tags=<type tag>(age and gender skew vs. average, national as Qloo returns it)
Fit score = weighted geometric mean (lib/score.ts): abroad affinity 0.25 × momentum 0.15 × US rarity 0.30 × local scarcity 0.15 × local fit 0.15. US rarity = 1 − √(share of the 4×50 US-city slots that carry the dish), so dishes already common in the US (croissant) cannot score high.
The language model only writes the launch-kit copy from the Qloo evidence (product name, price, event, caption, outreach, credit note). With no LLM key a deterministic template is used instead; the live demo runs the template, so every kit is reproducible. If the app would work the same without Qloo it would be the wrong app. Here, Qloo is the whole engine.
How I built it
- Next.js (App Router) + TypeScript on Vercel. One server-only Qloo client (
lib/qloo.ts), the scout loop (lib/agent.ts), the gap score (lib/score.ts) and the launch kit (lib/llm.ts). - The agent streams NDJSON from
app/api/scout, so the UI shows every Qloo call and intermediate result as it happens (the agent log), then the cards, then the map overlays. - MapLibre GL over the free OpenFreeMap "positron" vector style for the street-level heatmap, competitor pins and popups.
- Qloo responses are cached privately in server memory only; no Qloo data is committed to the repo. With no
QLOO_API_KEYthe app runs on clearly labeled[MOCK]fixtures so the code can be exercised without a key. - Unit tests cover the gap score (
npm test).
Challenges I ran into
- Finding dish-level signal. Not every city returns specialty-dish tags: Seoul returned none and Lagos only generic "cake" tags, so the source cities were narrowed to the four that do.
- Measuring "hasn't landed yet" honestly. Counting the places per US city that actually carry the dish tag, rather than trusting a single score, is what makes "0 across four cities" a credible claim, and it needed a rarity formula that keeps common dishes from sneaking up the ranking.
- Momentum.
/v2/trendingrejects places on the hackathon host, so momentum comes fromaudience_growthon the trends-biased insights call. - Heatmaps for a dish that doesn't exist locally (the whole point): when Qloo has no dish-level heatmap for a neighborhood, the map falls back to the category-level heatmap and says so on screen.
Accomplishments that I'm proud of
- The whole chain (tag → local profile → four cities → US rarity → scarcity → fit → kit → map) runs end-to-end on live Qloo data in about ten seconds, and the UI shows its work.
- The "zero places in four US cities" result for curry bread is a real, checkable finding, not a vibe.
- Every launch kit names the origin culture, keeps the dish's original name and recommends partnering with (and paying) local diaspora makers. Trend scouting with credit, not appropriation.
What I learned
- Qloo's place insights are strong enough to act as a cross-city "menu census": the same dish tag can be counted in Tokyo and in Houston, which is what turns taste data into a business gap.
- Streaming the agent's intermediate steps matters for trust. A score alone is a black box; a log line that says "Curry bread (Tokyo): US places New York 0, Los Angeles 0, Chicago 0, Houston 0" is an argument.
What's next for First Wave
- More source cities as dish-level tags fill in (Seoul, Lagos and Istanbul are wired but dormant).
- Non-food verticals (the type selector already offers café, bar, boutique) and a weekly "first wave" email for a shop's block.
- Dish-level heatmaps as they become available, and an LLM-written kit in production behind the template fallback.
Try it (judges)
- Open https://first-wave-nine.vercel.app (no login).
- Keep the defaults (Washington St Bakery · bakery · Hoboken) or enter your own business, then press Scout trends. The agent log streams for about ten seconds; three trend cards appear.
- Tap a card to flip it ("Why it fits", Qloo evidence); the map section appears below it. Tap a competitor pin for its popup, switch the heatmap layer, see the demographics panel.
- Click Open launch kit → on any card for the one-page kit (Print / save PDF).
- Replay demo re-streams the last live run from the private in-memory cache if the network is slow.
Built With
- maplibre-gl
- next.js
- node.js
- qloo
- react
- typescript
- vercel

Log in or sign up for Devpost to join the conversation.