Inspiration
In January 2025 the Eaton and Palisades fires in Los Angeles County killed 29 civilians (17 and 12) and destroyed about 9,414 and 6,837 structures (NWS storm-event narratives in NCEI Storm Events). CAL FIRE's own per-structure inspections count 9,419 destroyed of 18,428 inspected in the Eaton fire and 6,845 of 12,081 in the Palisades fire. Someone has to walk each of those lots, and the order they walk in decides who gets help first.
The record on that order is thin. In August 2026 the DHS Office of Inspector General (OIG-26-21) reviewed FEMA's door-to-door crews after Hurricanes Helene and Milton: 744,288 locations recorded, no contact at 555,374 of them (74.6%). Notes explaining a skip appear on only 4% of those records, and one crew skipped 11 homes over political yard signs. FEMA has since stopped door-to-door canvassing (memo of 26 June 2025). One caution I owe the reader: that canvassing is registration outreach, not formal damage inspection. I'm using it as evidence that in-person coverage is thin and its skip decisions go unaudited, not as an inspection statistic. I also could not find a government figure for how long assessments take, so I'm not quoting one.
What I wanted was a tool that looks at the imagery that already exists and answers one narrow question: which door first.
What it does
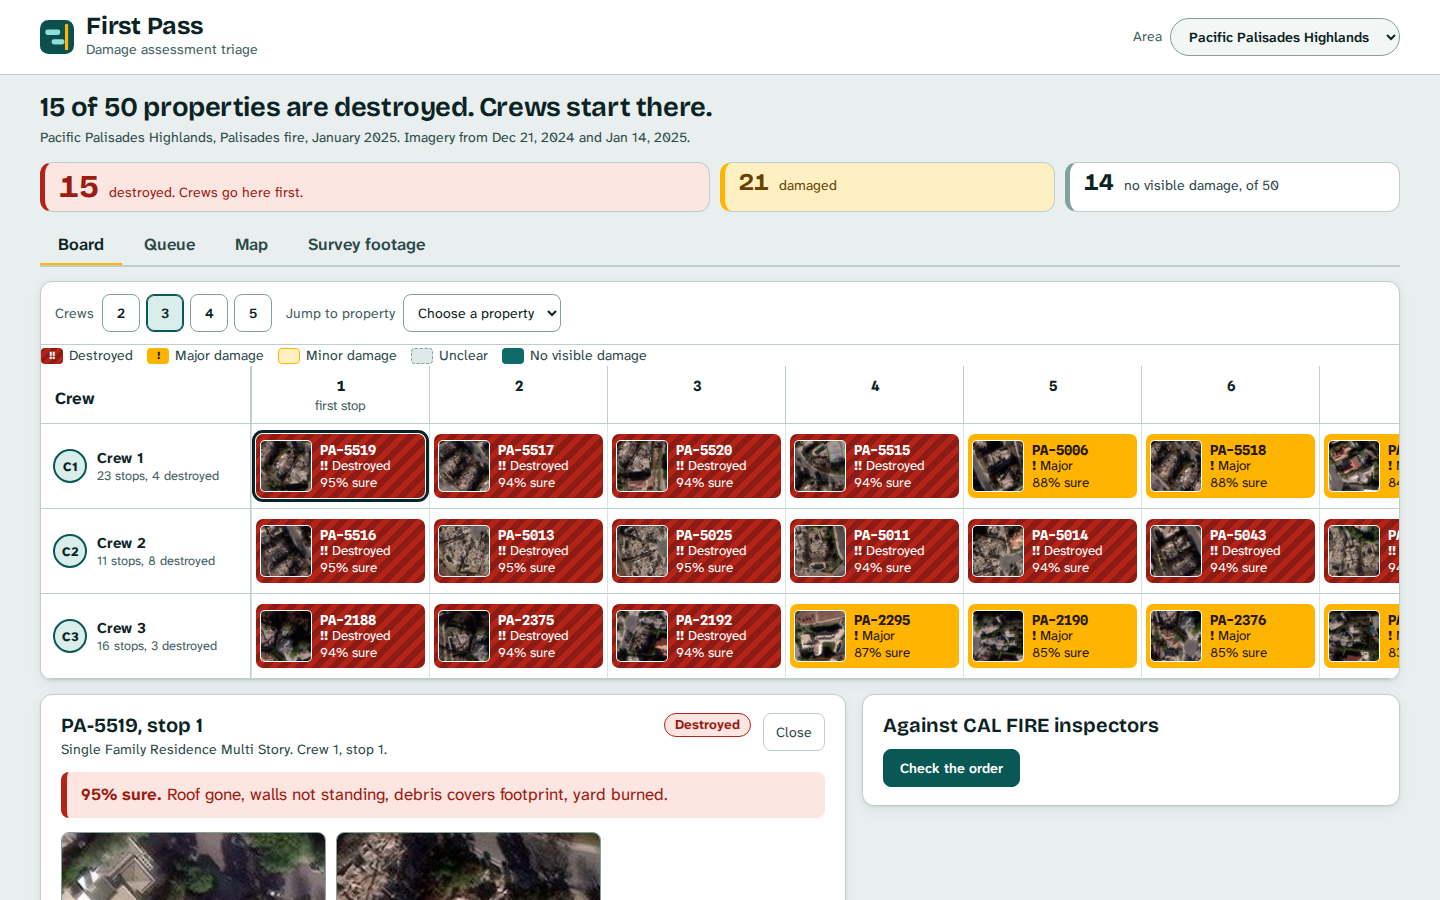
First Pass is a damage-assessment triage board. For a burned neighbourhood it reads the before and after aerial imagery of every property, grades each one, and orders the visits across crews so the worst houses come first.
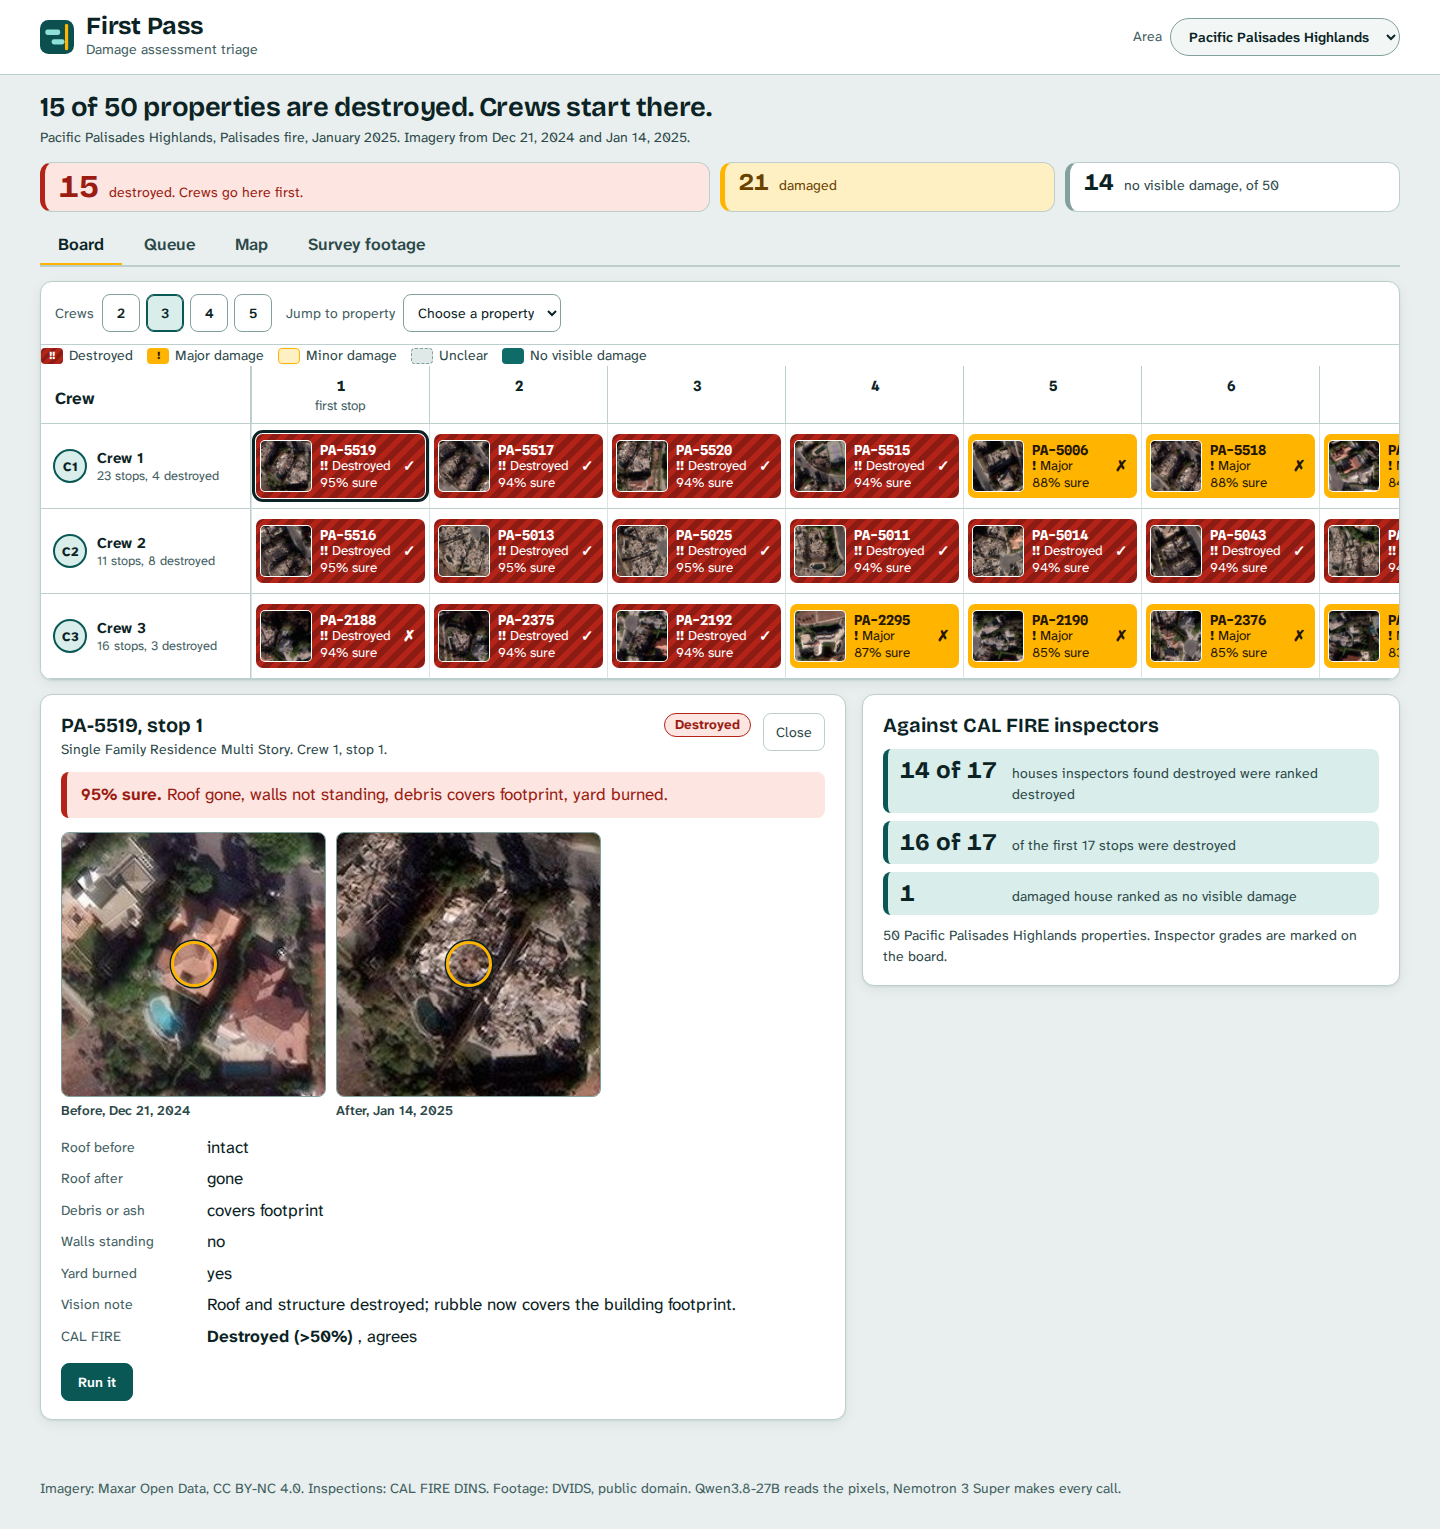
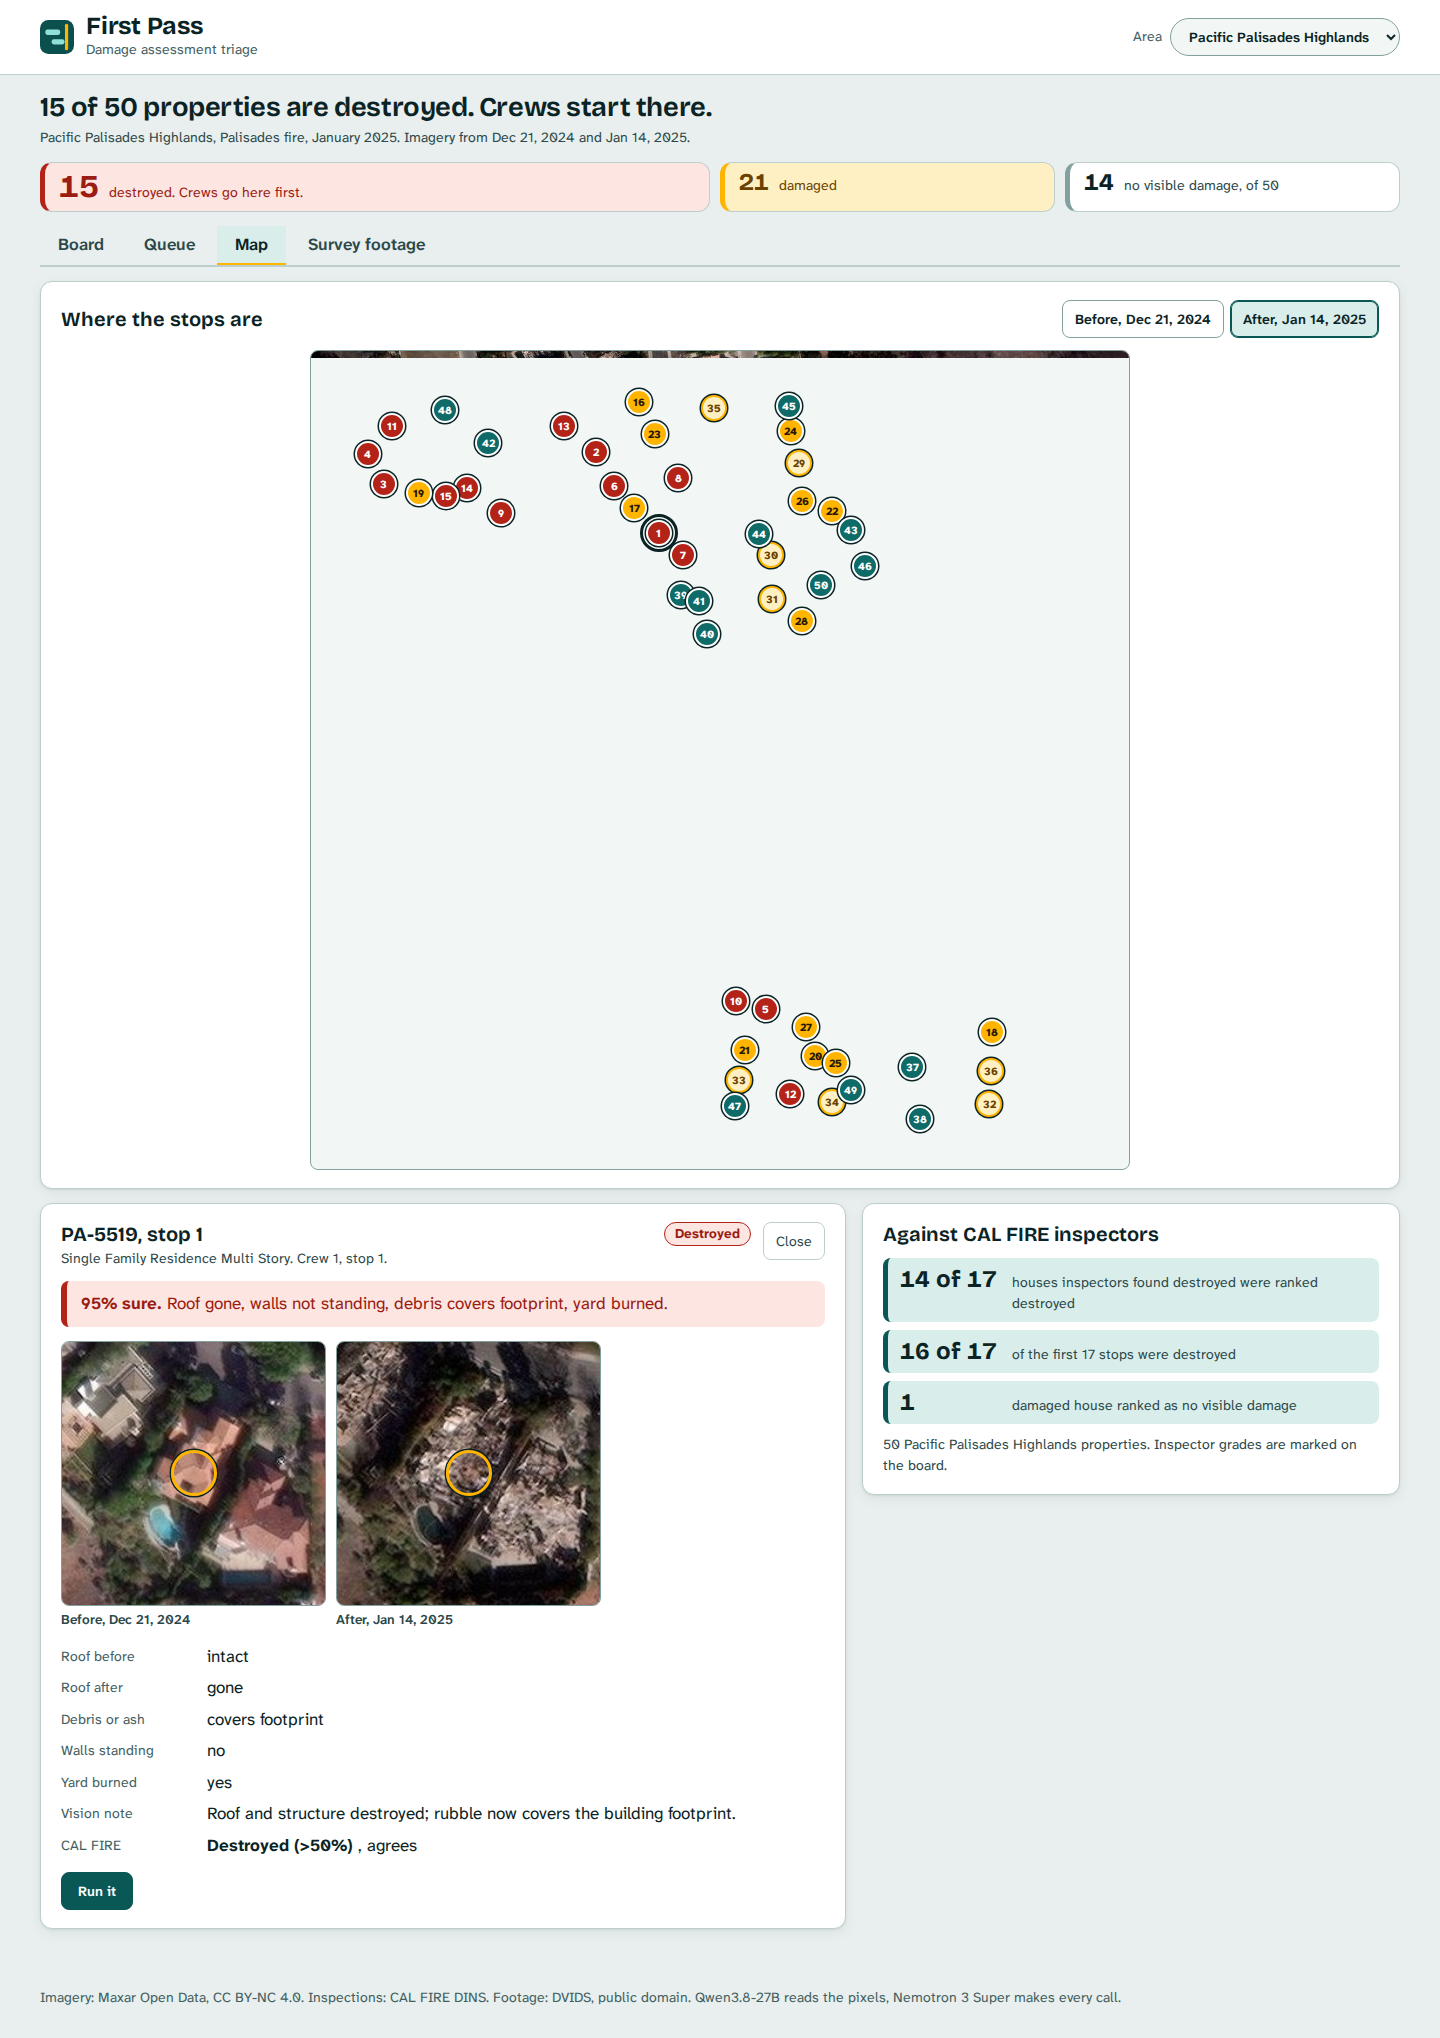
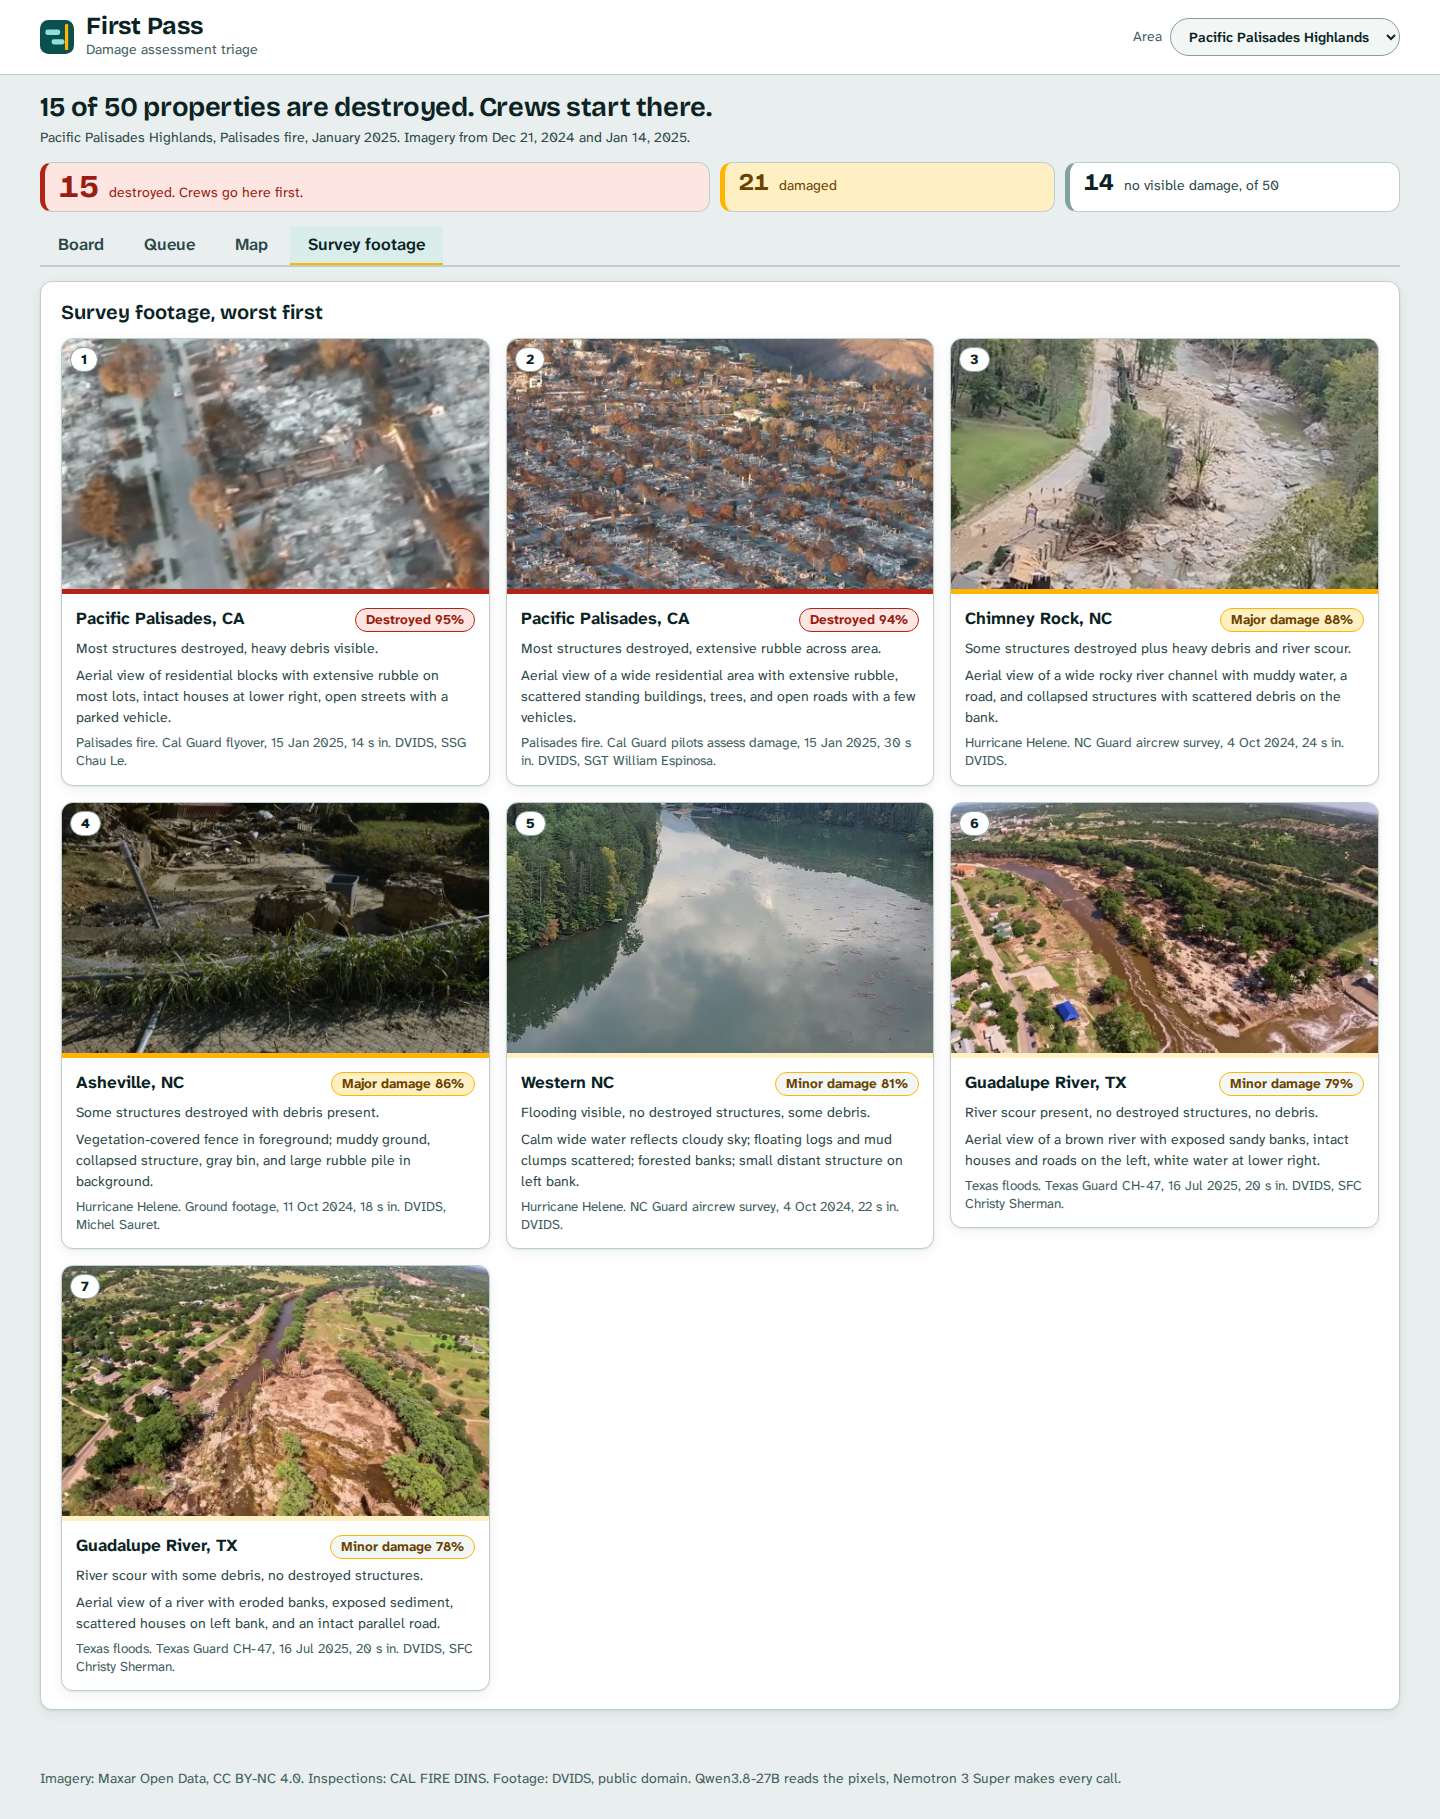
I built it on two real LA fire areas: 50 properties in Pacific Palisades Highlands and 41 in Altadena. Each row of the board is a crew. Each block is a property, with a real Maxar satellite thumbnail, red hatching for destroyed, and a confidence. Click one and you get the before and after crops, what the vision model saw (roof before and after, debris, walls standing, yard burned), the grade, and a one-line reason. A Crews switch (2 to 5) redeals the stops. A Map tab shows where the stops are over the before or after tile. A Survey footage tab reads seven frames from public-domain National Guard flyovers (Palisades, Helene, Texas floods) and ranks them the same way.
The board never hands you a verdict without a way to check it. The inspectors' grades stay on the server until you press Check the order.
How I built it
The backend is FastAPI. The frontend is React with a light triage board built in plain CSS grid, and no commercial scheduler SDK. Code is Apache-2.0.
The pipeline has three steps, all on Nebius Token Factory:
- Prep. A 70 m before/after crop is cut from Maxar Open Data tiles around each CAL FIRE inspection point.
- Vision, Qwen3.8-27B. One read per crop pair into fixed fields: roof before and after, debris, walls standing, yard, view blocked. It describes. It does not decide. (No NVIDIA model reads images on serverless, so the vision step uses Qwen.)
- Triage, NVIDIA Nemotron 3 Super. One call per area turns the descriptions into a severity, a confidence and a one-line reason for every property, including the ones ranked last, so the order can be audited. The server sorts by severity then confidence. Geographic k-means clustering splits the stops into crews, so each crew works one part of the map instead of criss-crossing it.
To keep a visitor from costing tokens, the full results are cached; the Run it button re-reads one property live (Qwen, then Nemotron, a few seconds) and is capped at 40 runs an hour.
One real gotcha: Qwen3.8 thinks before it answers, so it needs a large max_tokens budget (I used 3000) or it returns nothing.
What makes it agentic
| Perception | Decision | Action |
|---|---|---|
| Before and after crops of a property, read into fixed fields | Grade the damage and say how sure it is | Write a severity, a confidence and a reason for every property, including the lowest-ranked |
| A full area of graded properties | Which houses crews should reach first | Sort by severity then confidence, cluster by location, and deal the stops across 2 to 5 crews |
| A single property the viewer questions | Whether the cached read still holds | Re-run vision and triage live, and show the new read next to the old one |
| Inspector grades, hidden until asked | Does the ordering hold up against people on the ground | "Check the order" marks agreement on every block |
Accomplishments
- The ground truth is real. CAL FIRE DINS inspection points sit on the same Maxar tiles, so the order can be scored house by house.
- In the Palisades window of 50 properties, the agent graded 15 destroyed, 21 damaged and 14 with no visible damage. Inspectors found 17 destroyed. 14 of those 17 were ranked destroyed, and 16 of the first 17 stops were destroyed. One damaged house was ranked as no visible damage, and the board says so.
- Crew 1's first four stops are all destroyed houses at 94 to 95% confidence.
- Altadena, 41 properties: 39 destroyed, 1 damaged, 1 unclear.
- Every property carries a reason, including the ones ranked last. That is the audit trail the OIG found missing.
- Runs end to end on the live URL with the real imagery. No outside services beyond Token Factory.
What's next
- Score the Altadena window against inspectors the way I did Palisades.
- Add the Helene flood areas. I found Maxar pre/post pairs for Spruce Pine, Old Fort and Erwin, including a re-roofed factory that is change but not damage, and a mostly cloud-covered scene where the right answer is "cannot assess, ask for a new pass".
- Teach the triage to weigh who lives there (age and access needs) and whether the road is passable, not only how damaged the house looks.
- Run the vision step on a local NVIDIA model on a laptop GPU so crews can re-plan with no network. I have not tested that on real hardware.

Log in or sign up for Devpost to join the conversation.