-
-
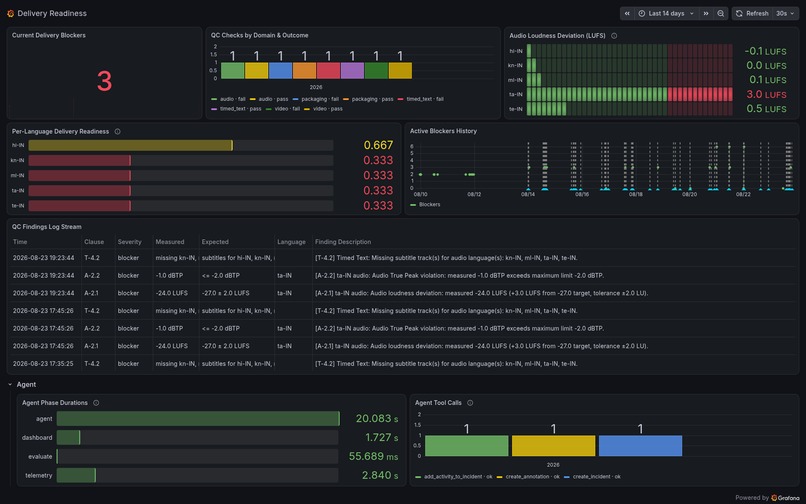
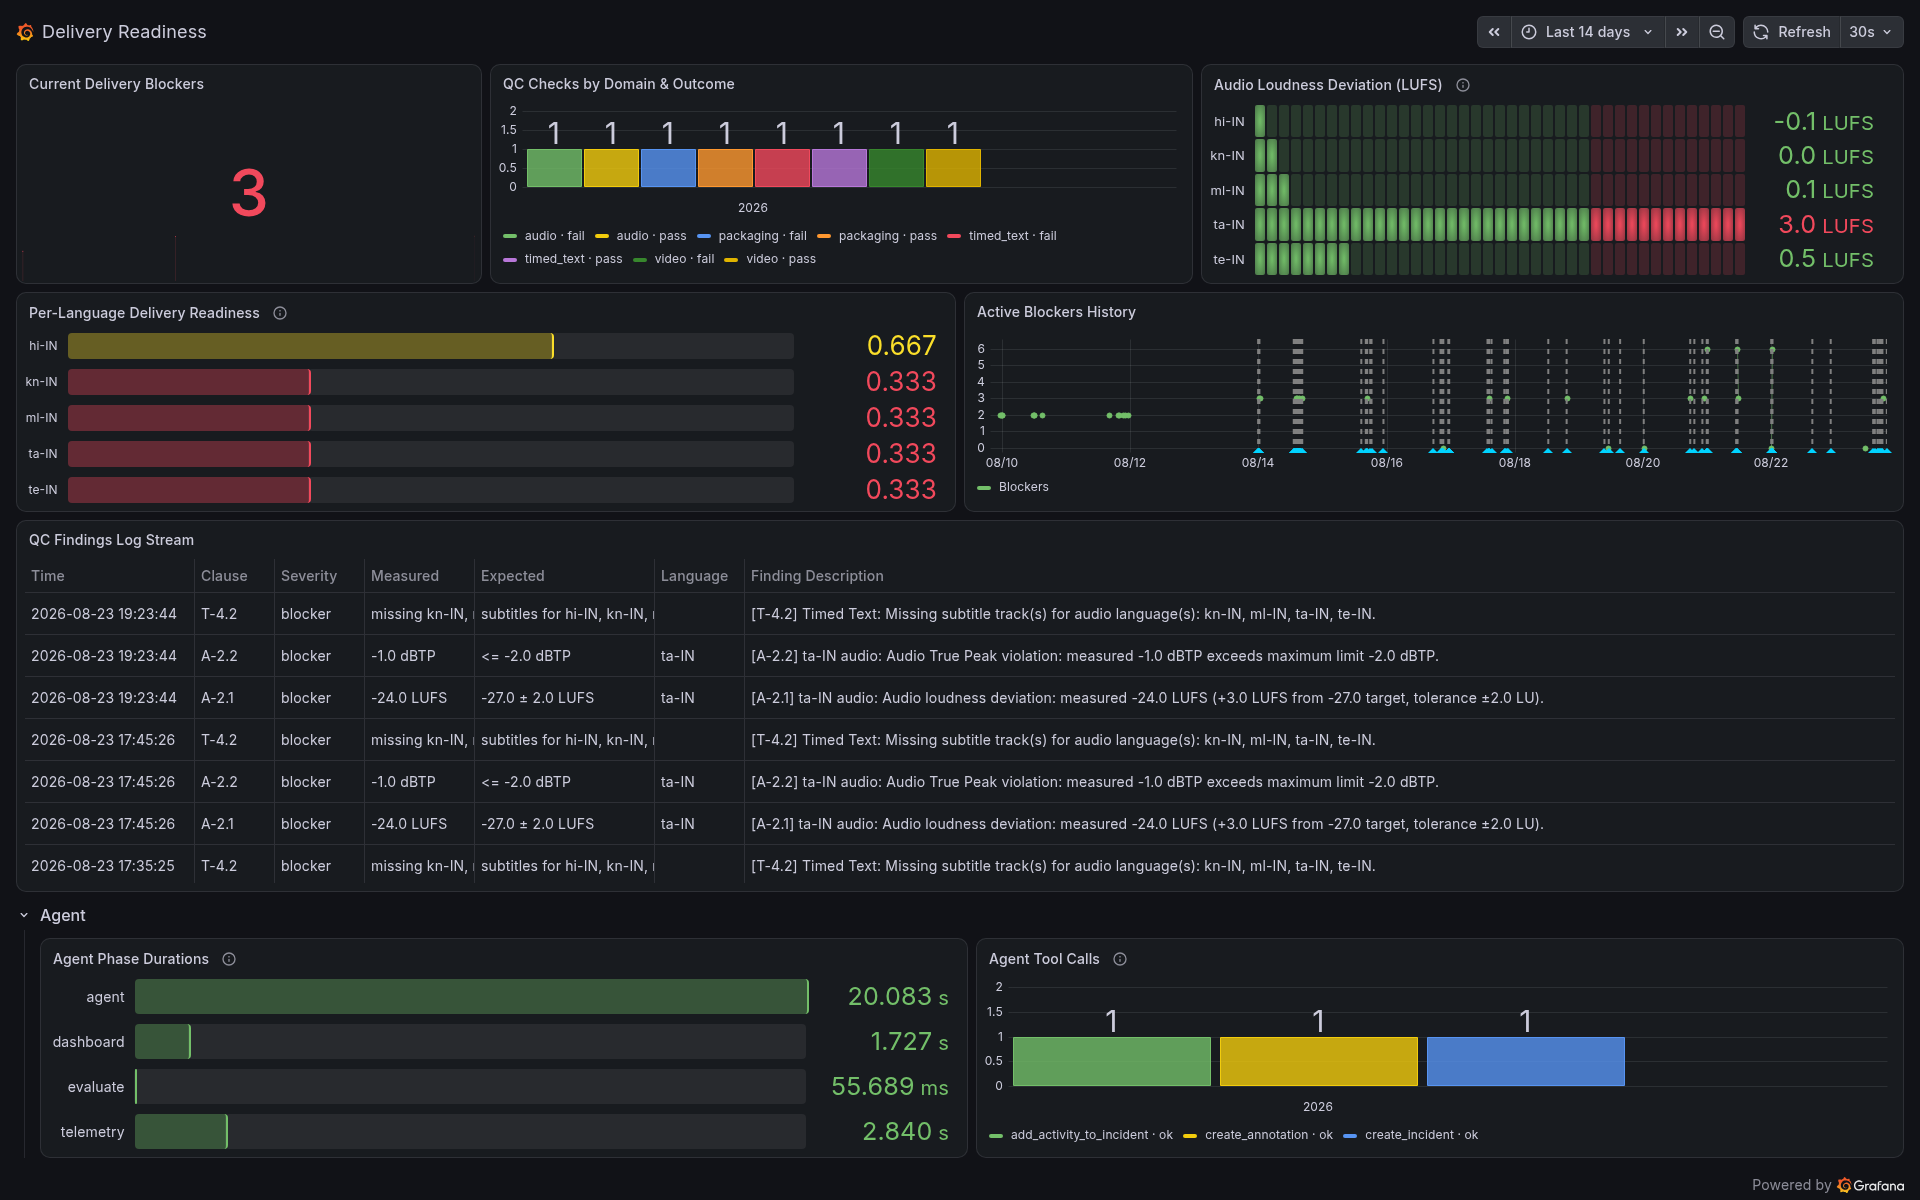
Delivery Readiness dashboard, published by the deterministic Python engine over the Grafana REST API, not by the agent.
-
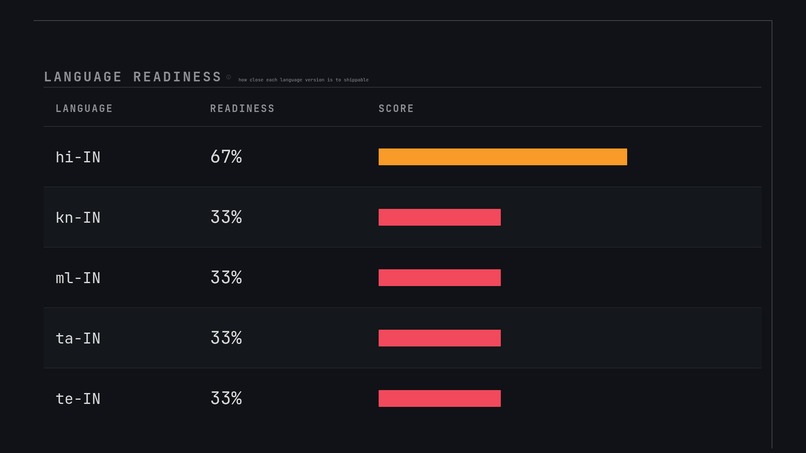
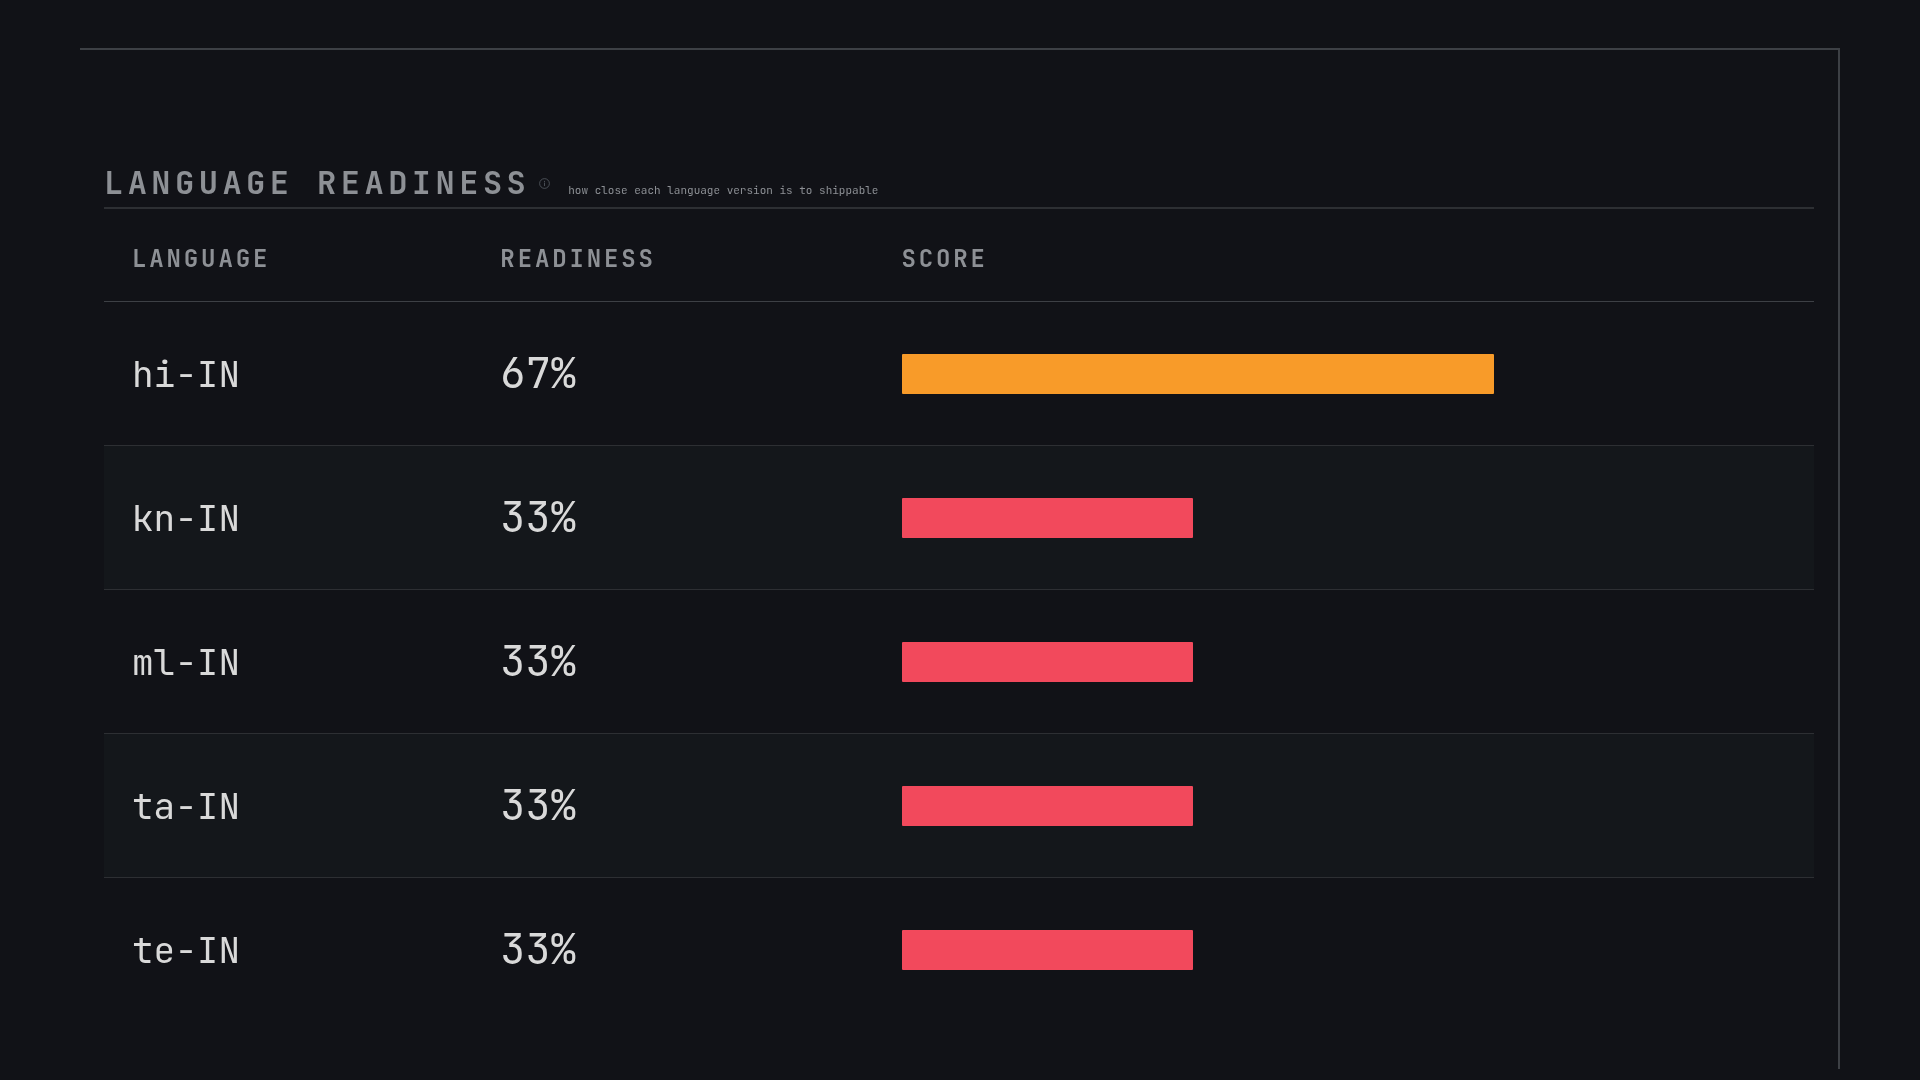
Per-language readiness. Hindi 67%, four dubs 33%. Original-language certification gates clearance of every dubbed version.
-
 GIF
GIF
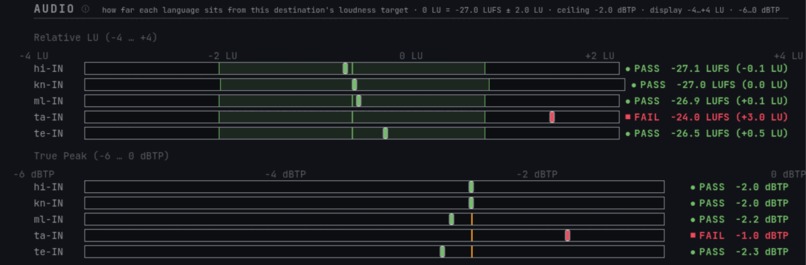
The inversion, animated: the tolerance band redraws to a different width because it is read from the destination spec file.
-
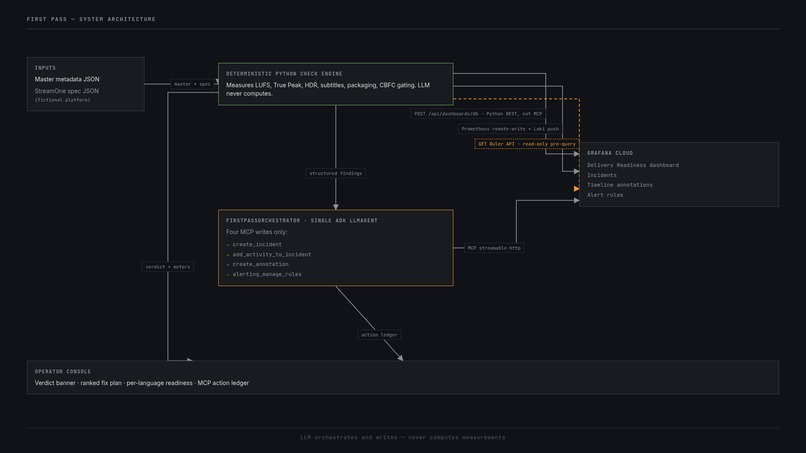
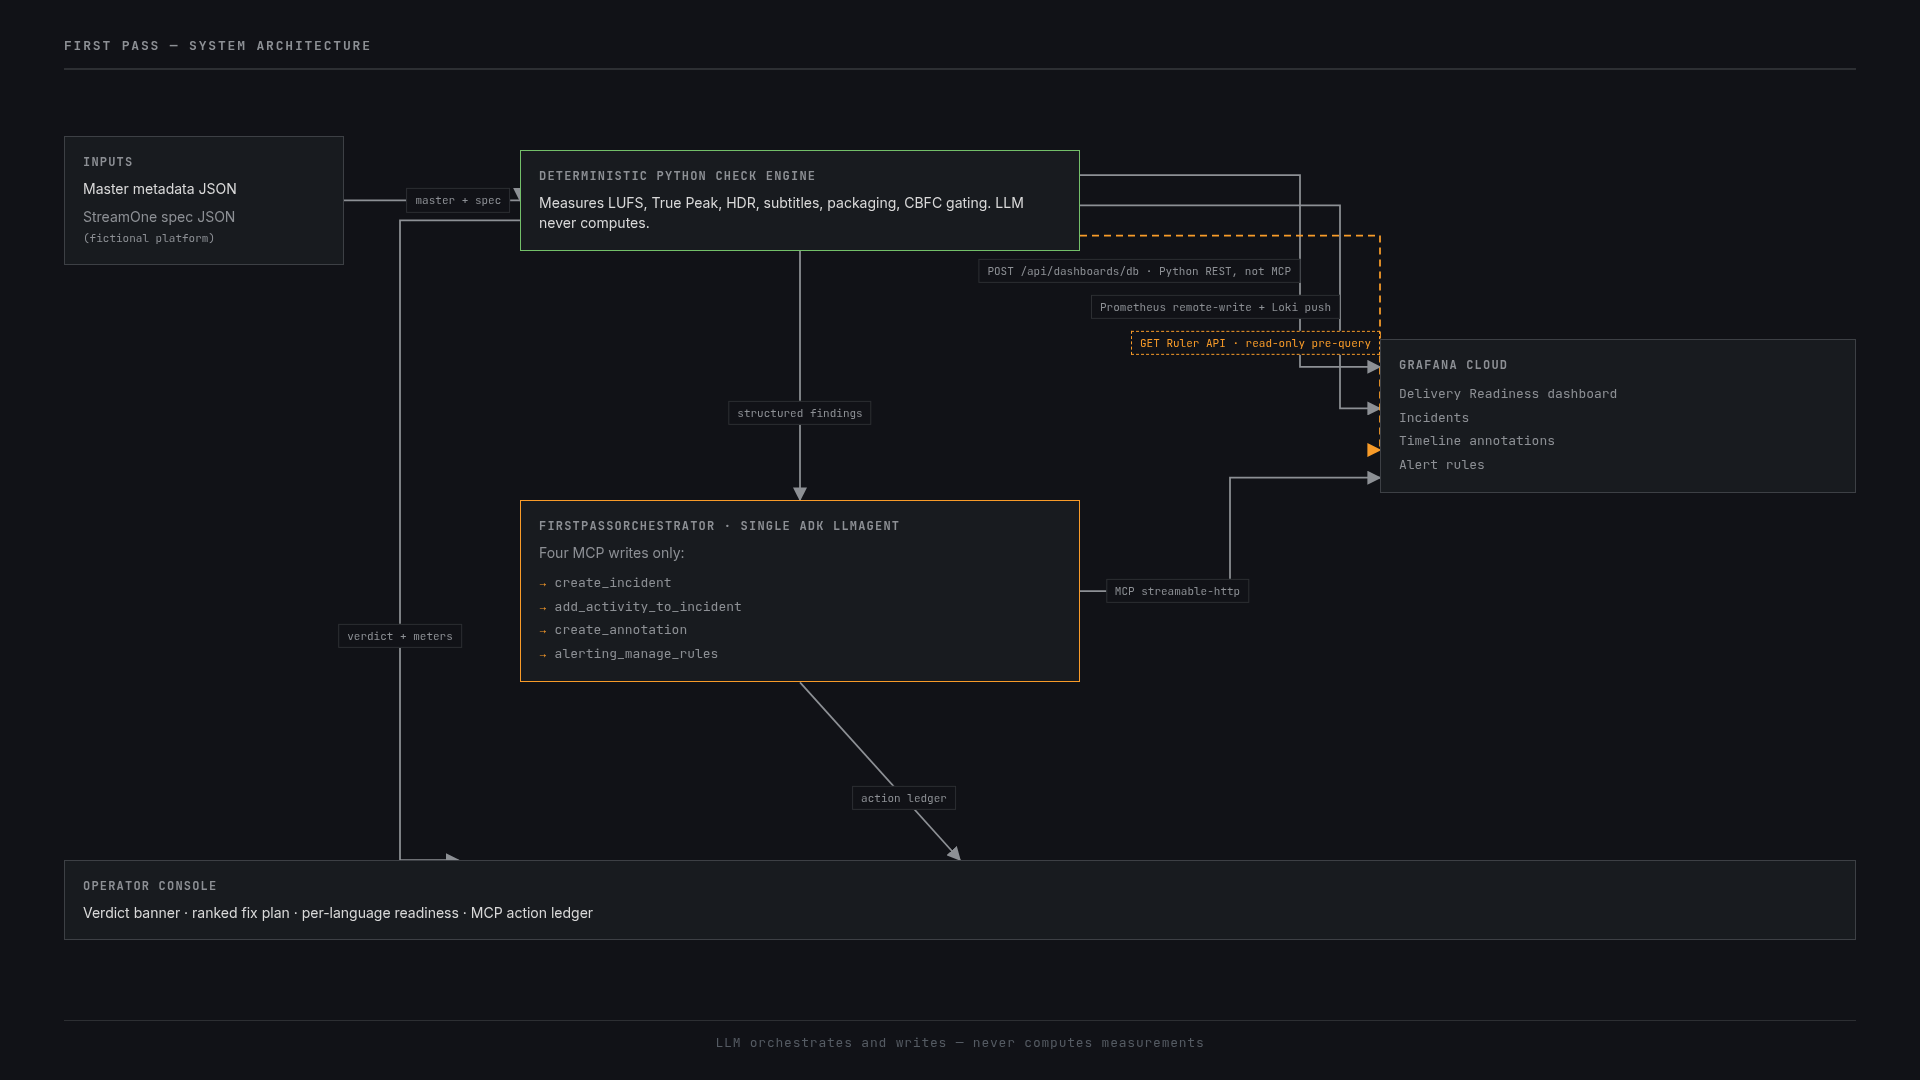
One bounded ADK agent, four allowlisted MCP tools, and deterministic Python the model never touches.
-
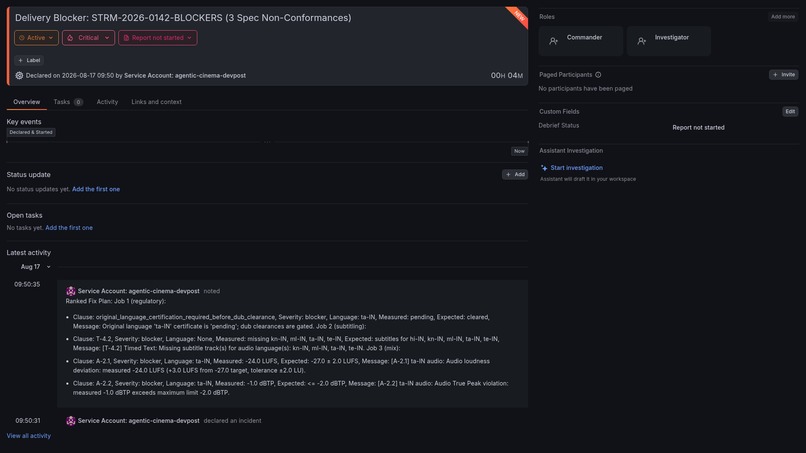
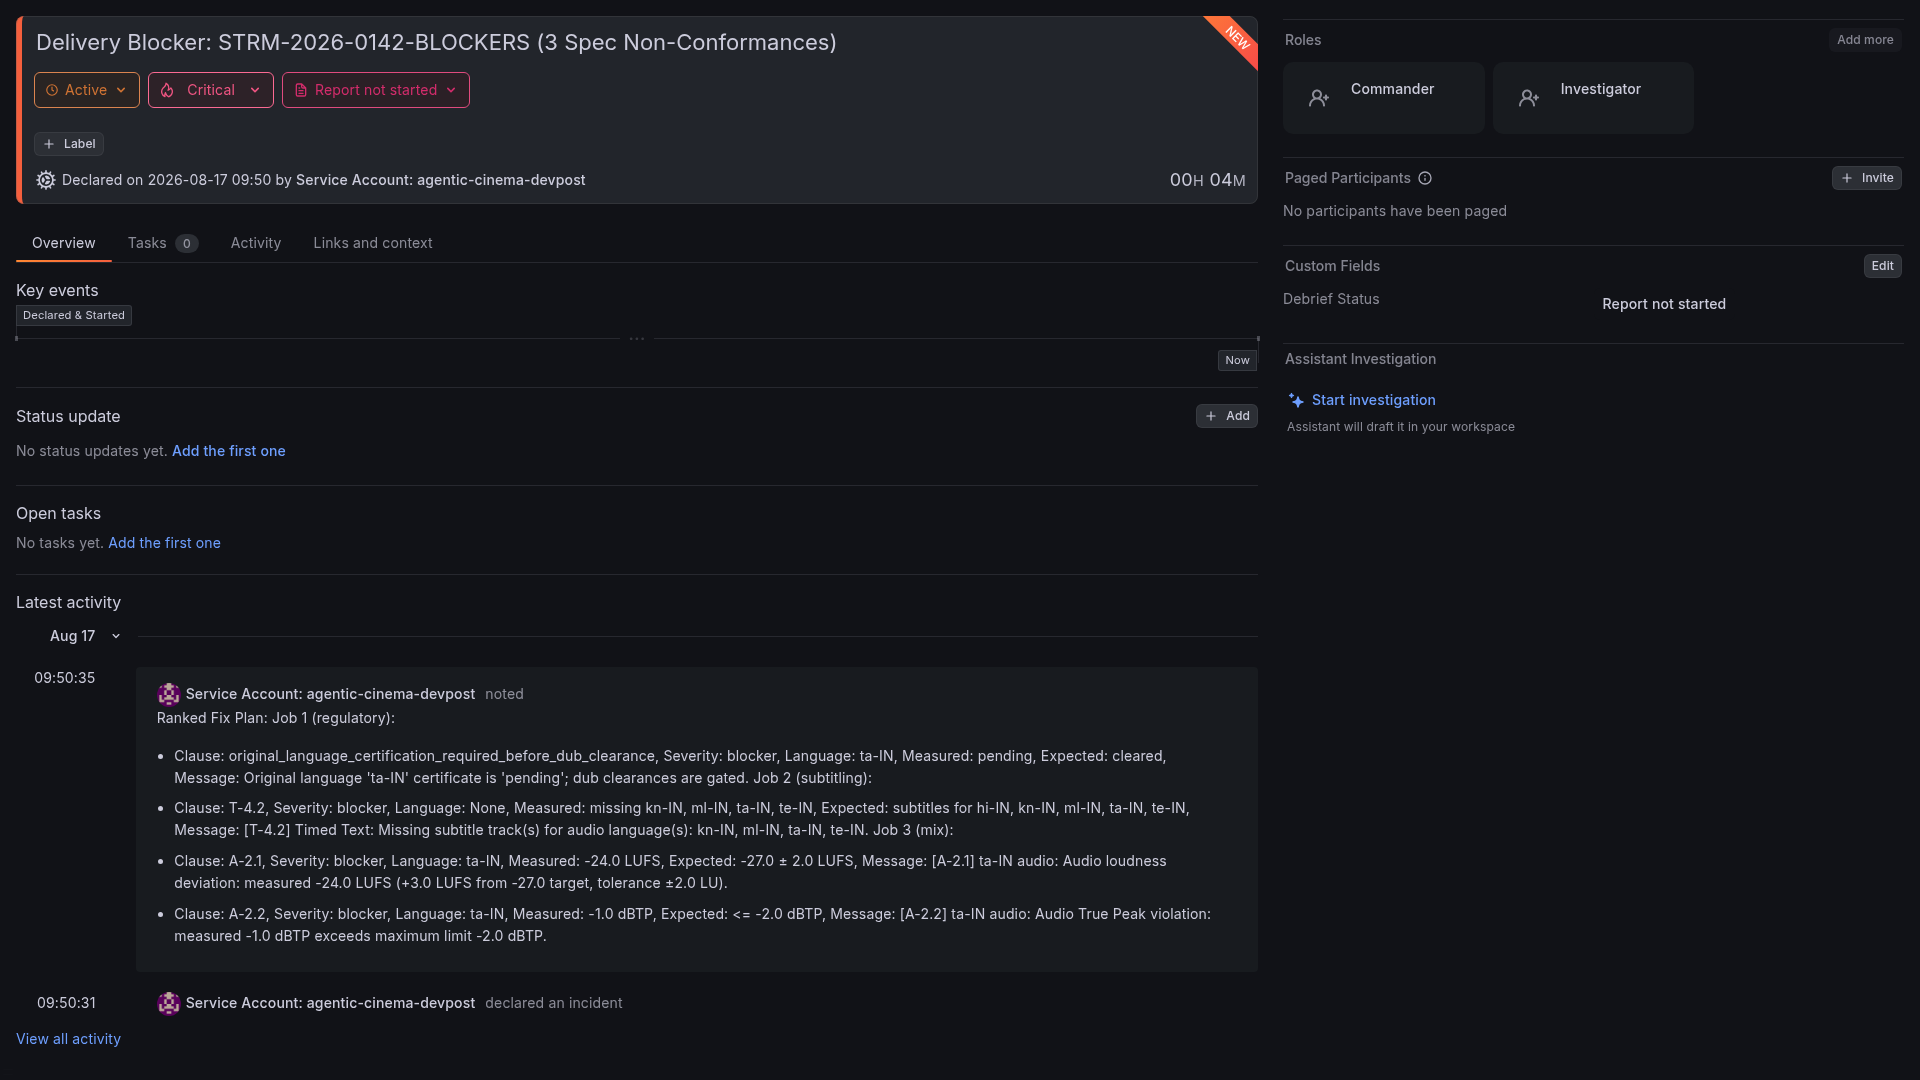
The incident the agent opened, with its ranked fix plan: regulatory certification first, because that takes longest to arrange.
-
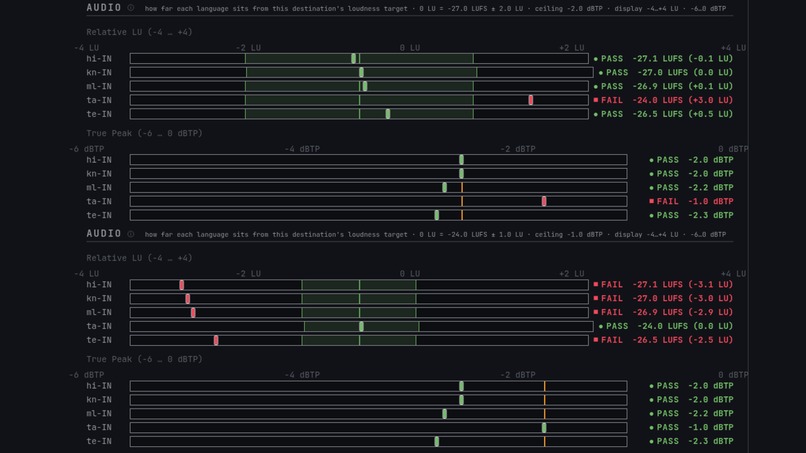
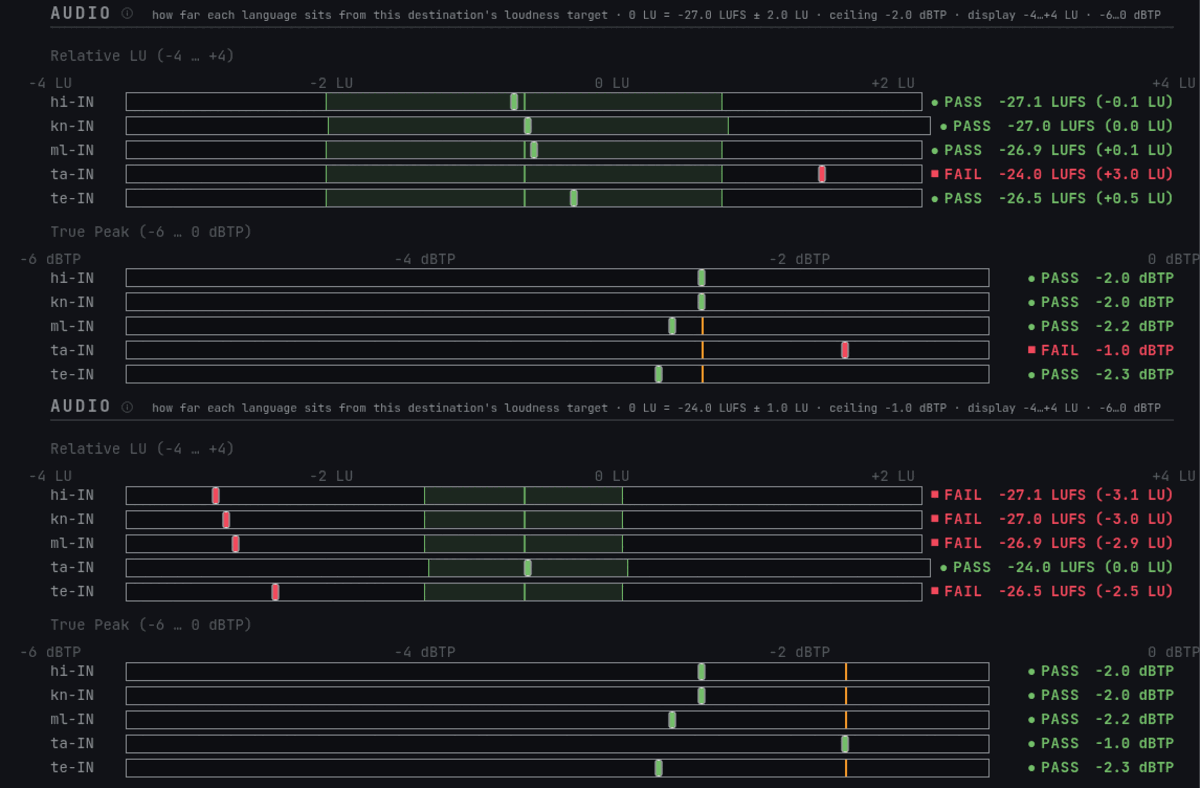
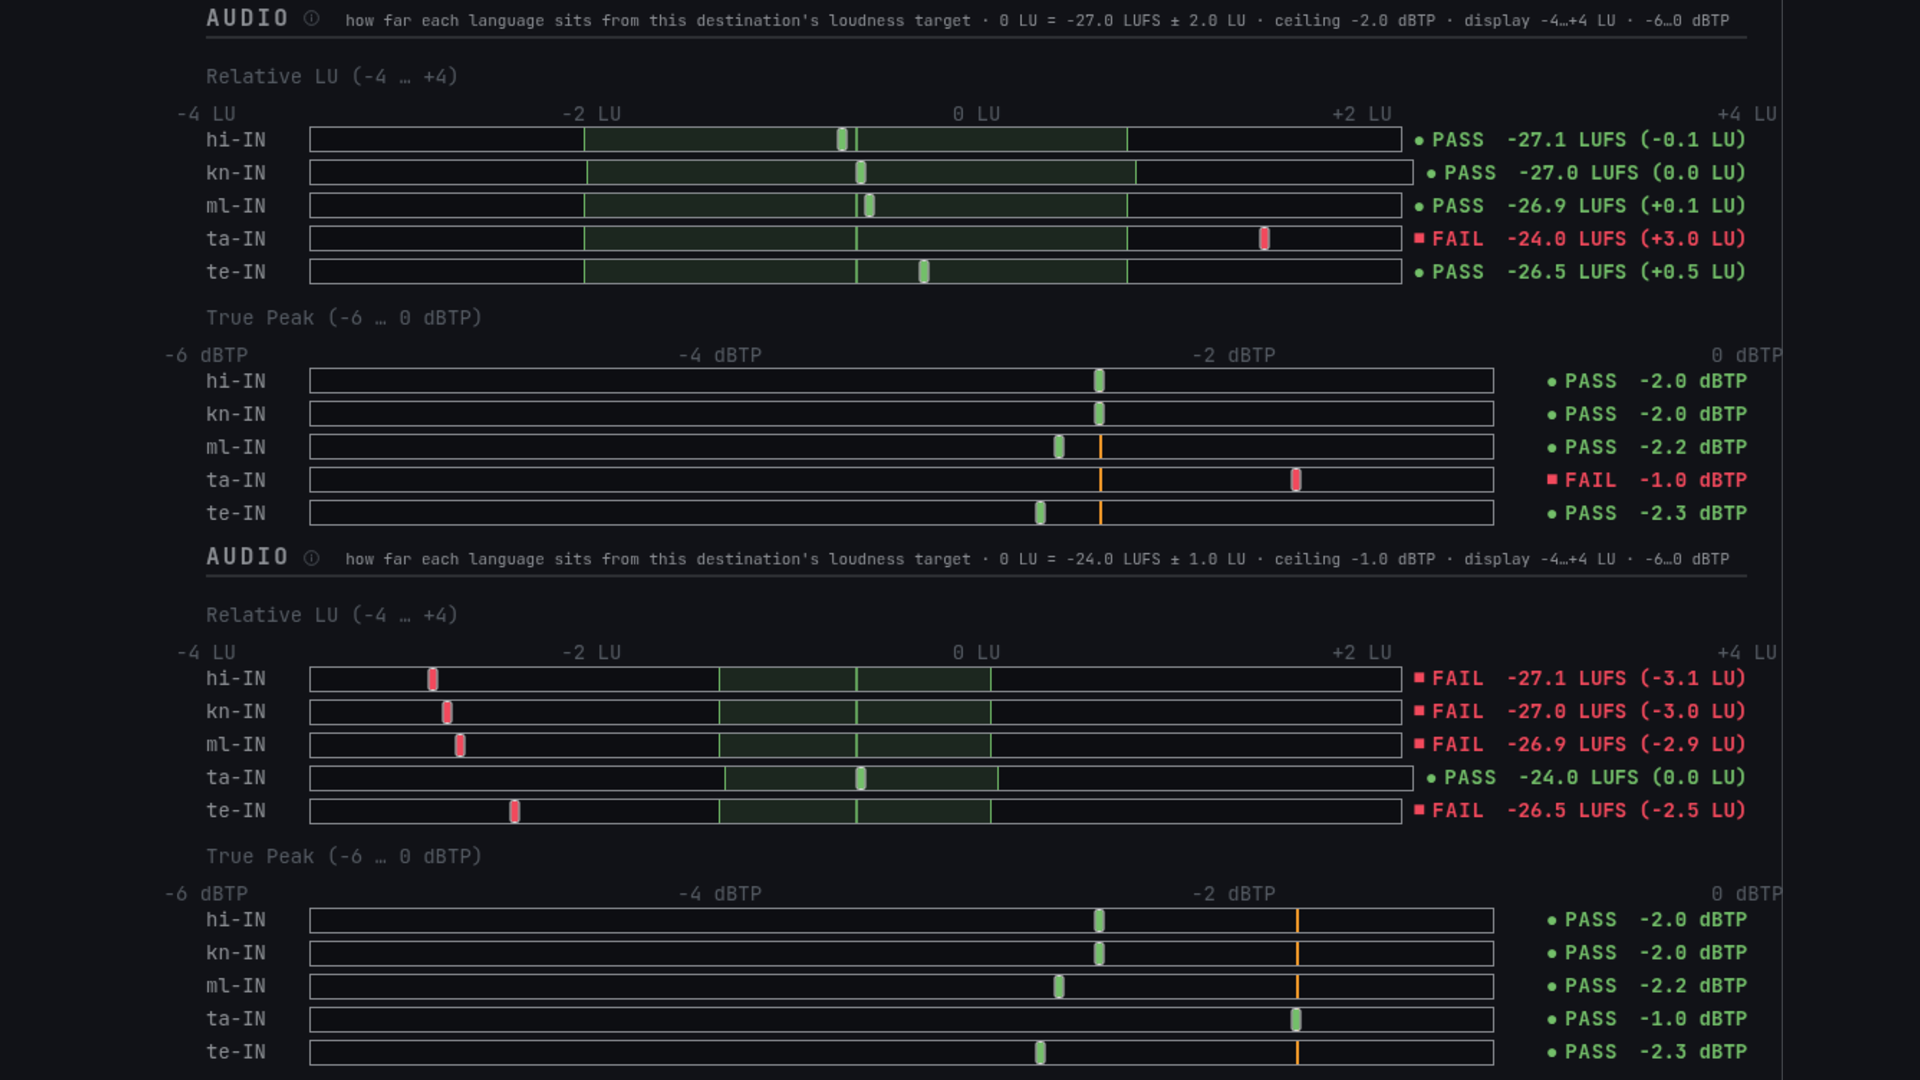
Same master, two destinations. hi-IN passes StreamOne, fails HallArc; ta-IN the reverse. Tolerance comes from the spec, not the code.
Inspiration
Industry commentary from post-production delivery specialists puts first-submission QC failure on major streaming deliveries in the 20–30% range. That figure is directional, an operational observation rather than an official platform statistic, but the failure mode behind it is specific and expensive. The most common cause is mundane. A film is mixed for cinemas at about −24 LUFS, it gets delivered against a streaming spec that demands −27 LUFS, nobody re-measures, and two weeks later the master bounces. Now there are redelivery fees and an announced launch date at risk.
I came to this from software, and it looked instantly familiar: a release bundle failing a client's acceptance criteria. In software I would have a CI pipeline, a dashboard, an alert and an incident for exactly this. Film delivery still runs on a person squinting at a PDF spec.
For Indian releases the stakes compound. A pan-India title ships five simultaneous language versions, and certification of the original language gates clearance of the dubs, so one delay cascades across every version. I built First Pass to treat delivery readiness as what it actually is, which is an observability problem.
What it does
First Pass takes a film master's technical metadata and a target delivery specification, then answers one operator question: will this master pass, or bounce?
The demo ships two fictional destinations, authored as JSON with deliberately different targets. StreamOne wants 0 LU = −27.0 LUFS ±2.0. HallArc wants 0 LU = −24.0 LUFS ±1.0.
That second spec is the whole point. Run the same master against both and the verdict inverts. Hindi at −27.1 LUFS passes StreamOne and fails HallArc. Tamil at −24.0 does the exact opposite. Nothing is hardcoded: the tolerance band is read from the spec file, so the meters redraw at a visibly different width. That is the demonstration that the engine is spec-driven rather than fitted to one platform, and it is the one thing a screenshot cannot carry. You have to watch the meters move.
Evaluation is pure Python (check_engine.py, standard library only, 100% line coverage). I want to be precise about what that means. The engine evaluates values already present in the master's technical metadata against the spec's clauses. It does not decode media itself. A separate ffmpeg ebur128 adapter (agents/measure.py) does real measurement and is proven by 15 tests across WAV, MXF and MOV. The demo masters ship as authored metadata so that runs are deterministic and reproducible.
Audio display follows EBU Tech 3341 EBU Mode: a relative LU scale referenced to the destination target, a tolerance band, and Maximum True Peak. The same engine checks HDR primaries, subtitle coverage, packaging naming, and CBFC certification gating. The LLM never computes a number.
When blockers exist, the findings are assembled into a ranked fix plan ordered by remediation lead time rather than pipeline order. Regulatory certification comes first because it takes longest to arrange, then subtitling, then the audio mix. That ordering is what makes the output actionable instead of a list of complaints.
Then a single Google ADK agent (FirstPassOrchestrator, Gemini 3.7 Flash on Vertex AI) acts inside Grafana Cloud through a six-tool MCP allowlist. On a REJECT it queries Loki (query_loki_logs) for prior hits on the failing clauses and Prometheus (query_prometheus) for the stack-level blocker series, then writes: create_incident, add_activity_to_incident, create_annotation, alerting_manage_rules. Python has already published the Delivery Readiness dashboard over REST and pre-queried the Grafana Ruler API so alert-rule writes stay idempotent. The operator sees PASS likely or REJECT, N blockers, with each blocker traced to its clause, a live ledger of every Grafana write, and in India mode a per-language readiness grid that models certification gating across simultaneous releases.
How I built it
- Agent: one bounded Google ADK
LlmAgent(FirstPassOrchestrator) on Gemini 3.7 Flash via Vertex AI. If that model is unavailable, the run falls back to 3.6 then 2.5 and continues. The rules ask for an AI agent or a network of them; I chose one agent with an audited write surface. I drew the boundary where correctness is not negotiable. The model orchestrates and explains. It does not measure, ship dashboard JSON, or invent expected values. - Grafana MCP: the open-source
grafana/mcp-grafanaserver, self-hosted in Docker with a service-account token, connected via ADK'sMcpToolsetover streamable HTTP. This is the configuration the Grafana track resources page explicitly directs to this case: "If your project requires a fully unattended server-side agent, use the open-source Grafana MCP server with a service-account token instead", because "the hosted Grafana Cloud MCP server authenticates users interactively, there is no service-account or machine-token option." First Pass runs unattended on a schedule, so the hosted endpoint was never an option. The agent'stool_filterallowlist is deliberately stricter than the server's own--enabled-toolsset. - Kept out of the model: the dashboard publish (
POST /api/dashboards/db) and the Ruler API pre-query for alert-rule idempotency. Moving that JSON out of the LLM, and forcing function calling on turn 1, took orchestration reliability from 0/4 to 5/5 consecutive clean runs. - Ground truth: after every run the orchestrator asserts that the agent did not fabricate measured or expected values in its tool calls (
assert_ground_truth_preservation). - Invariants:
scripts/check-invariants.shruns 16 labelled deterministic checks, several of them defect-tested, including spec conformance (the code must satisfy the constraintsAGENTS.mddeclares) and documentation-claim checks.scripts/doc_conformance.pyis the extracted, unit-tested scanner behind checks 14 to 16. - Telemetry: Prometheus remote-write for metrics, Loki push API for structured per-finding logs, with fixed low-cardinality label sets.
- Hosting: one GCE VM behind HTTPS carries the operator console, the agent and the MCP server. The MCP listener is bound to loopback and is unreachable from the internet. Credentials live in a gitignored
.env, read by systemd as anEnvironmentFileon the VM.
Challenges I ran into
Unattended Grafana was the first architectural fork. The hosted Cloud MCP endpoint is interactive-OAuth only, so a machine-token agent has to self-host grafana/mcp-grafana, which is also what Grafana documents for this case.
Then I hit Google ADK issue #2615: adk agent hangs when using MCPToolset to connect to a remote streamable HTTP MCP Server hosted in Cloud Run. Putting the agent on Cloud Run against a remote MCP server was a hang, not a config typo. It cost me a day before I found the issue. The working topology is one GCE VM where the ADK process and the MCP container share a host, MCP on loopback, console on HTTPS.
Asking the model to carry a 10KB dashboard JSON payload through tool calls produced empty bodies and HTTP 400s. Publishing the dashboard in Python, and forcing function calling on the first turn, is what moved the run from 0/4 to 5/5. The same discipline applies to metrics: unique run IDs stay in Loki payloads and never in Prometheus labels, or the free tier's cardinality budget is gone in an afternoon.
Accomplishments I'm proud of
The two-destination inversion. One master, two spec files, opposite verdicts per language, and the loudness meters redraw to a different tolerance width because the band comes from the spec rather than the code.
An unattended path from master metadata to a Grafana incident and annotation, with the blocker alert rule created on the first run and verified idempotently after that. The operator console shows the same verdict a judge can open on the hosted URL, and the Delivery Readiness dashboard is public, so nobody needs an account to check the numbers. No manual Grafana clicks anywhere in the loop.
A small, audited MCP write surface of four tools, with the model kept out of anything that has to be correct, and a reliability number attached to that decision: 0/4 to 5/5.
Defence in depth that is visible in the repo rather than claimed in a README: the server's --enabled-tools set, the agent's stricter six-tool filter, loopback MCP, a gitignored .env, and 16 invariant checks that will fail a push if the architecture drifts from what AGENTS.md declares.
What I learned
The useful question was never "how many agents". It was "what is the model allowed to touch". Incident narrative and annotation text belong there. Loudness, True Peak, dashboard JSON, and whether an alert rule already exists do not.
Grafana's hosted MCP endpoint is built for a human in a browser. An unattended agent needs the self-hosted server and a service-account token, and it needs to sit next to that server, because ADK's streamable-HTTP MCP client does not survive Cloud Run in front of a remote MCP URL.
Delivery QC is not a generic classifier. EBU Mode meters and pan-India certification gating are first-class constraints. If they are not in the check engine, they are not in the product.
What's next for First Pass
Deeper validation against real package formats. The natural next step is IMF-level checking, where Netflix's open-source Photon validator sets the reference. After that: more platform specs so a single master can be checked against several destinations at once, aggregator-facing workflows for teams delivering many titles, and closing the loop by learning from real rejection outcomes to predict pass probability before submission.
Data sources
All master metadata and delivery specs in this project are synthetic. I authored them for the project, modelled on real, publicly documented structures: MediaInfo and ffprobe-style technical metadata, and publicly published platform delivery specifications. Both demo platforms, StreamOne and HallArc, are fictional. No proprietary studio material, no confidential rejection reports and no third-party media assets were used. All telemetry comes from the project's own check runs.


Log in or sign up for Devpost to join the conversation.