The problem
Great Britain has about 24 GW of solar panels. Their output can change by several GW from one day to the next. Grid operators keep gas plant in reserve to cover that change. A forecast with one line does not tell them how much reserve is enough. Too much reserve burns gas. Too little reserve puts the grid at risk.
What it does
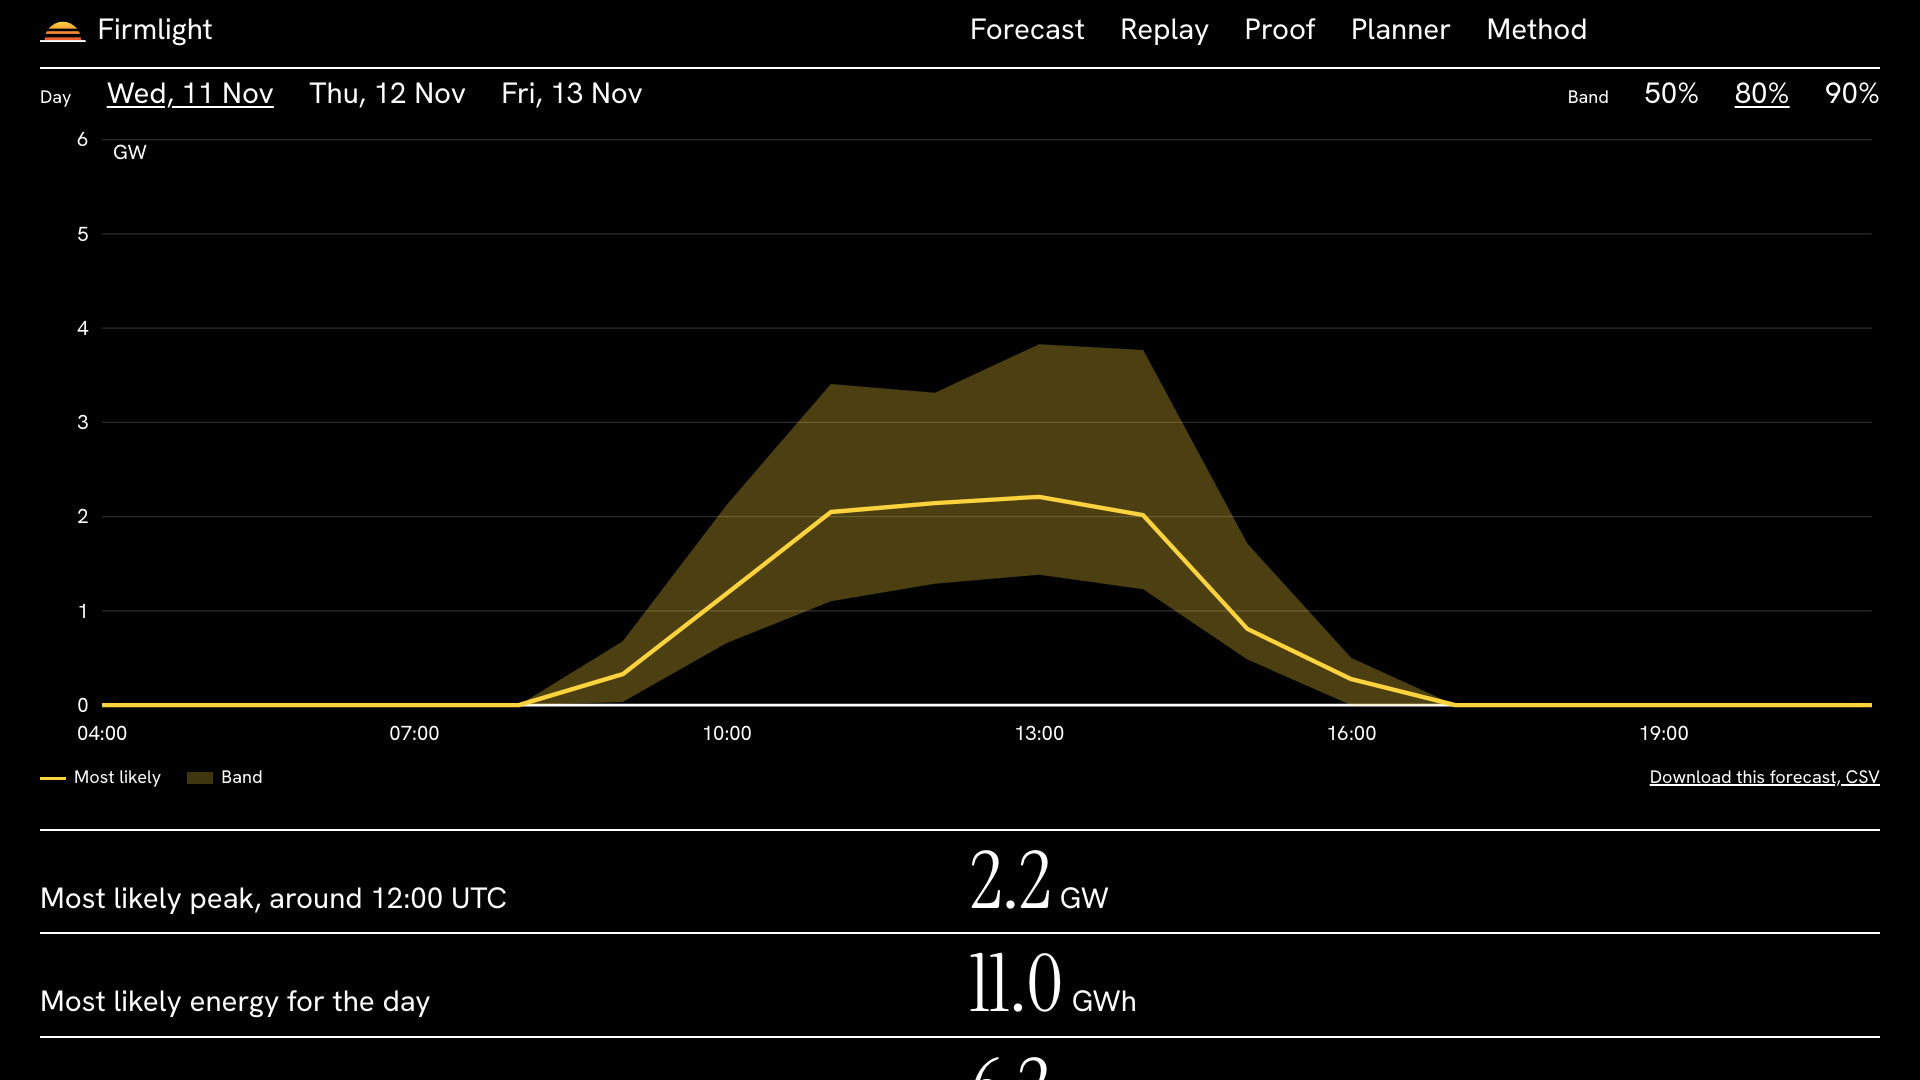
Firmlight forecasts national solar output for each hour, 1, 2 and 3 days ahead. Each hour has a most likely value and 50, 80 and 90 percent bands. The bottom of the band is the firm line. An operator can commit that much solar and hold the rest in reserve.
In the demo you can do these things.
- See the forecast for tomorrow. Your browser computes it on each visit with the same trees that Python trained.
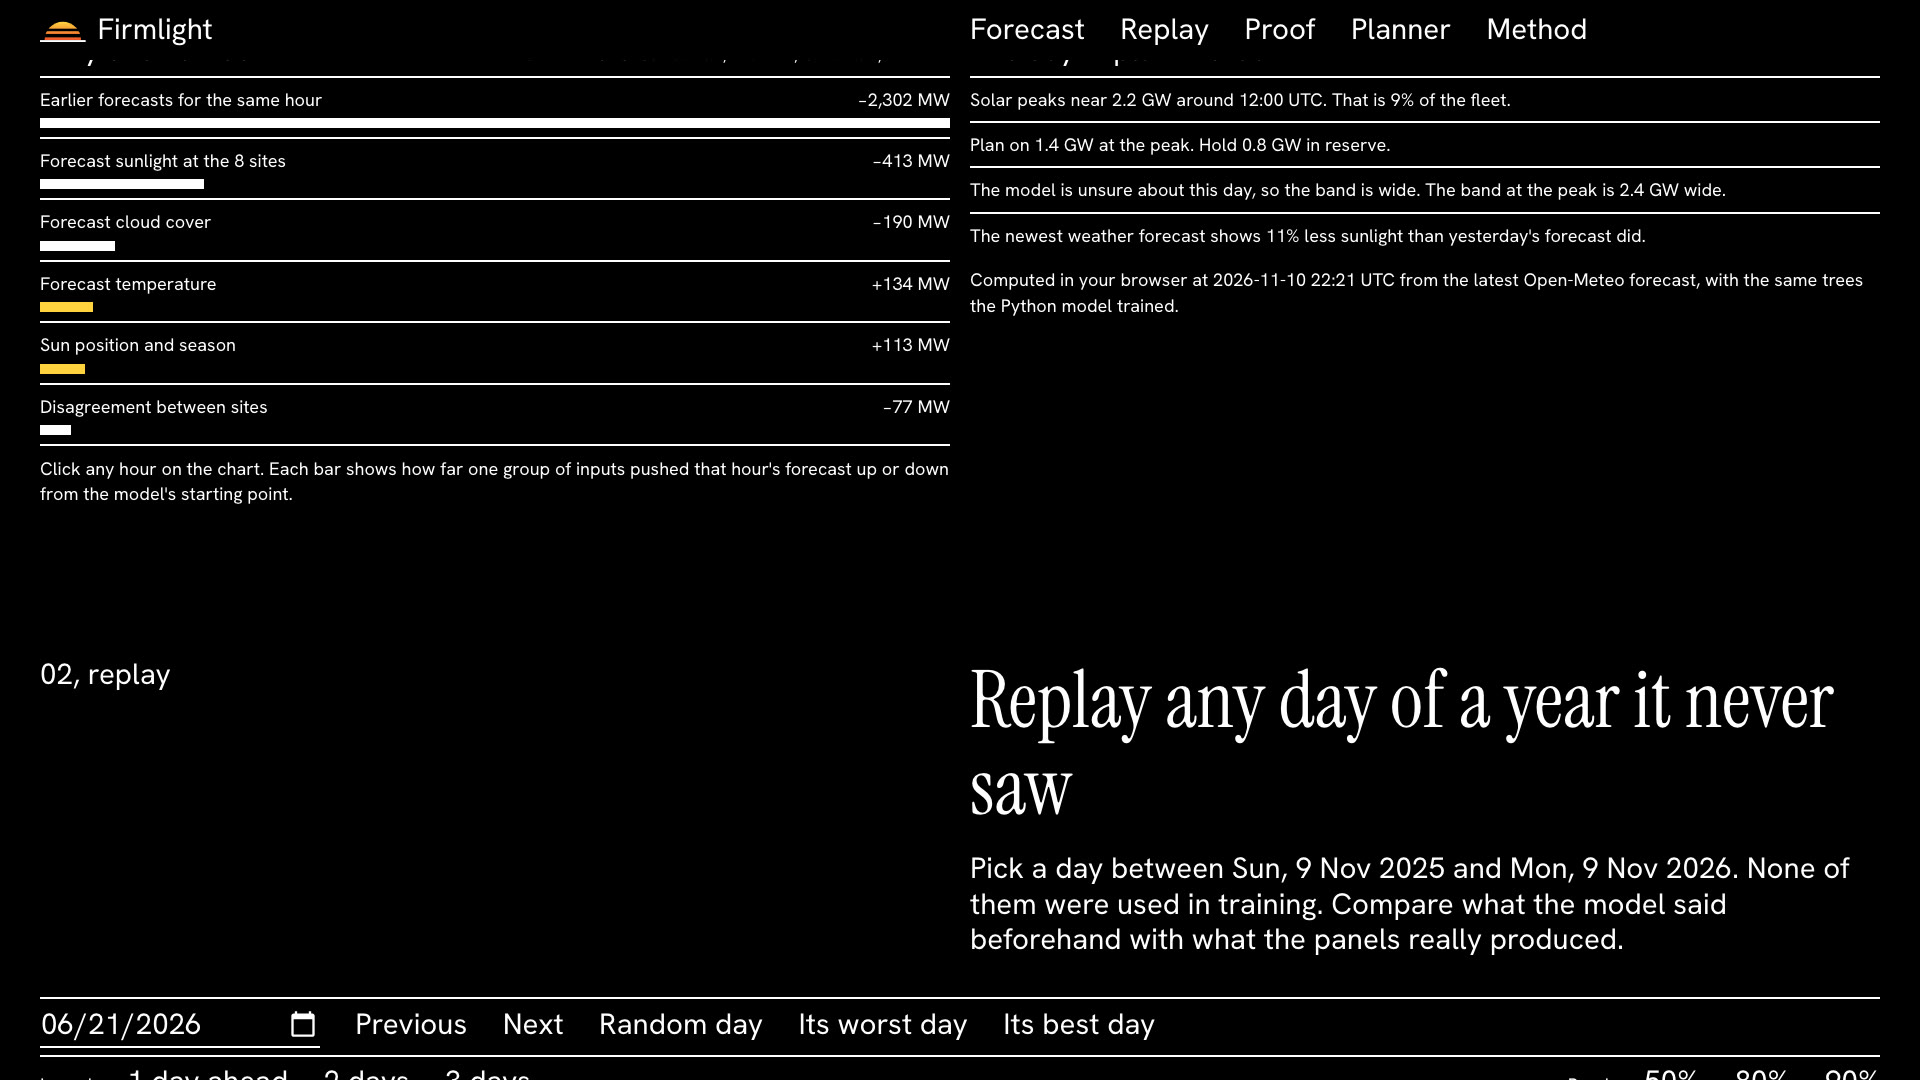
- Click any hour and see why the model gave that number.
- Read the day in plain words. It gives the peak, the firm power and the reserve to hold.
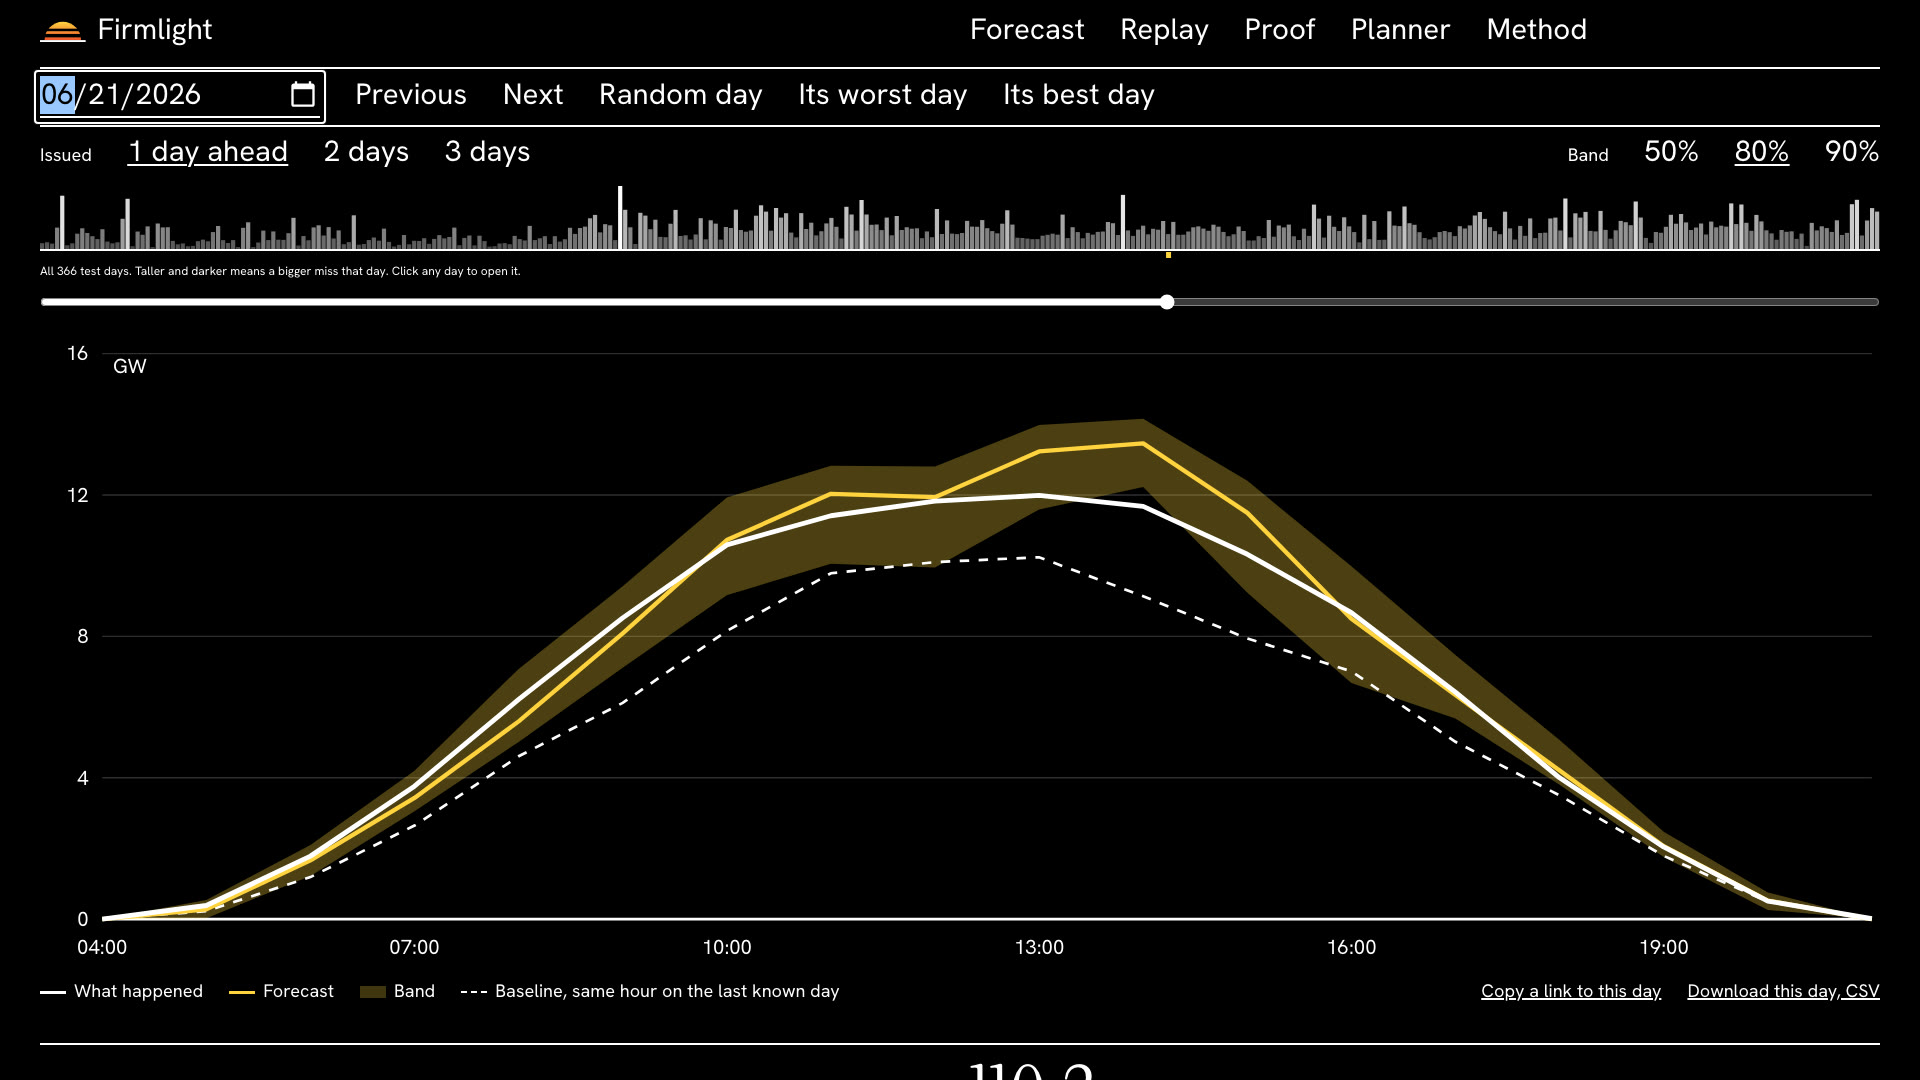
- Replay any of 366 unseen days against the real output. You can jump to the worst day.
- Read the scorecard. It has three bars that were written before training.
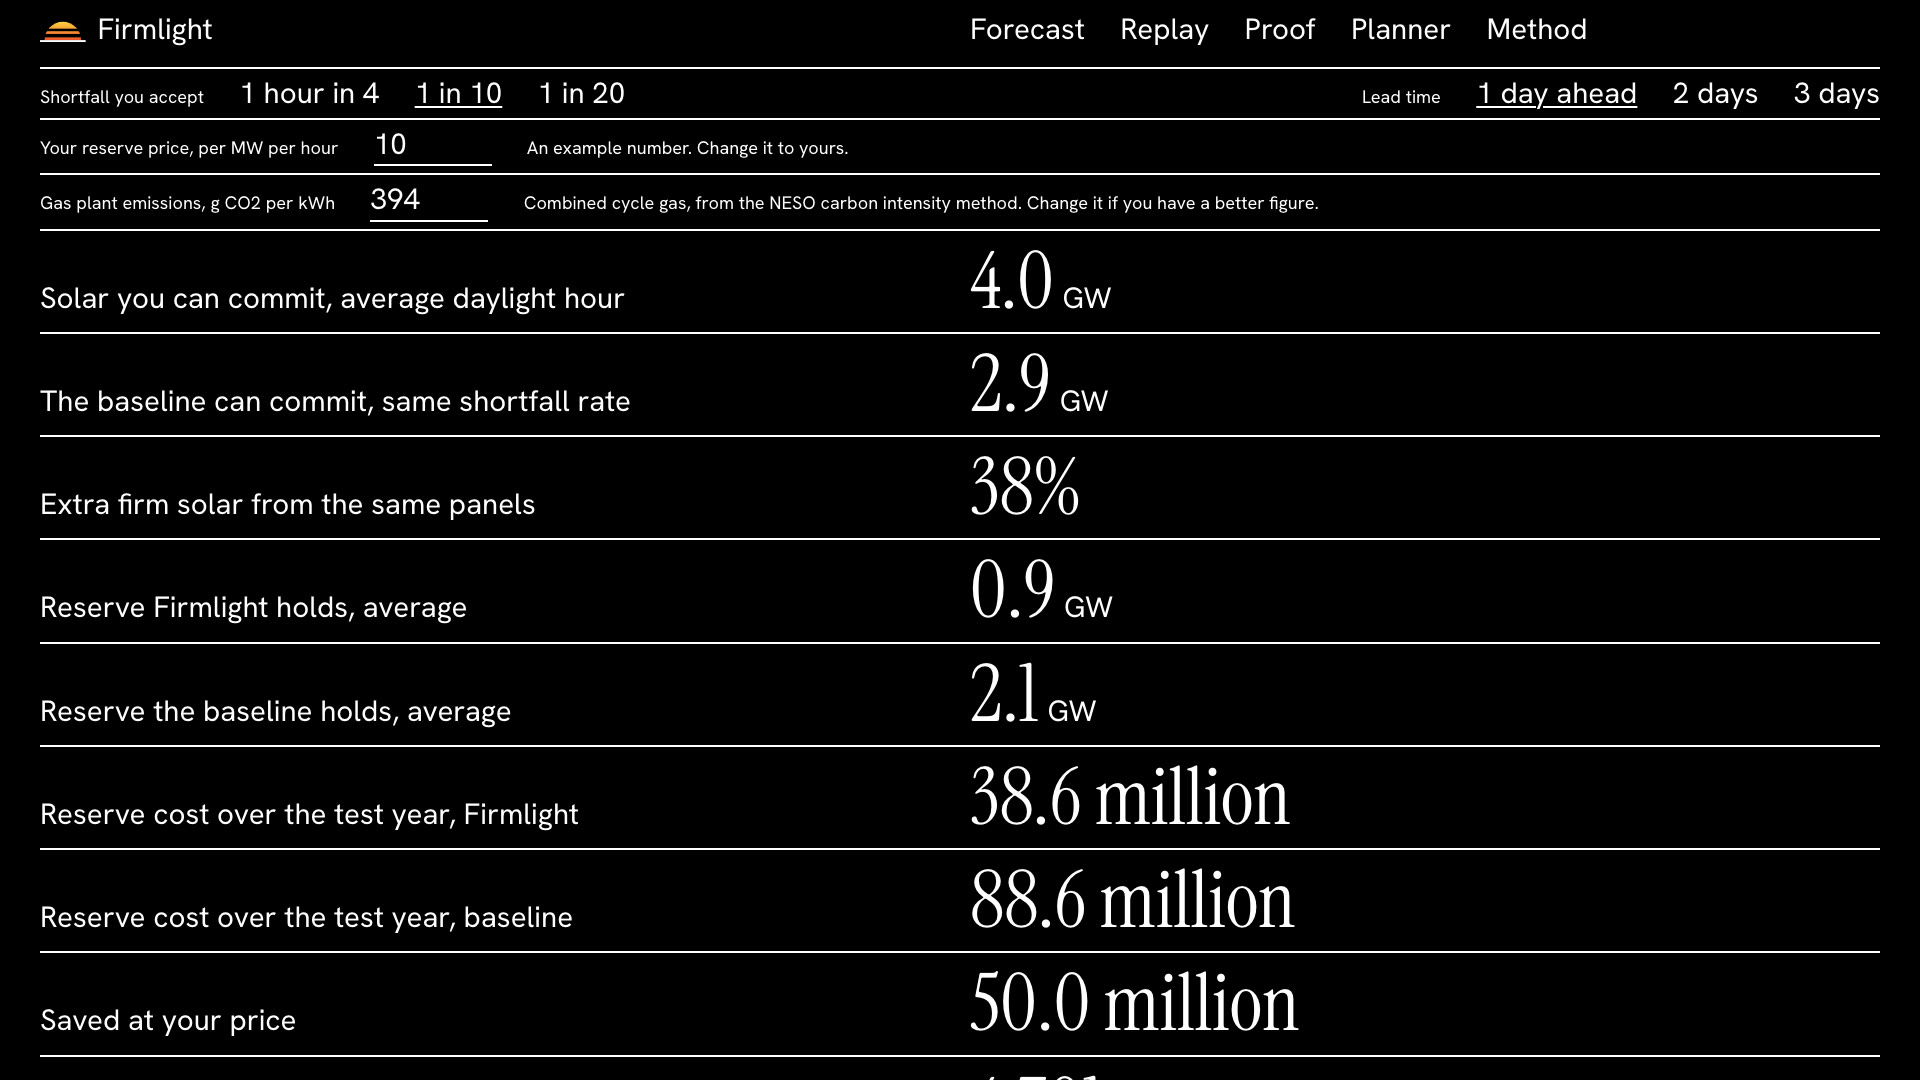
- Use the planner. Choose a shortfall risk and a reserve price. It gives the firm power, the reserve cost and a CO2 ceiling.
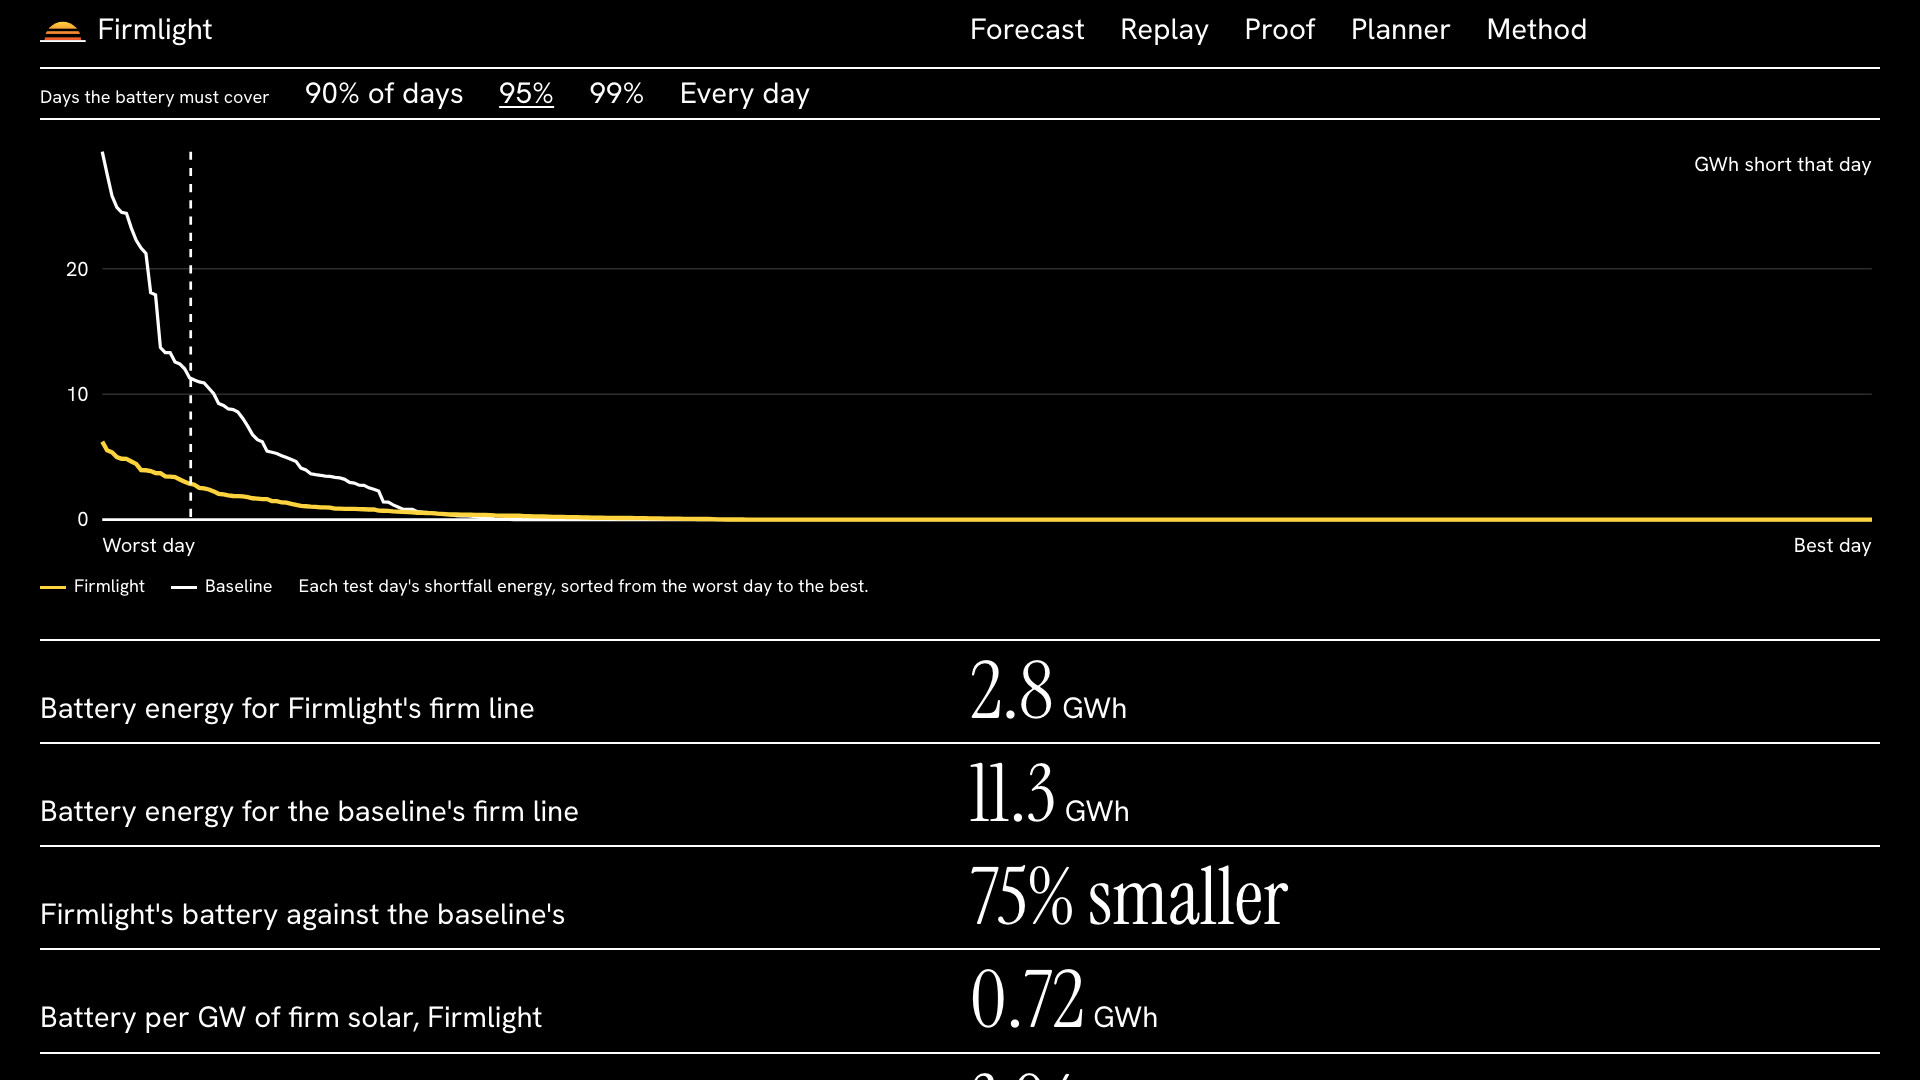
- Size the battery that covers the hours that still come in short.
- Pick one of 14 grid regions. A second, pooled model forecasts each region, and the browser computes all 14 for tomorrow.
How the AI works
- Model. Gradient boosted quantile regression in scikit-learn. There are 7 quantile models for each lead time. The target is capacity factor.
- Inputs. Forecast sunlight, cloud and temperature at 8 sites, the spread between sites, the sun position, and the older forecasts of the same hour.
- Calibration. Conformalized quantile regression on held-out days. It widens each band until the band holds.
- Live inference. The day-ahead trees are exported to JSON. The browser runs them on the newest Open-Meteo forecast. A self-test on the page shows that the browser copy matches Python.
- Explanation. For each hour the page adds up how far each group of inputs moved the forecast. The parts sum to the forecast.
Data
- Generation and capacity come from Sheffield Solar PV_Live, Jan 2024 to Nov 2026.
- Weather comes from the Open-Meteo Previous Runs archive. These are the forecasts as they were issued 1, 2 and 3 days before. The test is fair because the model sees only what was known at that time.
- Both sources are open. There is no synthetic data and no personal data.
Results
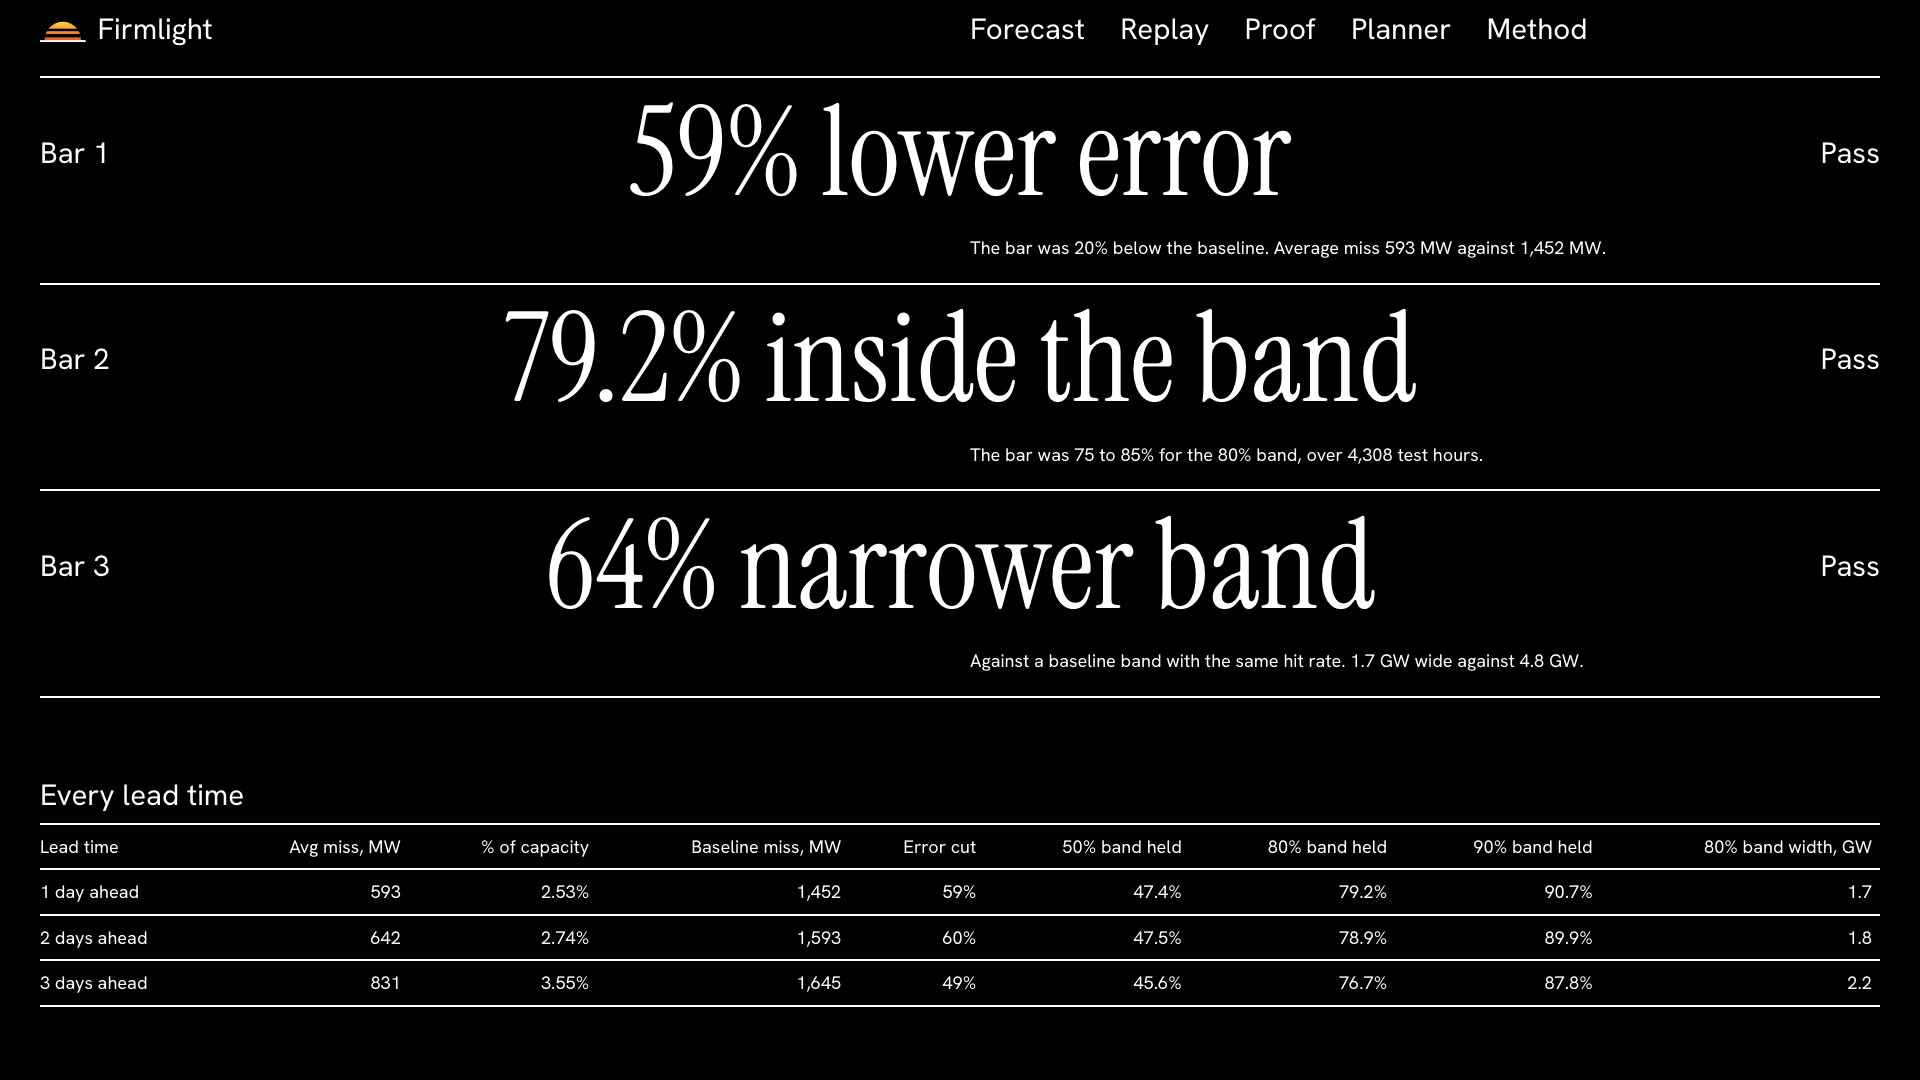
I wrote three pass or fail bars before training. The test set is the last 12 months. It has 4,308 daylight hours. The model did not see them during fitting or tuning. These are the day-ahead results.
- The error is 59 percent lower than the baseline. The average miss is 593 MW. The baseline misses by 1,452 MW. The bar was 20 percent.
- The 80 percent band held 79.2 percent of the time. The bar was 75 to 85 percent.
- The band is 64 percent narrower than a baseline band with the same hit rate.
At 2 days ahead the average miss is 642 MW. At 3 days ahead it is 831 MW.
The regional model had its own bars, written before I downloaded the regional data. All 14 of 14 regions beat the baseline. The error is 47 to 52 percent lower. The 80 percent band held 77.9 percent across all regions, and 13 of 14 regions are inside the 75 to 85 percent range.
Environmental benefit
- With the firm line, an operator can commit 4.0 GW of solar on an average daylight hour. The baseline can commit 2.9 GW at the same risk. That is 38 percent more.
- Over the test year that is about 4,699 GWh of extra solar that needs no backup.
- If all of it replaced gas plant at 394 g CO2 per kWh, the ceiling is about 1.85 million tonnes of CO2 in a year. The factor is from the NESO carbon intensity method. Real grids replace less than all of it, so this number is a ceiling and not a claim.
- Firmlight also holds less reserve. The planner in the demo shows the figures for each risk level.
Limits
- I changed the model once after the first test run. The gain is provisional. Version 1 missed by 744 MW. I found that the 2 day old sunlight forecast follows real output better than the 1 day old forecast (correlation 0.953 against 0.942 in the training period). Each model now reads the older forecasts too.
- I tried a separate band offset for each kind of sky. Overcast coverage moved from 86.1 to 79.4 percent. Mixed skies fell from 76.9 to 71.0 percent. I reverted it.
- The model forecasts the national fleet. It does not forecast one plant.
- The training data covers 22 months. The national model uses 8 weather points. Each region uses 1 weather point.
- The browser computes tomorrow only. The forecasts for 2 and 3 days ahead are made when the site is built.
What is next
Bands that adapt to the sky, more weather points for each region, and browser inference for all three lead times.
Who made it
One student. I used AI coding assistance.
Two minute walkthrough of the demo: https://youtu.be/S4hVkfEX2Tk Slides: https://firmlight-solar.vercel.app/Firmlight.pptx Code: https://firmlight-solar.vercel.app/firmlight-code.zip
