Inspiration
We like flamegraphs, and they are basically the industry standard for performance debugging and optimization of an application. Their strength, but also limitation, is that they look only at a single running application.
A problem in modern systems is that of the "noisy neighbor" - your application can slowdown due to activity from another application that isn't in your control.
What it does
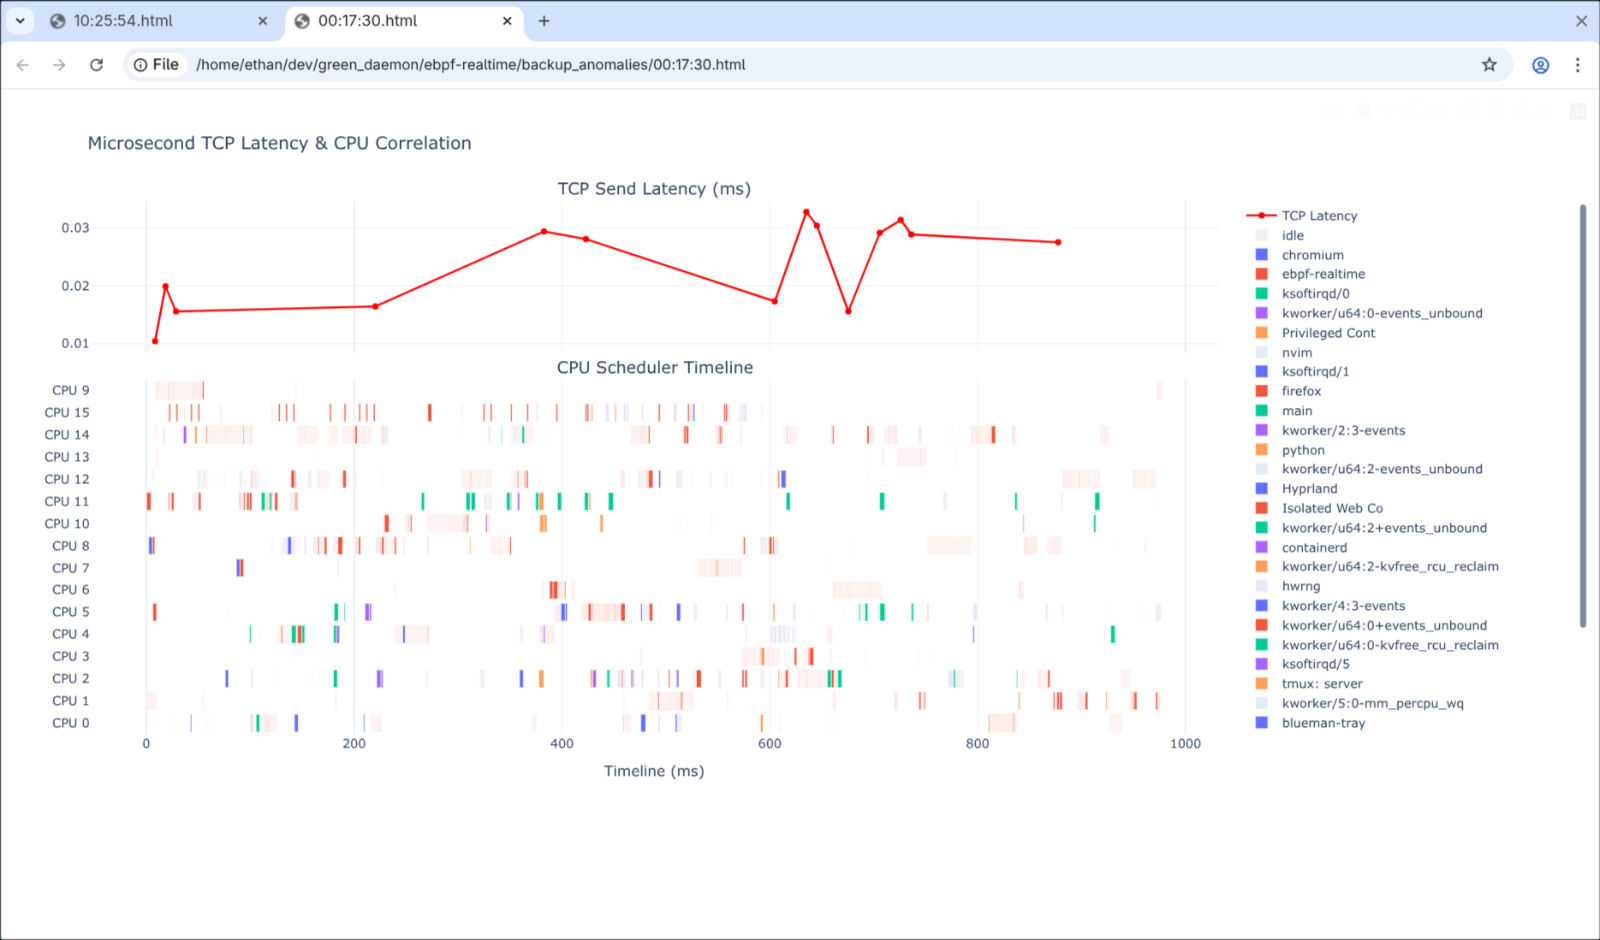
We use modern kernel features (eBPF) to monitor TCP latency in real time, detecting latency anomalies (spikes) that may slow an application (e.g., web service running HTTP) down. When a spike happens, we generate a human-readable "Firework Graph" that captures all process activity across all cores at the time during the latency spike.
How we built it
We wrote custom eBPF programs that insert into the kernel, sending scheduler events (this tells us what was scheduled on a given CPU at any point in time) and TCP requests (this allows us to capture the latency). These are processed asynchronously by our program that runs some analytics on the data (e.g., detecting what constitutes a latency spike) and generates the resulting graph that is shown to the user, allowing them to dig through kernel activity that occurred during performance degradation.
Challenges we ran into
Kernel debugging lmao.
Accomplishments that we're proud of
Kernel debugging.
What we learned
How to kernel debug.
What's next for Firework Graphs
Make it fast, make it general (not just TCP latency).

Log in or sign up for Devpost to join the conversation.