Inspiration
Satellite data can help people study possible wildfires, but raw detections can be difficult to understand. A point on a map does not explain how recent the observation is, why it deserves attention, or which data supports it. We built FireWatch AI to bring these details together. Our goal is to help researchers explore satellite observations and understand the evidence behind each result.
What it does
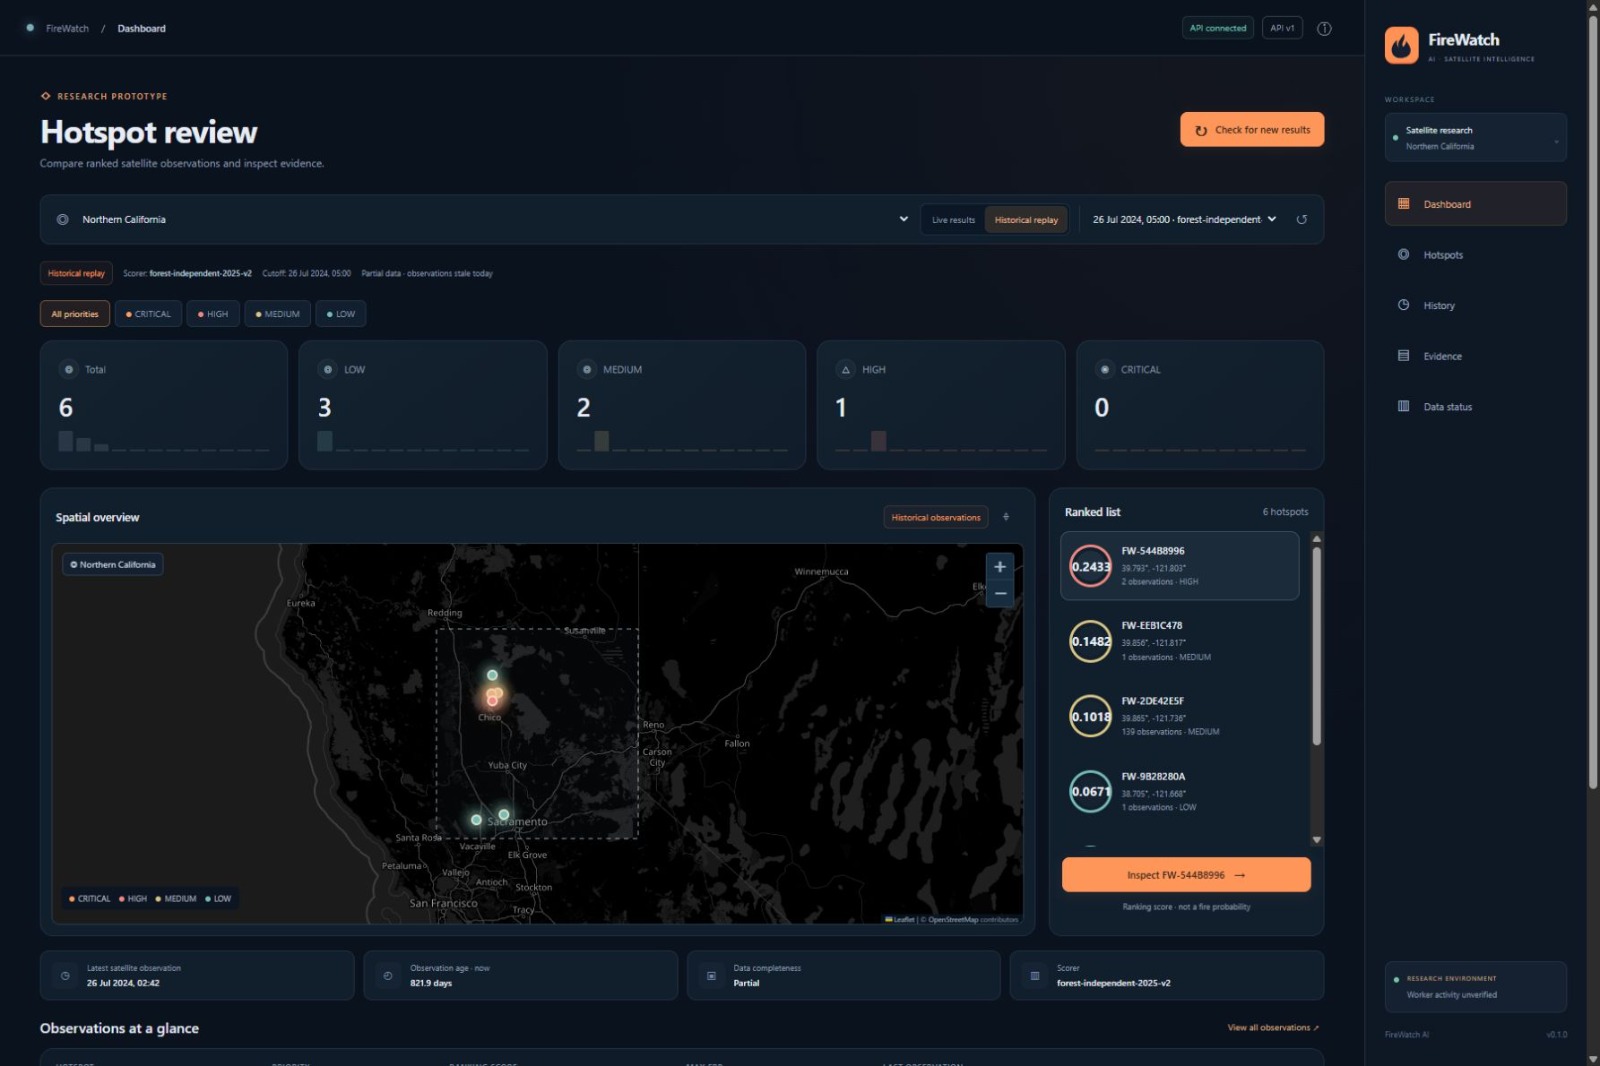
FireWatch AI is a research dashboard for reviewing satellite heat observations.
It collects near-real-time data from NASA FIRMS using the NOAA-20 and NOAA-21 satellites. It groups recent observations into hotspots and assigns ranking scores for review.
Users can:
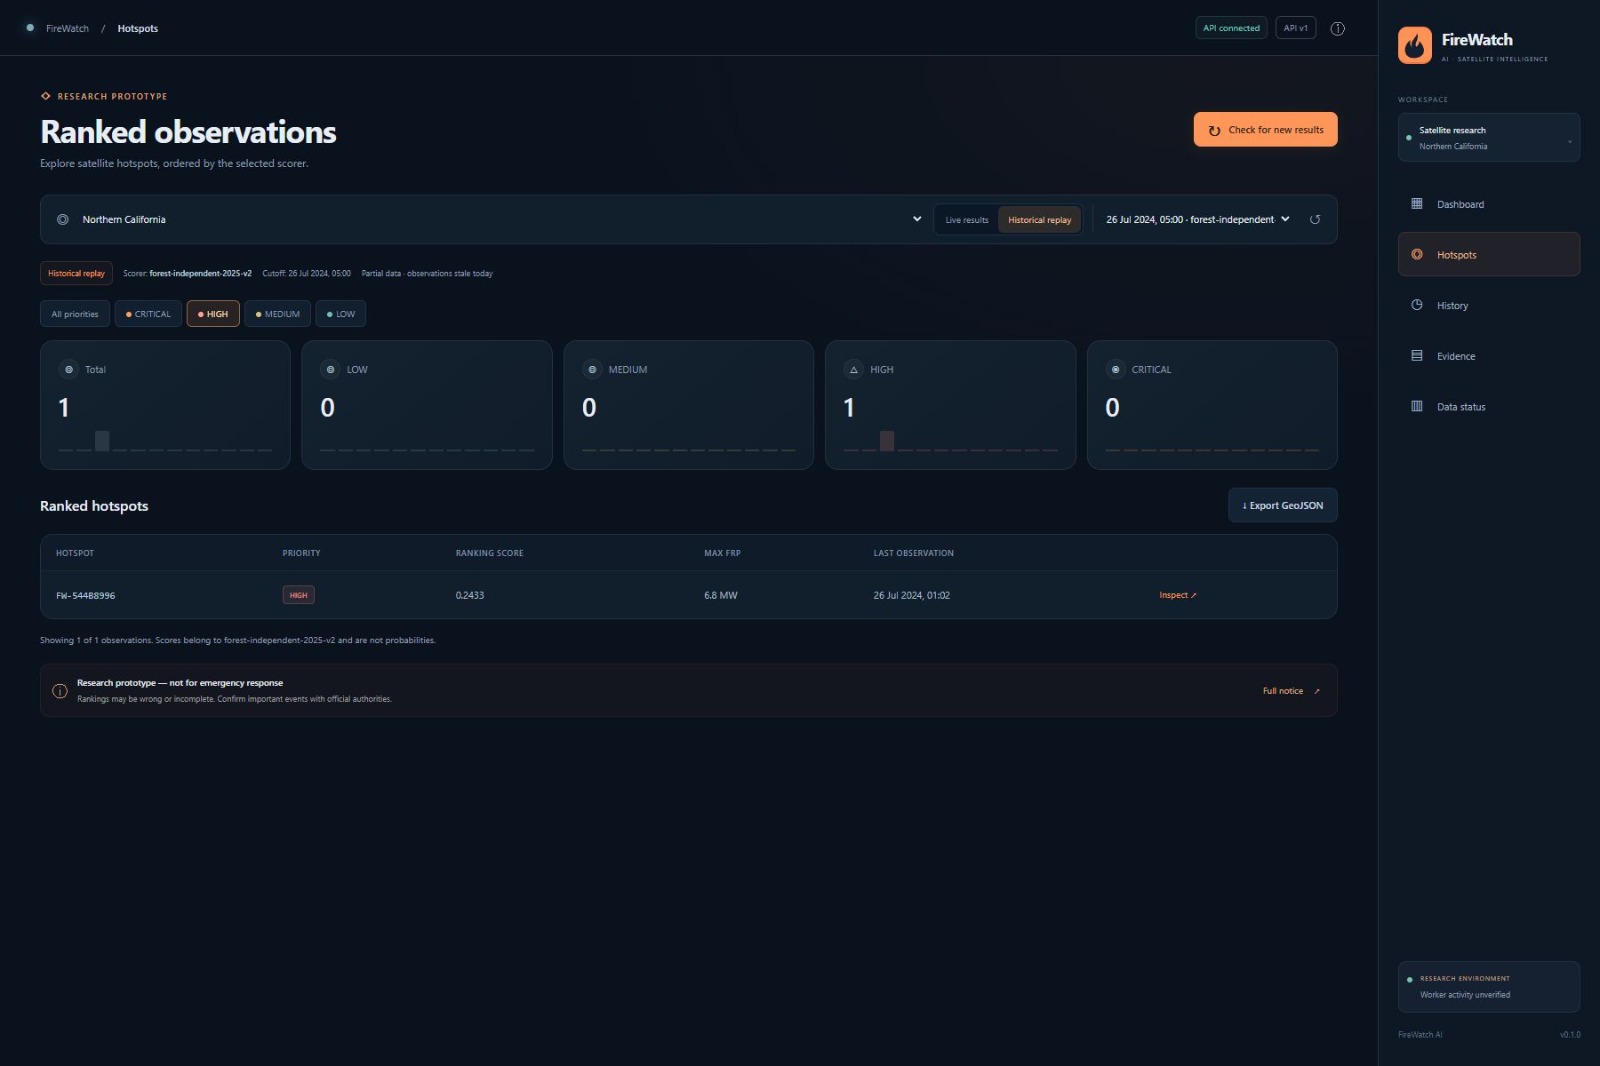
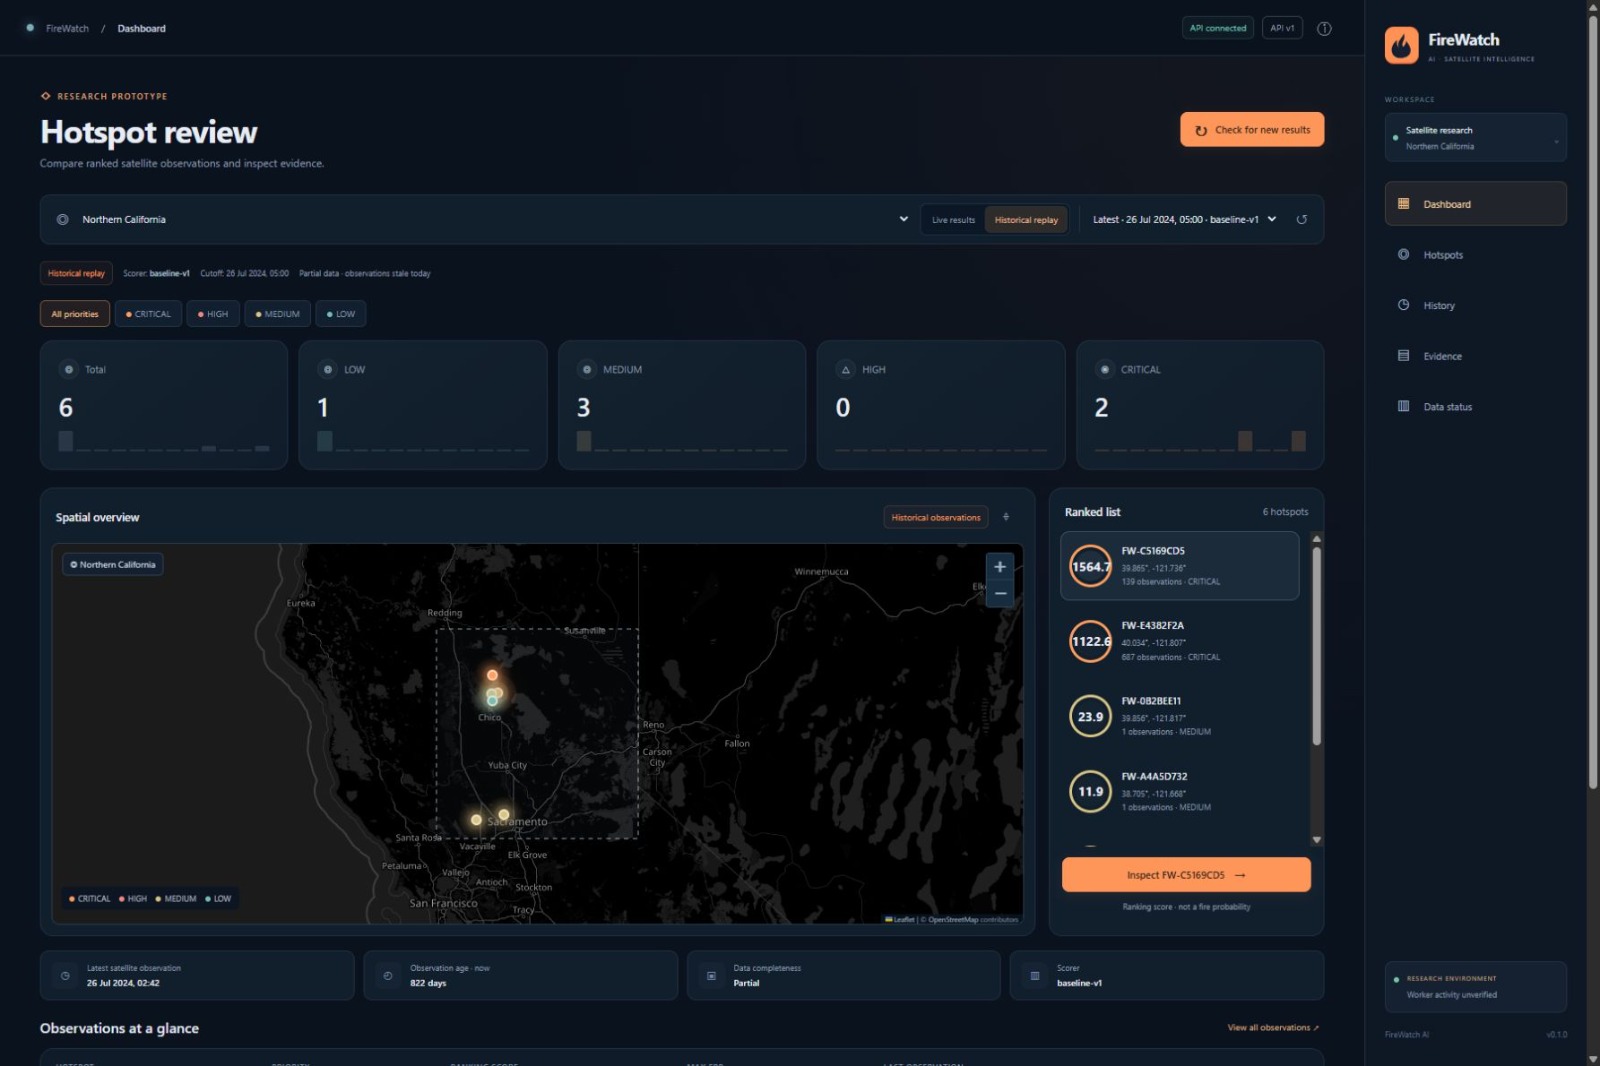
- Explore hotspot locations on an interactive map.
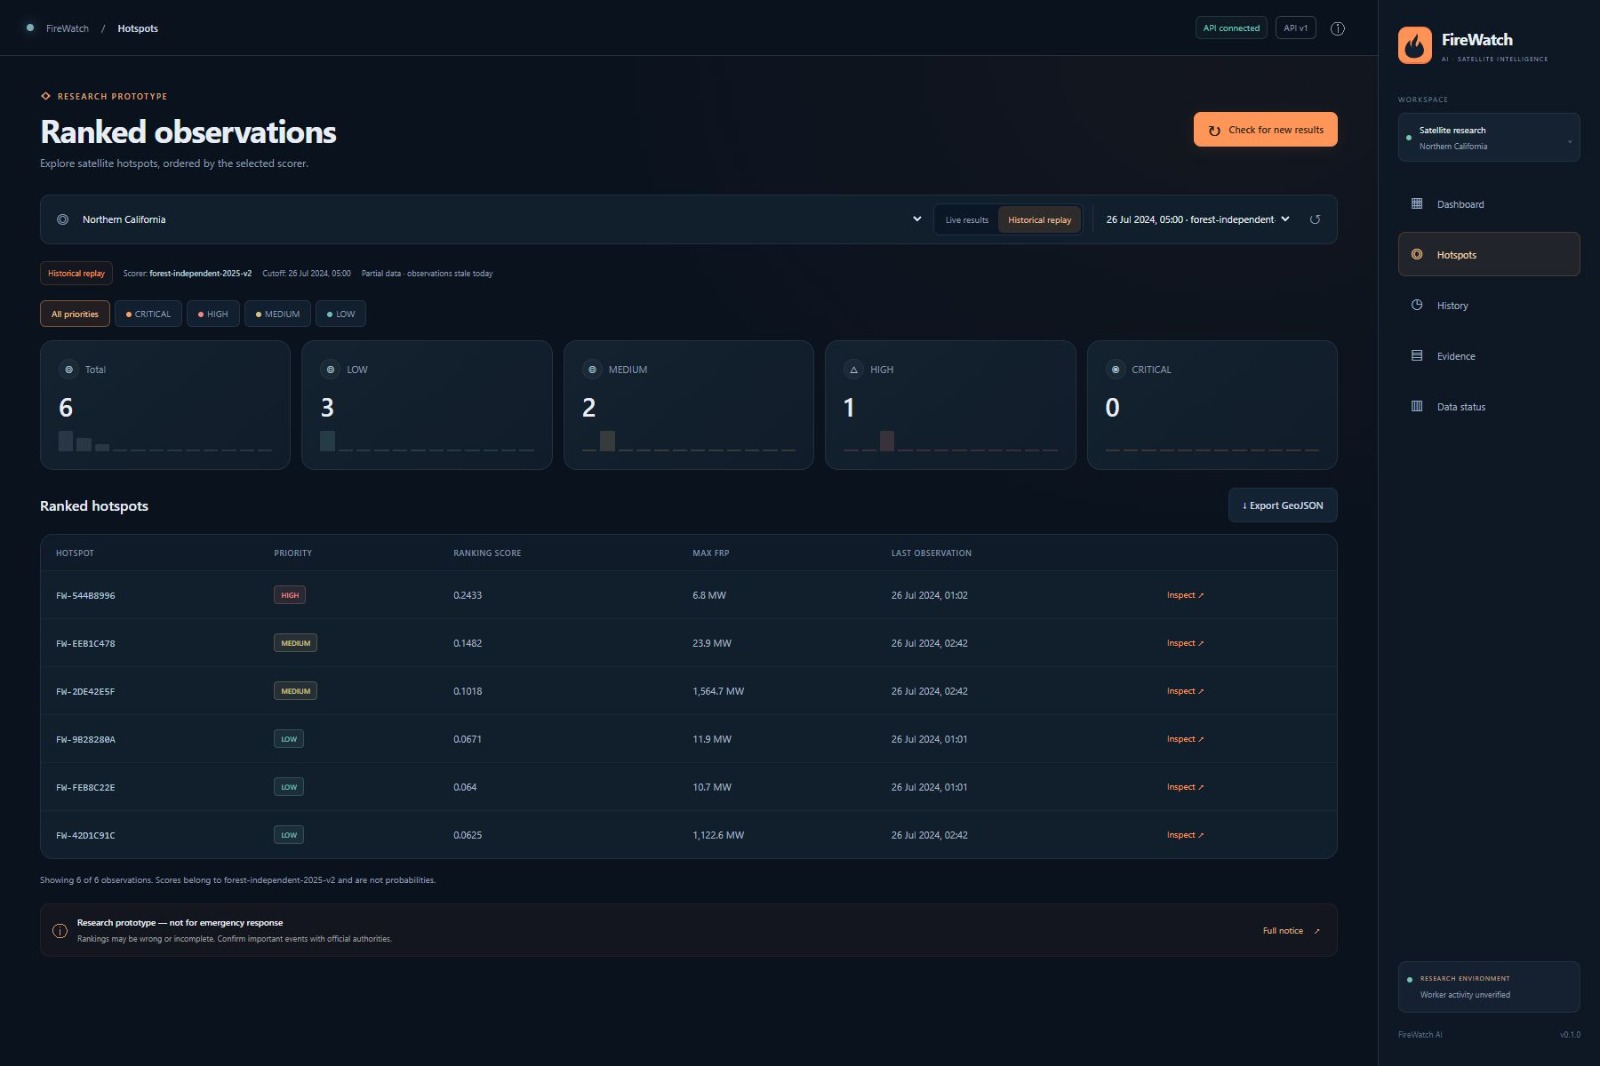
- Filter results by priority.
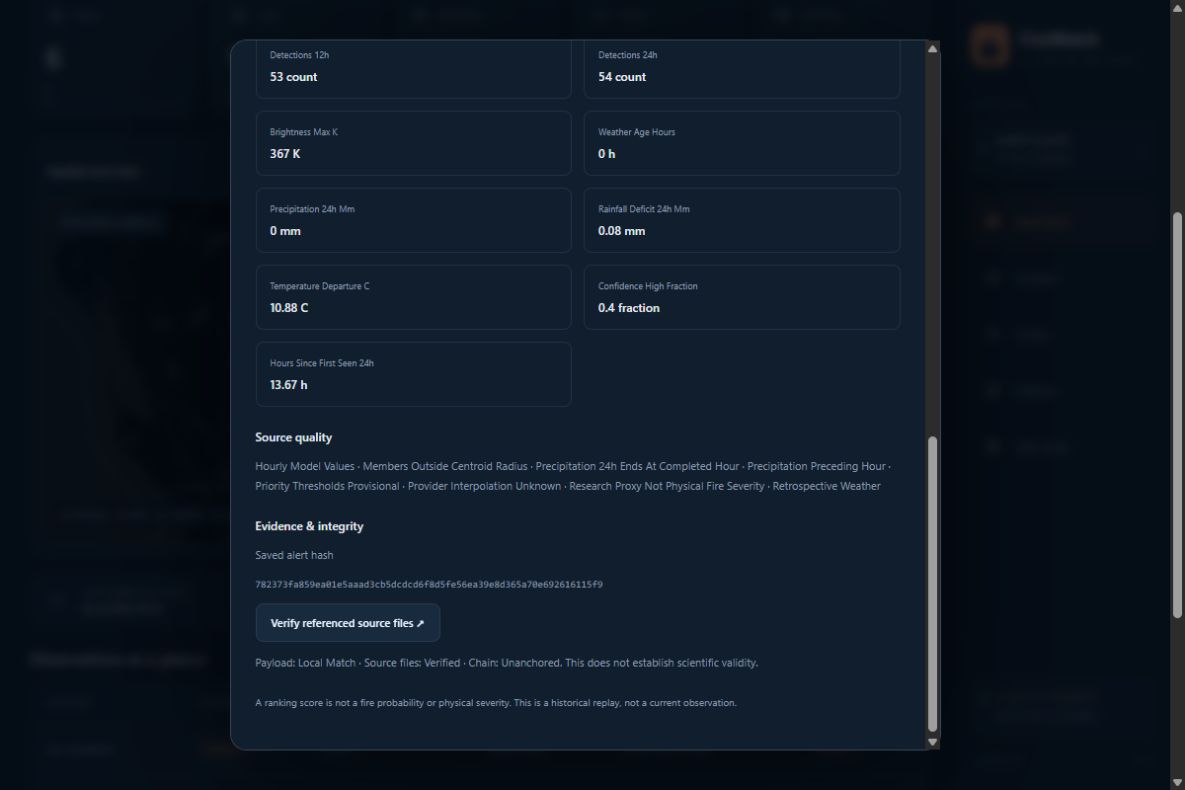
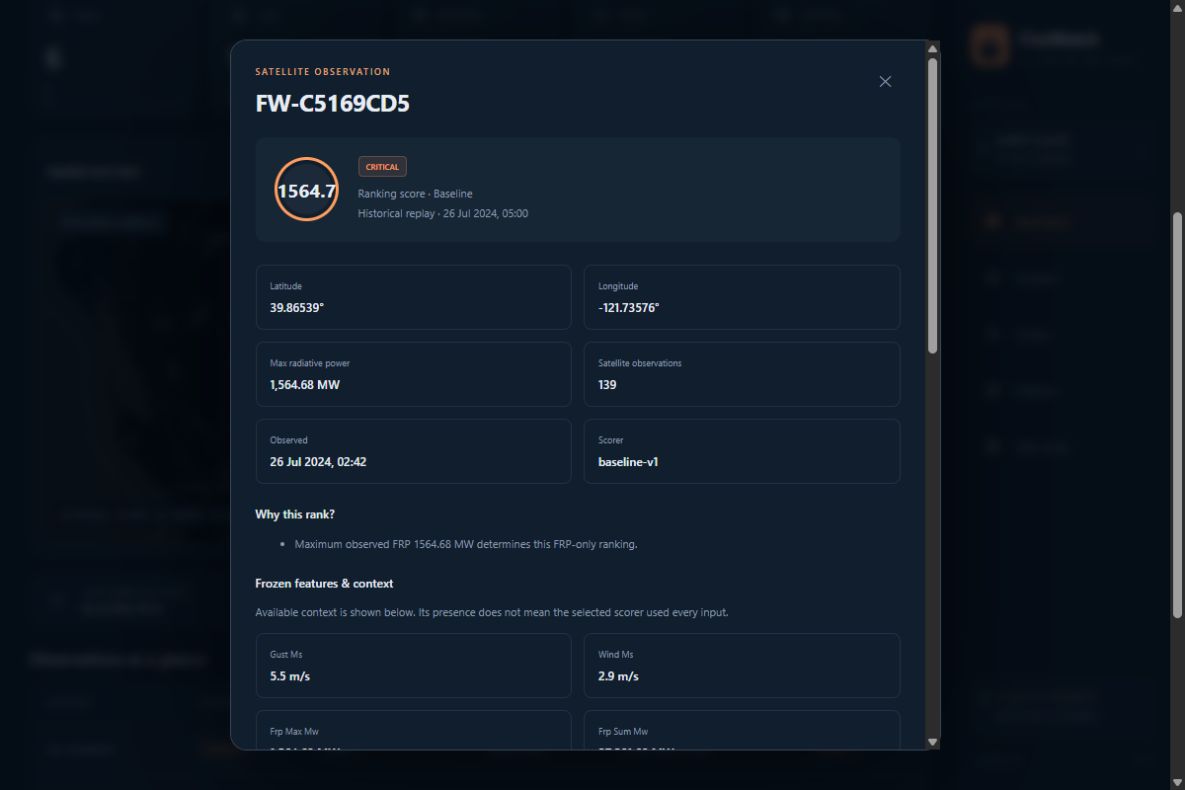
- Inspect observation times, radiative power, and ranking explanations.
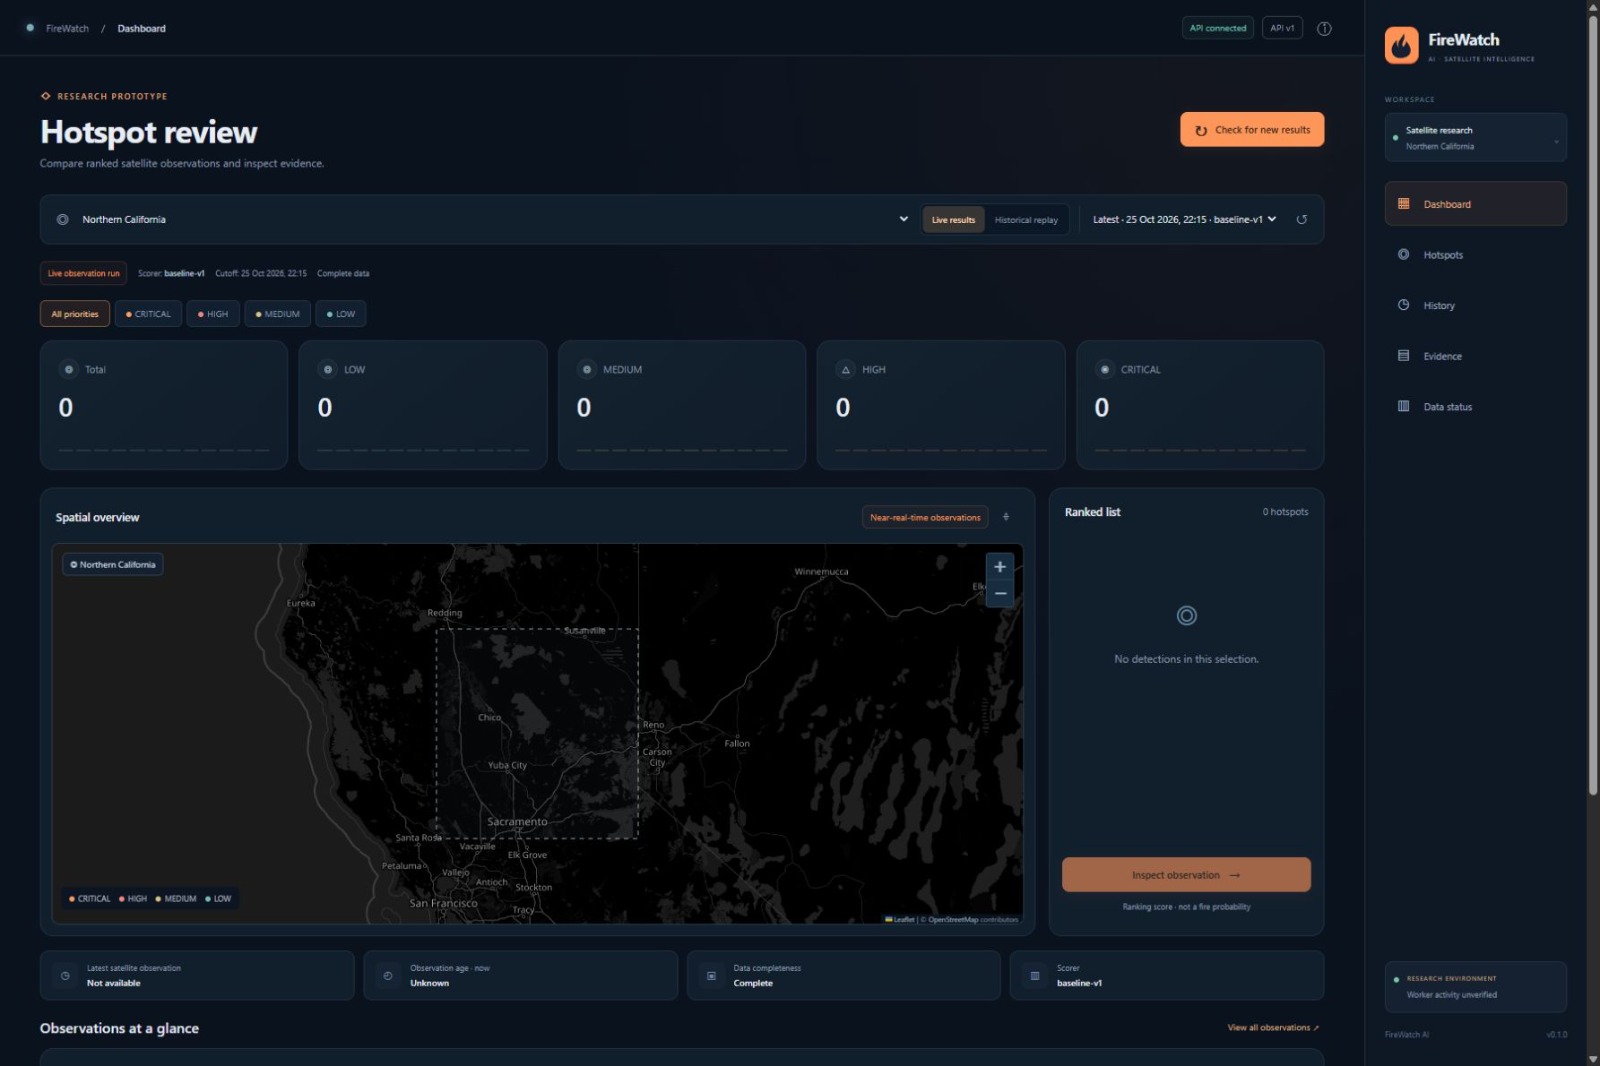
- Switch between live results and historical replays.
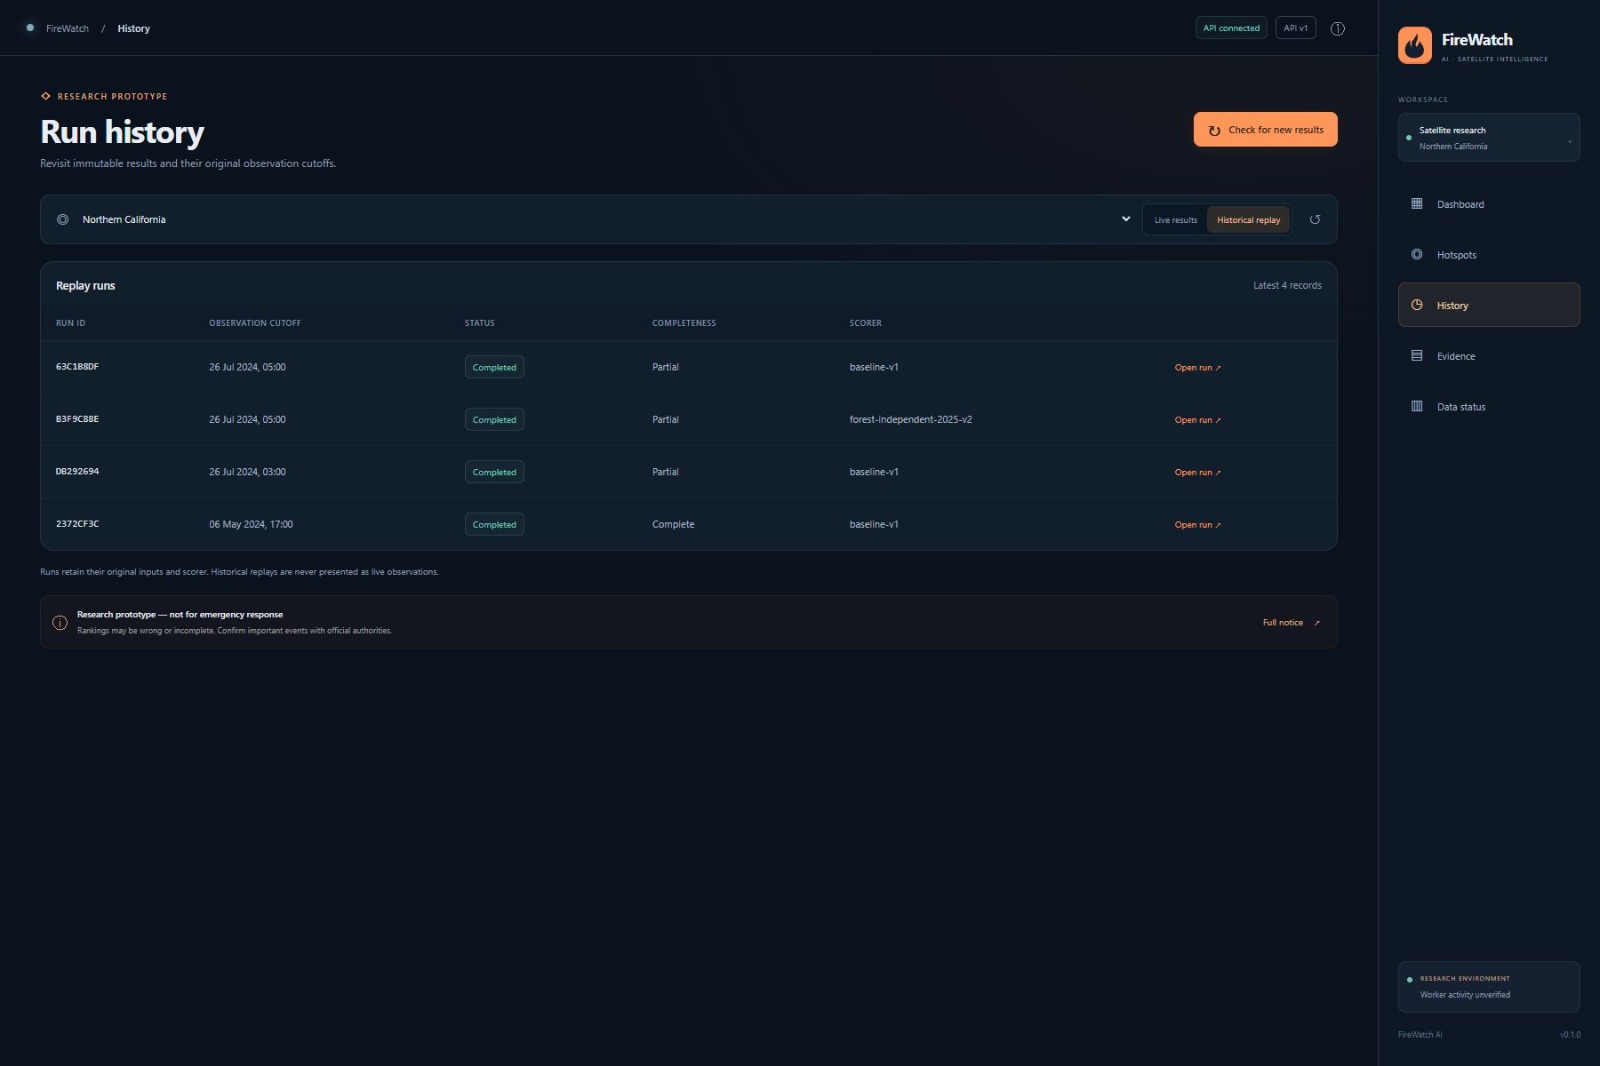
- Review the model version and data completeness for each run.
- Check source freshness and worker activity.
- Verify the saved evidence behind critical alerts.
- Export hotspot locations as GeoJSON.
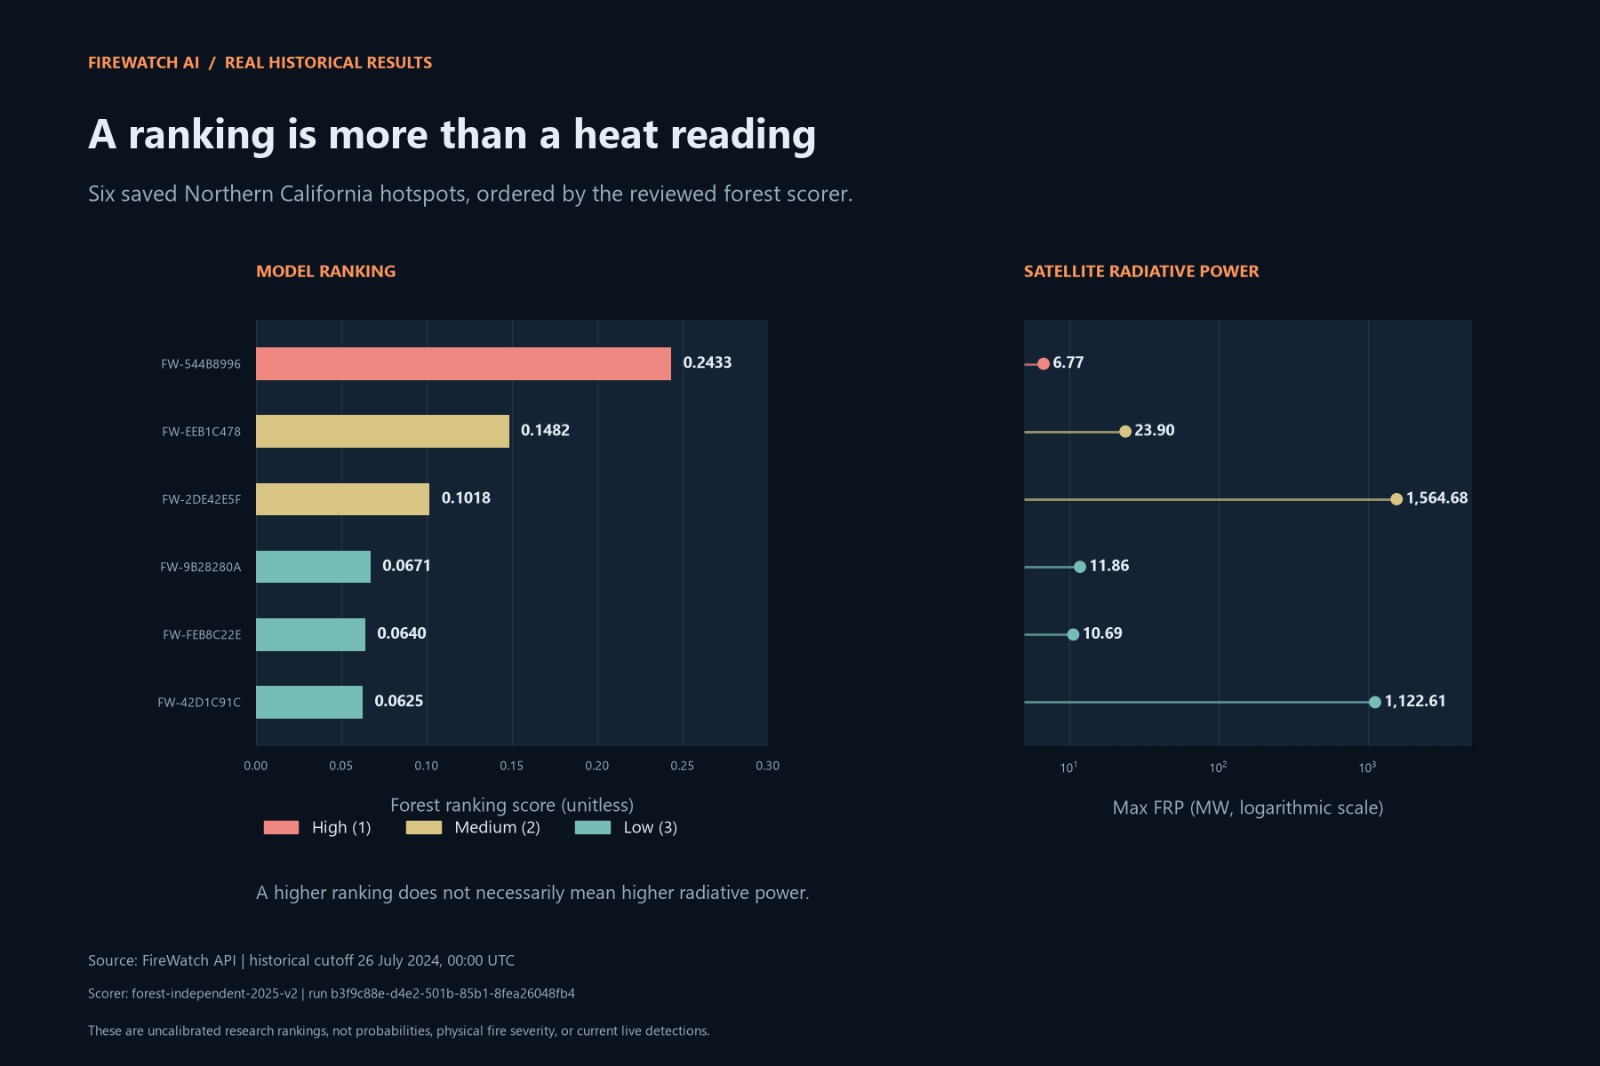
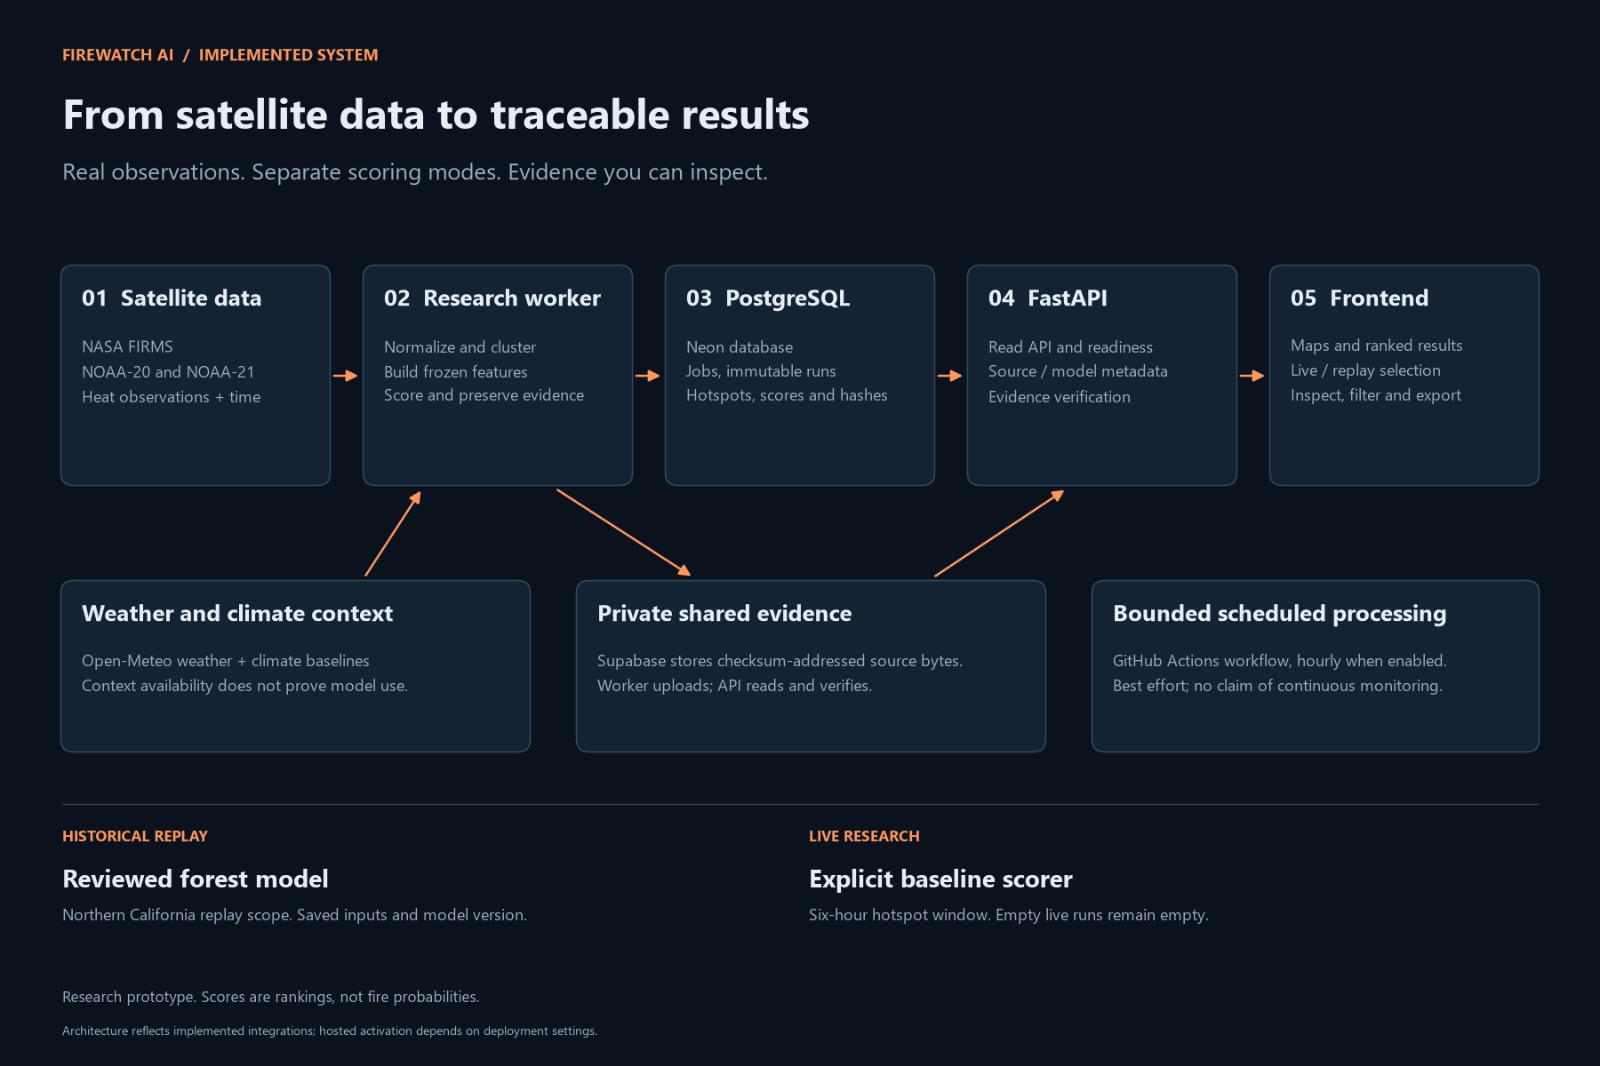
Historical replay uses saved data to make earlier results easier to inspect and compare. Our reviewed forest model currently supports historical Northern California replays. Live processing uses a separate baseline research scorer.
An empty live map can be a valid result. FireWatch only creates current hotspots from observations inside its six-hour window. Older detections are not shown as current hotspots.
FireWatch is a research prototype. It does not confirm wildfires, predict their spread, or replace official emergency services.
How we built it
We built the backend with Python and FastAPI. PostgreSQL on Neon stores observations, processing jobs, runs, scores, and evidence records.
A worker downloads satellite data, checks and normalizes it, groups nearby observations, builds features, and calculates rankings. Open-Meteo weather data and climate baselines provide additional context.
We use a model registry to record approved model versions and their allowed uses. This prevents a historical model from being used for live scoring without a separate review.
For evidence, we save checksums that allow users to check whether referenced files still match their recorded bytes. Private Supabase storage supports access to evidence across different machines.
The frontend uses HTML, CSS, JavaScript, and Leaflet. We followed our Figma design and connected the interface to the backend API.
We also prepared a bounded GitHub Actions workflow for scheduled live processing.
Challenges we ran into
One challenge was understanding the difference between downloading data now and receiving a recent satellite observation. Satellite acquisition and processing delays mean that a successful download can still contain older detections.
Another challenge was keeping historical and live results separate. Different data sources and time periods require clear model approval rules.
We also had to preserve evidence when a worker restarted or moved to another machine. This led us to add private shared storage and checksum verification.
Working within free hosting limits was another challenge. We designed scheduled processing instead of assuming that a free server would run continuously.
Accomplishments that we're proud of
We built a working flow from satellite data collection to hotspot review.
The dashboard displays real backend results, including valid empty results, missing values, and stale observations. It does not fill gaps with invented detections.
We made historical runs traceable through saved inputs, scorer versions, and cutoff times.
We also tested recovery after local evidence files were removed, and confirmed that storage failures prevent publication of incomplete live results.
Most importantly, we built an interface that explains the limits of its data and scores.
What we learned
We learned that useful AI systems need more than a model. Data quality, timestamps, reliable processing, and clear explanations are just as important.
We learned that a ranking score is not automatically a probability, and good historical performance does not establish live-data performance.
We also learned how to connect a frontend, API, database, worker, and private storage while keeping credentials out of browser code.
What's next for FireWatch AI
Our next goal is to evaluate a supervised model on suitable near-real-time data before considering it for live approval.
We also want to:
- Improve calibration and independently evaluate ranking quality.
- Study whether weather and climate features improve performance.
- Add an age-labelled layer for older satellite observations.
- Support more regions after checking their data coverage.
- Improve storage usage monitoring and scheduled-run visibility.
- Explore optional public-testnet evidence anchoring.
We will continue to prioritize clear limitations, reproducible results, and evidence that users can inspect.
Built With
- css3
- docker
- fastapi
- figma
- github-actions
- html5
- javascript
- leaflet.js
- nasa-firms
- neon
- numpy
- open-meteo
- postgresql
- pydantic
- python
- scikit-learn
- sqlalchemy
- supabase


Log in or sign up for Devpost to join the conversation.