-
-
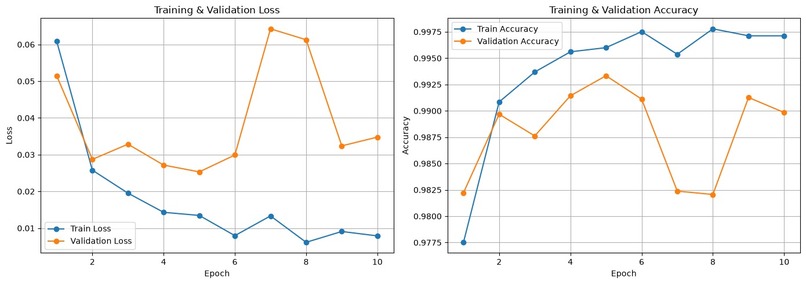
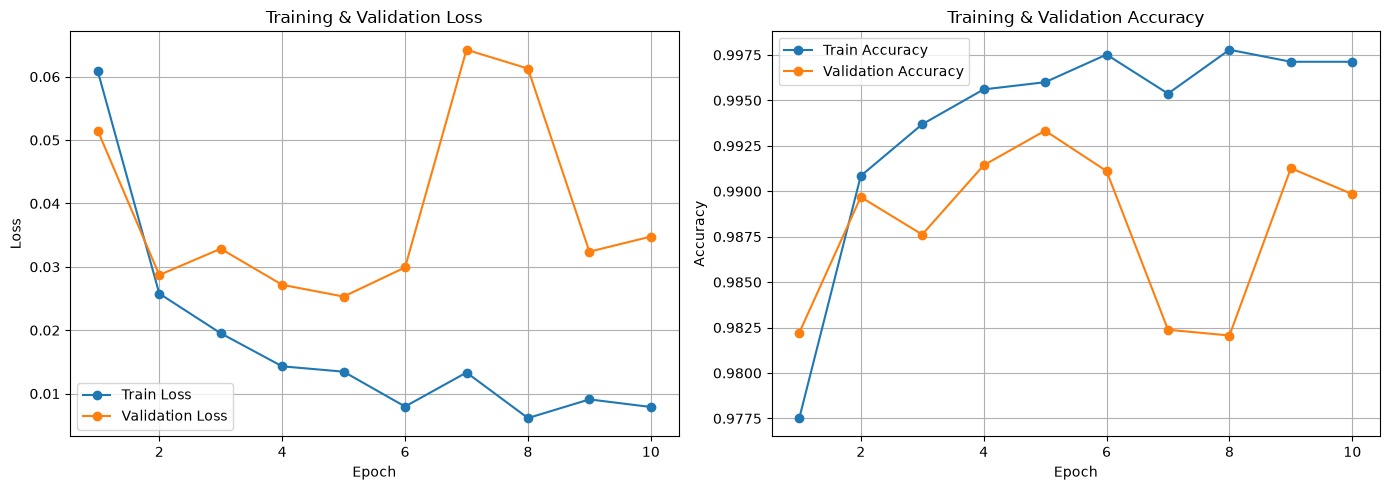
Overfit model for Satellite image classification
-
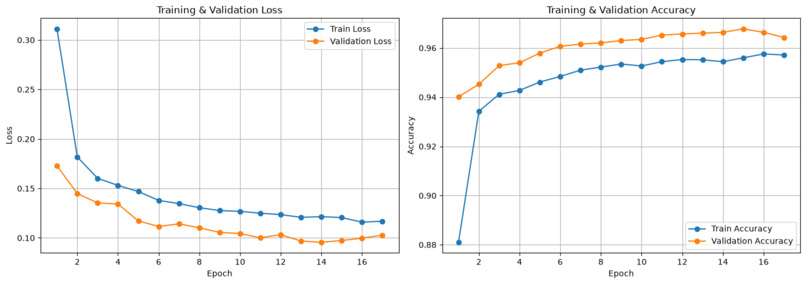
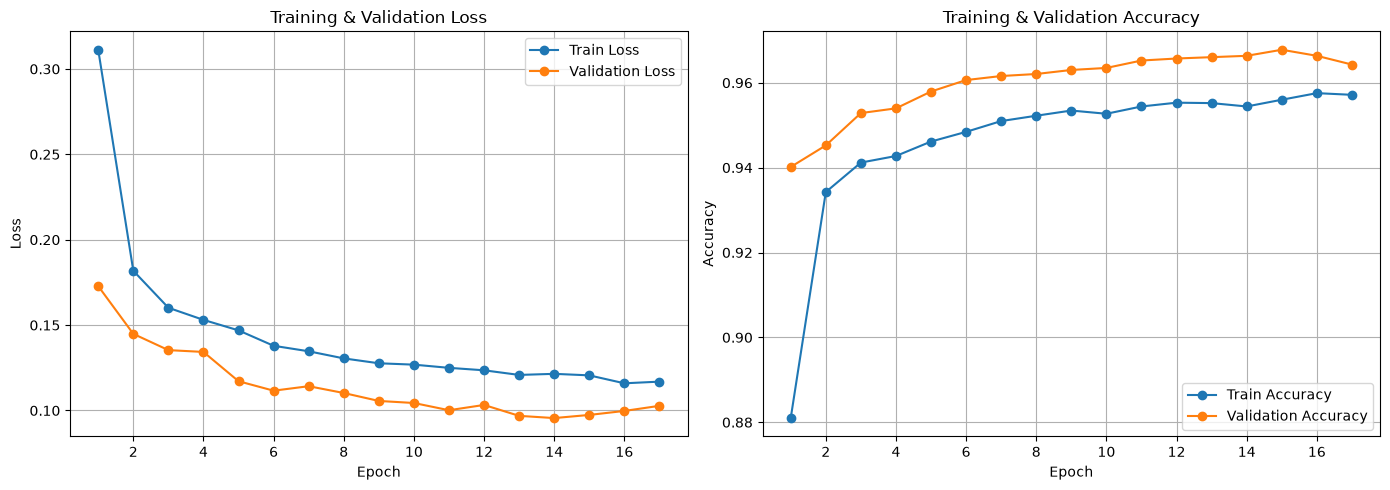
Final trained model for Satellite image classification
-
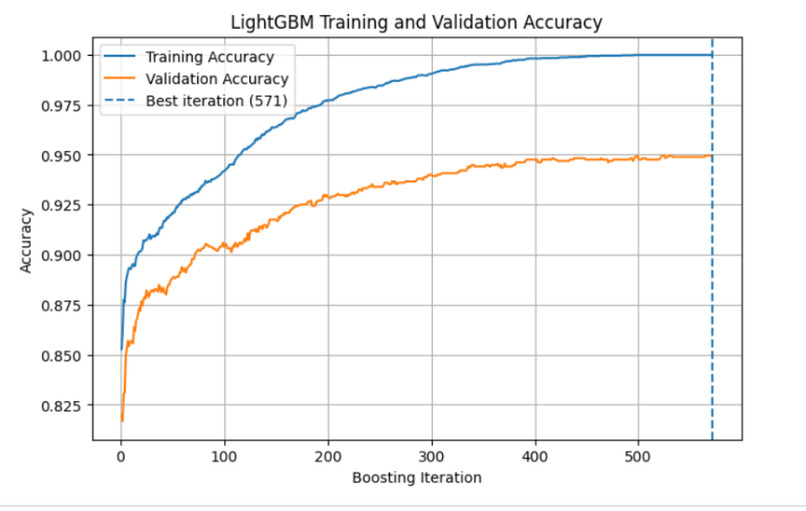
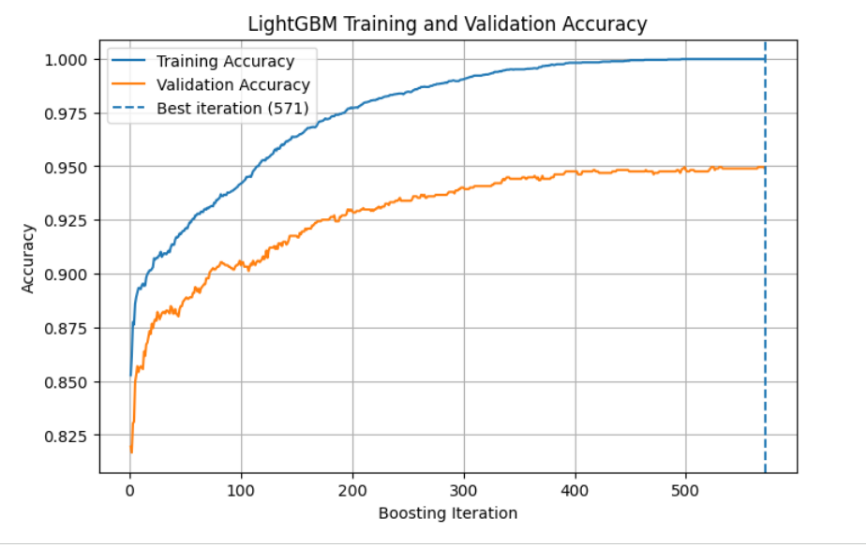
Final trained model for Wildfire Risk Prediction
-
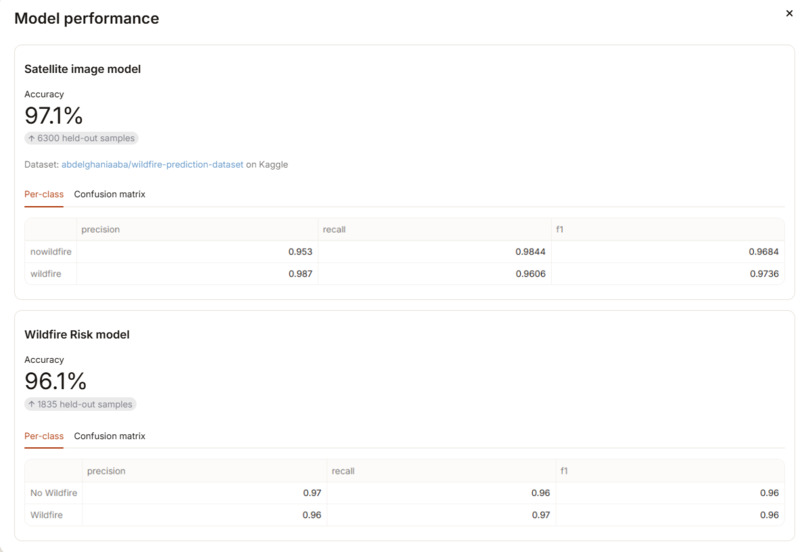
Model performance per class
-
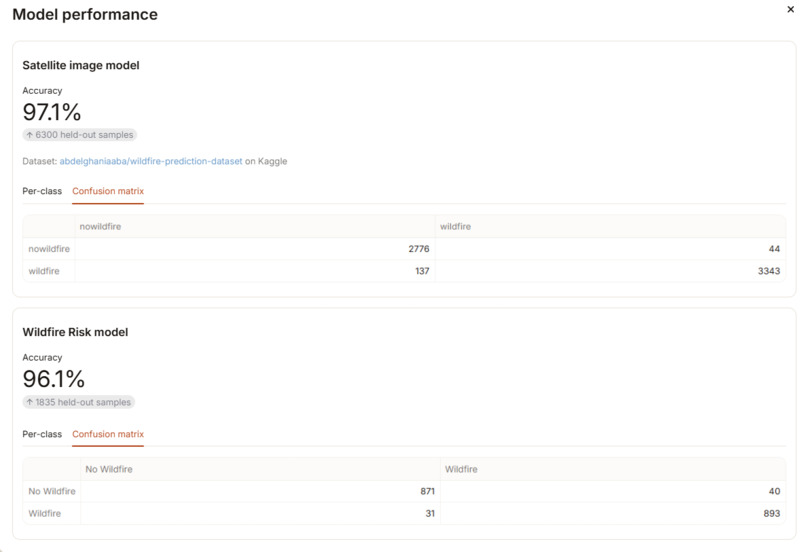
Model performance - confusion matrix
Inspiration
Wildfire risk is a growing environmental crisis, yet vulnerable ecosystems and communities face these threats without adequate early warnings. Recent global data show that over 350 million hectares of land burn annually, causing tens of billions in economic destruction and displacing millions. Furthermore, critical risk data remains scattered across complex systems, leaving local responders and residents without accessible tools to assess immediate danger.
Problem Statement
With a rise in global warming, there has been an increase in wildfires, which creates many environmental, societal, and economic problems. Relevant wildfire data is usually fragmented, complex, and difficult to interpret. And there are not enough tools and data for people who are subject to such risks or responders to understand wildfire risks and take actions for mitigation. This creates the need for a tool that can predict the risk of wildfires based on satellite images or simple environmental variables for better awareness and mitigation.
Target Users
- Local communities (to understand risk and how certain environmental conditions can affect wildfire risk)
- Emergency responders and authorities (for faster risk assessment and better preparedness for disaster response)
- General users or researchers to understand wildfire patterns and regions more prone to wildfires based on previous data.
What it does
The application predicts the risk of wildfires based on two types of input data: images and environmental conditions. The app has three main functions:
- First, the user can upload an image, and a ResNet-18 model is used to predict the chances of wildfire.
- In the second functionality, the user can input certain environmental variables such as latitude, longitude, humidity, rainfall, temperature, and wind speed to predict the risk of a wildfire using a Light Gradient Boosting Model
- Lastly, users can also view historical data related to wildfires for various years. The Risk Map represents wildfire events across the world. The data displayed includes the month with the maximum number of wildfires and the regions facing the highest number of wildfires each year.
We try to ensure that the AI models are as transparent as possible when it comes to explaining the final prediction. Hence, SHAP is used for explainability. The SHAP explainer shows the user which environmental variables affected the model's decision and whether they influenced the decision positively or negatively.
Impact
FireWatch is built for the people closest to the risk: local responders, community planners, and residents who need a fast read on wildfire danger but lack access to complex, fragmented risk tools. Someone with only a satellite photo can upload it. Someone with only local weather readings can enter them. The historical map adds context on where and when fires have occurred. Because every prediction comes with an explanation of what drove it, users can judge how far to trust the result instead of treating it as a black box. FireWatch is meant to support earlier awareness and better preparation, not to replace official emergency alerts.
How we built it
The application consists of one CNN (convolutional neural network) for image classification and one machine learning classifier for wildfire risk based on environmental variables.
Satellite Image Classification
The dataset from Kaggle is used to train a ResNet-18 classifier. The dataset has 22710 images for wildfire and 20140 images for no wildfire. To achieve an impressive 97.1% accuracy, the training process incorporated regularization techniques, weight decay, early stopping to prevent overfitting, and dynamic learning rate scheduling to ensure stable and efficient convergence.
Wildfire risk prediction
For wildfire risk prediction, a CSV file (Kaggle dataset) comprising 9171 entries was used for training. The features included the environmental variables (user input of the application) and the final label, which was binary (wildfire or no wildfire). A LightGBM (Light Gradient Boosting Model) was tuned using Optuna to determine the optimal hyperparameters and trained on this dataset. The model was developed using hyperparameter optimization with Optuna and early stopping to improve generalization and reduce overfitting. Multiple evaluation metrics were considered, including accuracy, precision, recall, F1-score, ROC-AUC, and Brier score.
Frontend Design
The design was built using the Streamlit library. A simple, user-friendly interface is built for the user to interact with the app. The different kinds of classification (with images and with environmental factors) are clearly separated. The user can use either of the models depending on the kind of data they have available. The app also displays the model performance metrics.
Backend
The backend receives the user input (images or variables), converts it into the relevant model input, and performs the predictions using the saved model. It then fetches the results and explanations (SHAP for variables), which are displayed on the frontend. For the historical risk map page, the backend calls NASA's free EONET API for every wildfire event in a chosen year and caches the result for an hour. The frontend plots each event as an orange dot on a world map. It also shows the event count, the busiest month, a per-month bar chart, and the ten latest events. A < and > stepper moves through the last five years.
Challenges we ran into
During model development for satellite image classification, the initial iteration exhibited severe overfitting, as evidenced by diverging training and validation curves. To improve generalization, we implemented several regularization techniques, including early stopping and weight decay (L2 regularization). As shown in the attached figures, these modifications successfully stabilized training and mitigated overfitting, leading to significantly better validation performance.
A major challenge while building the risk prediction model was also finding the right dataset. Several datasets were investigated before choosing the final dataset, as many lacked the required environmental variables. A major problem in most disaster-related datasets was also information unsuitable for prediction. For example, some datasets had variables only known after the disaster occurred, which could risk data leakage. And upon removing these features, the model performed very poorly (50-60% accuracy). In one of the evaluated datasets, the occurrence of a wildfire was highly correlated with only one feature (out of a total of 17 features), which was day or night determined on a scale of 1 to 5 (where 1 means day and 5 means night). This not only simplifies the prediction of a fire based on day or night but also creates vagueness with respect to the user input and makes it difficult for the user to understand such a scale. It is also important to ensure that the dataset has a uniform distribution of positive and negative samples.
The final dataset contained relevant geographical and environmental parameters: latitude, longitude, temperature, precipitation, wind speed, and humidity, together with a binary wildfire outcome. However, further analysis revealed that the dataset was geographically limited to Quebec, Canada, and that geographical features had a strong influence on the model. SHAP was helpful in evaluating which features the model was using to make the predictions. So, while geographical features (latitude and longitude) play an important role in influencing the decision, the model also considers all the other environmental factors and weighs them appropriately.
One of the main deployment challenges was finding a cost-effective solution. While free or low-cost deployment options were available, they required considerably more configuration and involved more moving parts than paid alternatives. Managing these additional components was more complex and time-consuming than initially expected. Another challenge was integration and dependencies. We had a Streamlit frontend talking to a FastAPI backend that serves PyTorch models, and keeping the UI in sync with the backend's response schemas and saved model files was tricky. PyTorch was the hardest dependency. It's heavy, and it needed different builds per platform (CPU and CUDA), which we handled by pinning separate uv package indexes.
Accomplishments that we're proud of
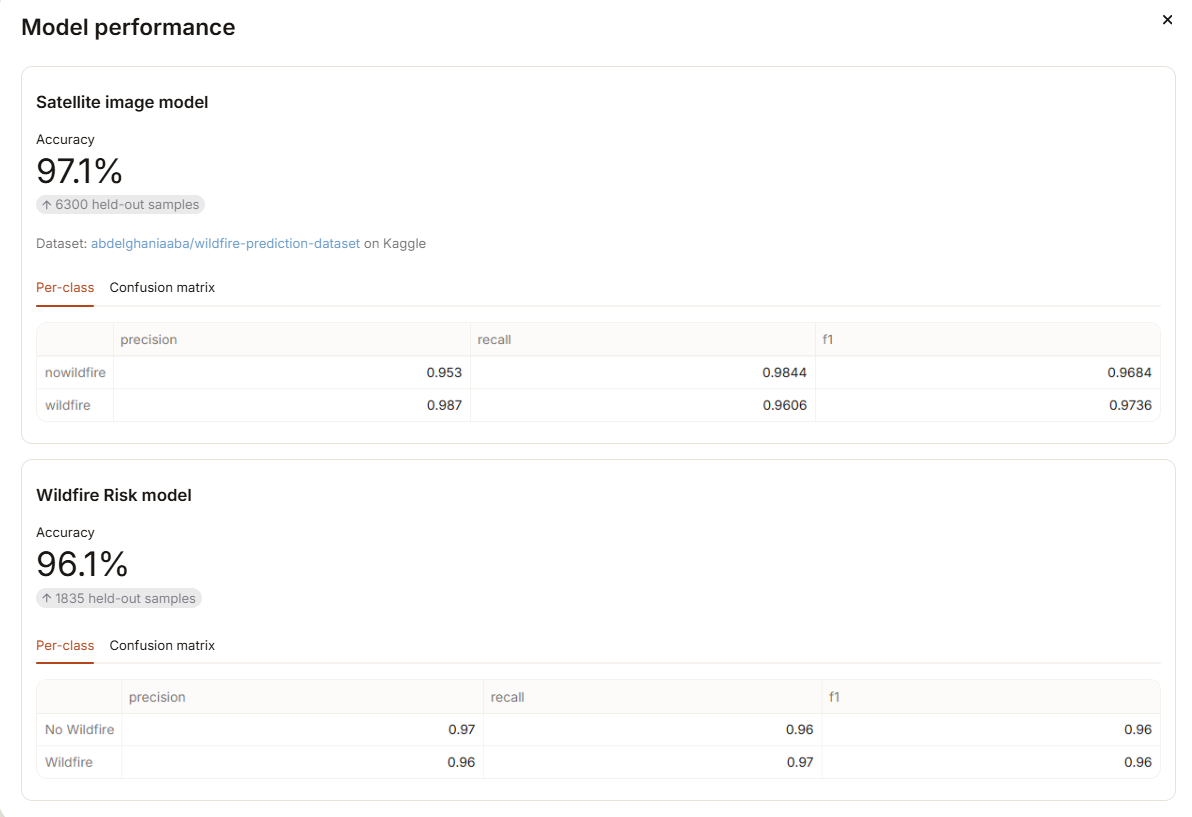
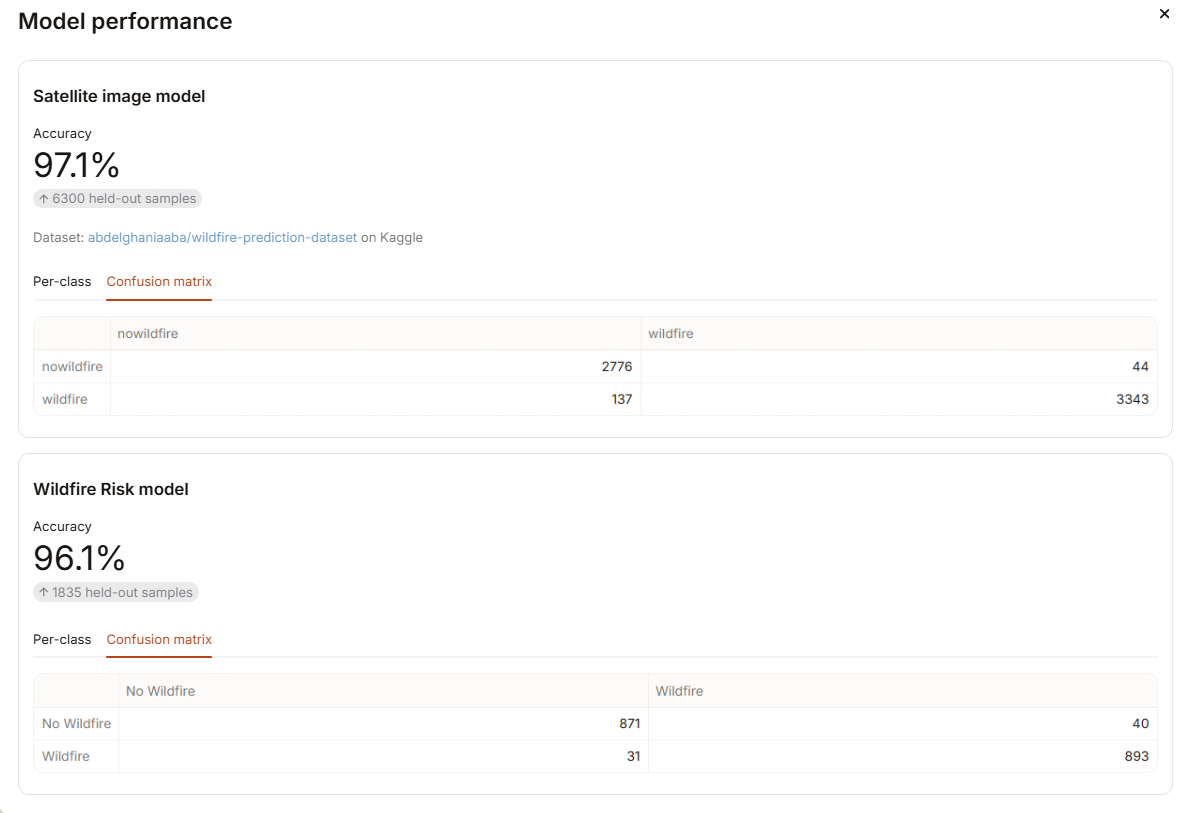
A fully working end-to-end product (FastAPI backend, Streamlit frontend, live NASA data) built within the hackathon. Both models were evaluated on multiple metrics such as accuracy, precision, F1 score, recall, and AUC-ROC, and they show good results across all metrics as seen in the attached images. The training and testing accuracies show that the models are able to generalize well without overfitting or underfitting.(Please see attached images) The models maintained a reasonable balance between precision and recall, rather than optimizing for only one type of prediction error. The trained models were successfully integrated into a functional frontend and backend, turning the ML predictions into an accessible application.
What we learned
Data selection is a very important part of model development.
We learned that the quality of a model is only as good as its data. Sophisticated models and algorithms cannot make up for the problems in a dataset such as: data leakage, missing values, irrelevant parameters, and more. Finding data with an apt number of relevant features, target, and geographical information was more challenging than expected. And using different datasets on similarly tuned models yielded very different results.
Model architecture should match the type of problem
Since the data consisted of structured environmental variables, a gradient-boosted decision-tree architecture such as LightGBM was more appropriate than a deep neural network. LightGBM can capture nonlinear interactions between variables while remaining fast and efficient for tabular data. For image data, using a pre-trained CNN (ResNet-18) was a more suitable model to learn the different representations and patterns in the images.
Reliability of model based on metrics and explainability
We used various types of metrics other than accuracy, like precision, recall, F1 score, and ROC-AUC, to ensure a holistic evaluation of the model. For the LightGBM model, the Brier score was also used to understand how the calibration was being done. Calibration refers to how different probabilities were assigned to the binary 0/1 outcomes (the probability with which fire outcome could be 0 or 1). Apart from the metrics, explainability was also used to understand what features were contributing to the actual results. For example, SHAP showed how strongly geographical factors (latitude and longitude) affect the prediction, along with temperature and humidity. This not only makes the prediction more transparent and understandable to the user, but also helps the developer understand what kind of improvements can be made.
What's next for FireWatch
Currently, both of our models are trained exclusively on data from Canada, so expanding this to other regions worldwide is a top priority for future updates. Moving forward, we also want to stream live satellite feeds into an automated email and SMS system to alert emergency authorities the moment a new ignition is detected. Additionally, by factoring in real-time wind, weather, and terrain data, we hope to build dynamic models that can forecast fire spread up to 48 hours in advance. We also plan to fuse satellite imagery, weather, vegetation dryness, soil moisture and terrain into a single risk model, and to add fire segmentation to locate active fronts rather than just classify an image.
Technical Approach and Components Used
The application consists of two different kinds of models:
a) Satellite image classification.
b) Wildfire risk prediction based on environmental factors.
Satellite Image Classification: This is a deep learning model, ResNet-18, which takes satellite images as input and predicts the chances of wildfire occurring in that area. The model was trained on images and tested on 6300 test images. The model performed poorly initially but was fine-tuned with regularization techniques, early stopping, learning rate scheduling, and weight decay. This helped improve the performance, and the model achieved an accuracy of 97.1%. The training and validation performances were also monitored consistently to ensure the model generalises well and does not underfit. On comparing the training and testing accuracies, it was observed that the model did not overfit. The model scored well on the rest of the evaluation metrics as well, ensuring a well-rounded performance. A precision of 98.7% , recall of 96.1%, and ROC-AUC of 0.997 were achieved. The training and validation performances, along with the confusion matrix and ROC-AUC curve, can be seen below.
Wildfire Risk Prediction: This model was trained to take the following factors: latitude, longitude, temperature, humidity, rainfall, and wind from the user to determine the wildfire risk. Here, risk refers to the certainty of the model, so an 87% risk indicates that the model is 87% sure that a wildfire can occur. Since the data was tabular, machine learning models like LightGBM (Light Gradient Boosting Model) and XGBoost (Xtreme Gradient Boosting) were compared. These are lightweight and efficient, ensuring scalability as well. The dataset was first analysed and then prepared for training. Optuna was used to find the correct set of hyperparameters that give the highest performance across 50 trials. The model also uses a SHAP explainer to explain the predictions. The SHAP plot helps the user understand which factors positively and negatively affect the predictions, making the model more transparent and reliable.
The training and validation performances were monitored for this model as well as seen below. The final results can be seen in the image below. The model performs well across different metrics such as accuracy (96.1%), precision (95.7%), recall (96.6%), and AUC-ROC (0.985).
Frontend: A simple user-friendly web interface is built with the Streamlit library. It integrates the above-mentioned AI models into functionalities the user interacts with. First, the user can input a satellite image, and the model will predict the chances of wildfire. A separate page allows the user to enter the environmental factors and see how these factors affect the wildfire risk prediction done by the LightGBM model. A third functionality of the app is also displaying real-time wildfire data for every year. The data allows the user to explore wildfire trends such as the maximum number of wildfires in a year or the regions most affected by wildfires.
The user can easily switch and navigate across the three different functions of the app mentioned above. The app supports both light and dark modes.
The user can also see the performance metrics of both models (accuracy, precision, F1, and confusion matrix) in the app.
Backend: The FastAPI backend handles the different kinds of user inputs (images or factors) and runs model inference on them. The image input is sent to the PyTorch model (ResNet-18), which outputs the wildfire prediction. For the environmental factors, the user input is sent to a LightGBM model (a .pkl file) which outputs the wildfire risk, along with the SHAP plot and its interpretation. The backend also fetches data from NASA's free EONET API for every wildfire event in a chosen year and caches the result for an hour. Yearly wildfire data is then visualized to identify patterns such as peak wildfire months and highly affected regions.
Built With
- ai
- classification
- climate
- fastapi
- ml
- prediction
- python
- resnet
- streamlit
- ui/ux


Log in or sign up for Devpost to join the conversation.