-

Meet FireSpot
-
How it works
-
Data Flow

Inspiration
California is one of the most fire-prone places on Earth. Everyone deserves to be prepared for the worst, and there are especially vulnerable populations who would greatly appreciate more information about fire safety such as the elderly, disabled, and non-English speakers.
Here are some stats you need to know:
People aged 65 and up have a significantly higher risk of dying in fires than the rest of the population (U.S. Fire Administration).
Indigenous populations are six times more likely than other groups to live in wildfire-prone areas (University of Washington).
Physical disability is a factor in almost 20% of all house fire deaths (NFPA Research (Download PDF)).
As a community, we should be aware of how our environment may be at risk of fire hazards. With a better understanding of what the future holds for us, we can better prepare to protect our homes, our livelihoods, and each other. FireSpot was made for this purpose.
What it does
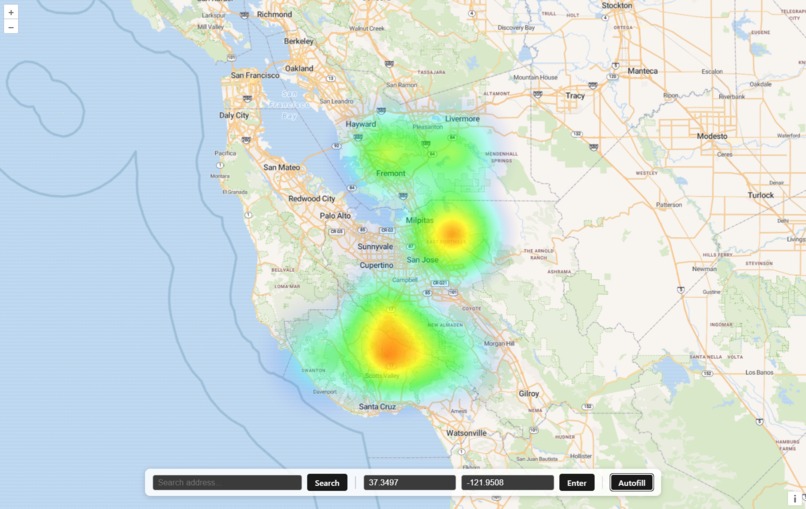
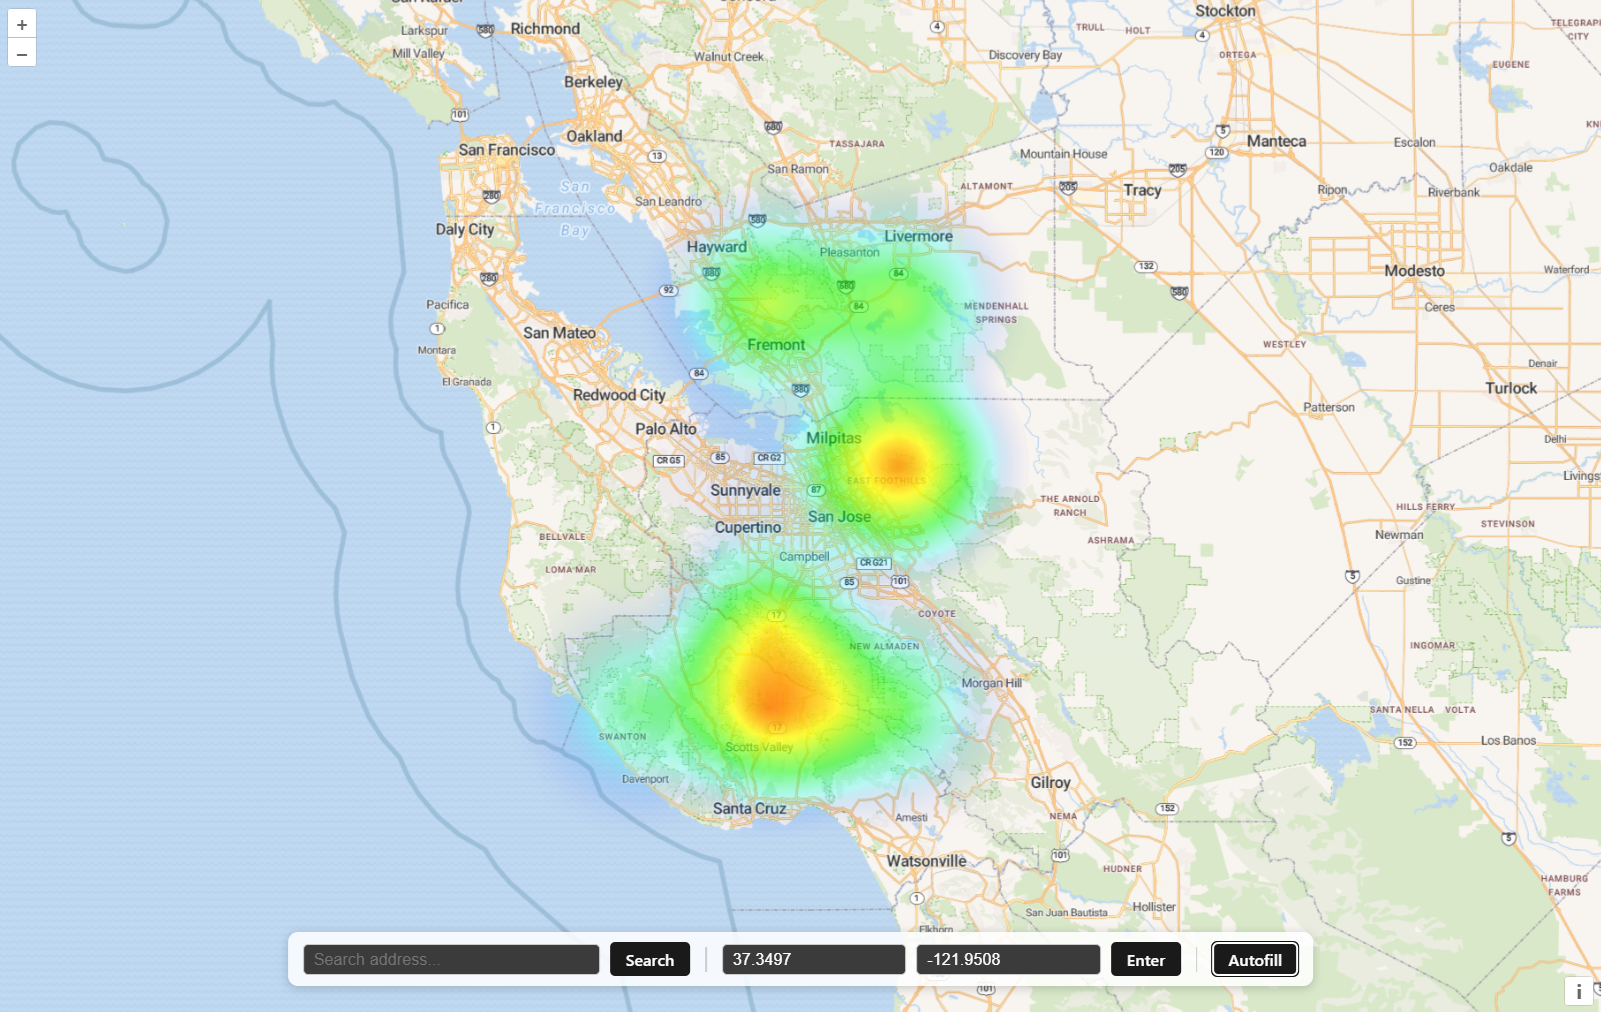
FireSpot takes in 15 years of federal wildfire incident data to train a machine learning model that predicts fire probability at any location in the continental United States. Given a location, the model scores a grid of surrounding cells and renders the results as an interactive heatmap (no pun intended), putting neighborhood-level fire risk in the hands of anyone who needs it.
How we built it
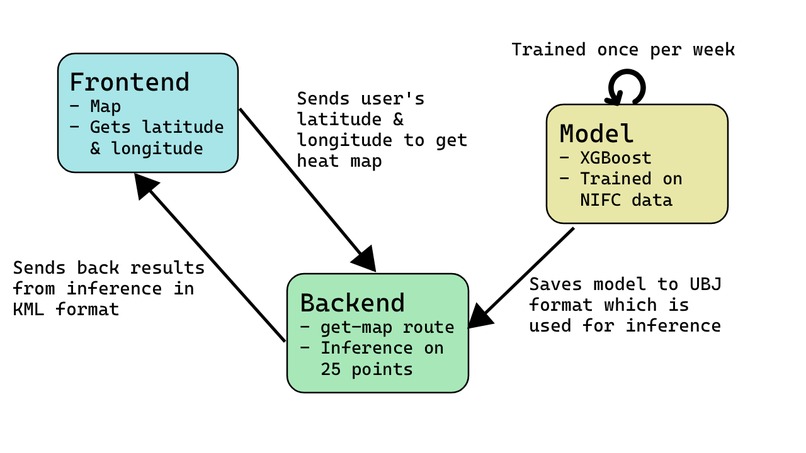
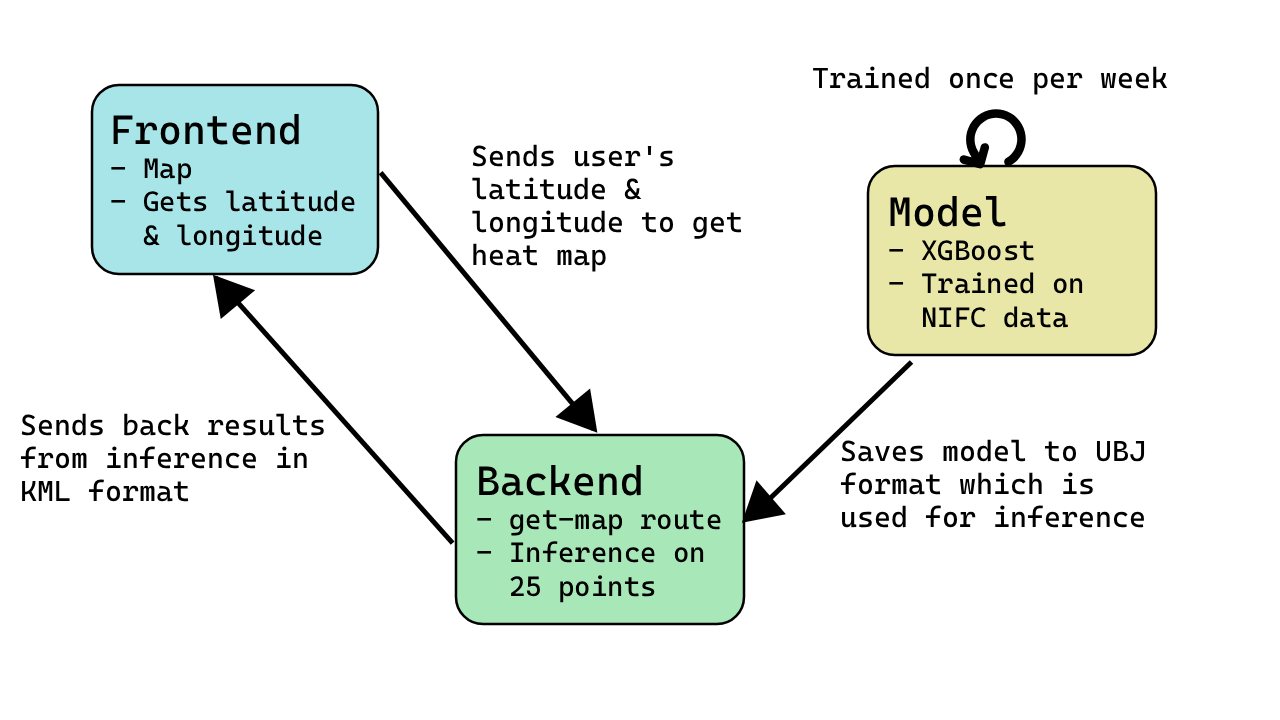
We trained an XGBoost gradient boosting model on NIFC fire occurrence records, NLCD land cover classifications, and GRIDMET long-term climate data including vapor pressure deficit, fuel moisture, max temperature, wind speed, and energy release component. Given a location's coordinates, land cover type, and climate profile, the model estimates how frequently that area has burned over the past 15 years. This rate is converted to a probability of fire occurrence over a five-year window using the Poisson distribution, then scaled to represent point-level risk within each 0.1° grid cell.
We built a Flask API hosted on an AMD DigitalOcean GPU droplet and exposed publicly over HTTPS via Tailscale Funnel to run inference on the model and serve predictions as KML data. We ensure that we don’t track usage of our app on the backend to ensure user privacy and so that our data is taken advantage of.
We built a Svelte frontend deployed on Vercel that renders the predictions as an interactive heatmap using OpenLayers, with support for address search via Nominatim and automatic geolocation on page load.
Challenges we ran into
When it came to the frontend, we had to decide the visual strength of the data. OpenLayers supports heatmap layers, with a relative amount of customization. When it comes to visualizing risks like potential for fire which can be vital information, we had to decide how strong our data points would come off to the viewer. We tested different visualizations until we found one that was both visually appealing and effective in conveying the possibility of fire.
On the backend, our main challenge was facilitating model inference in a way that would be fast and efficient. We decided to choose 25 coordinates with ~1 km distance apart from each other and are near the user to show a wide-enough area of effect. This way the user can see the likelihood of a fire within a 20 km (12 miles) distance away from themselves.
With regards to machine learning, we struggled with preprocessing the massive datasets as well as building our first decently accurate model.
Accomplishments that we're proud of
We were also able to efficiently serve data inferred by the model to the user and allow users to interactively understand the model's output via heatmap. Most ML advancement is done through research which doesn't always reach the people who need it the most.
Another accomplishment was achieving an R2 of 0.70, which is a strong result given that we are trying to predict a natural phenomenon as unpredictable as wildfire relying entirely on historical data and ignoring the large portion of fires that are not naturally occurring, but instead started by human-caused ignitions.
What we learned
Our model supports the idea that gradient boosting is effective on geospatial data. We learned that data preprocessing is equally as important, if not more important than the training itself - we spent almost four times the amount of time wrestling with the data.
To actually present our model’s findings, we had to learn more about how latitude and longitude correspond to real distance, how latitude and longitude are projected onto maps, and how to represent coordinate data in a structured format (KML).
What's next for FireSpot
To be able to help more people, we want FireSpot to scale up to cover more countries. This would require more data and an even more efficient backend. We also want FireSpot to be more accessible, so we could develop a mobile app for users to get information more quickly. Additionally, notification alerts could be sent to the user to further allow them to be informed regularly when their location becomes particularly prone. Based on location, we can also provide local resources and information on how they can keep themselves prepared and ready for when fire strikes.
Are you in a fire spot? Together we can keep our communities safe.
Built With
- amd-developer-cloud
- javascript
- kml
- openlayers
- python
- svelte
- xgboost


Log in or sign up for Devpost to join the conversation.