-
-

logo
-
logs
-
logs


Inspiration
Ops/support teams struggle with fragmented signals—support tickets, error logs, uptime pings—without a unified incident view. Fireline aggregates these signals into incidents, auto-triages them, and generates communications.
What it does
Fireline is a real-time incident room that:
- Ingests heterogeneous support events via Redpanda (Kafka-compatible streaming)
- Aggregates events into incidents grouped by service and environment
- Uses LLM-based triage to assign severity (SEV1/SEV2/SEV3), owner, and summaries
- Generates internal and external status updates
- Sends Slack notifications to assigned engineers and escalates SEV2+ incidents
- Provides a real-time web UI showing incidents and status updates
How we built it
- Backend: Java 21 + Akka SDK (Agents, Consumers, KeyValueEntities, Views, HTTP Endpoints)
- Streaming: Redpanda for event ingestion
- LLM: OpenAI API for triage and communications generation
- Frontend: Next.js + TypeScript for the incident room UI
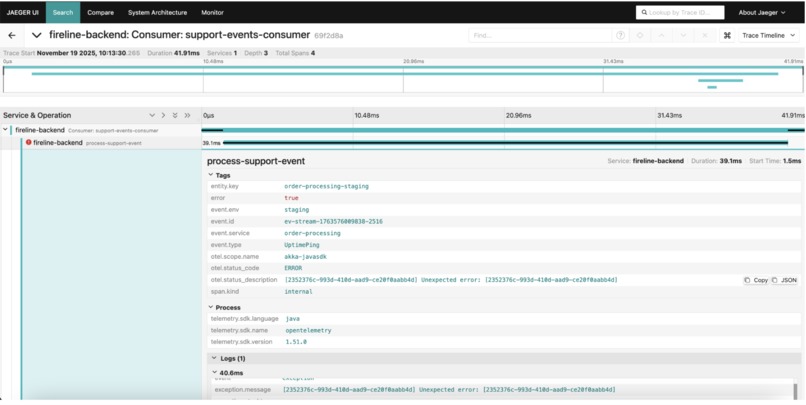
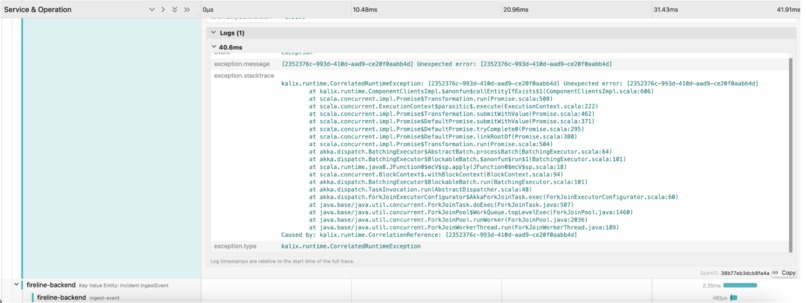
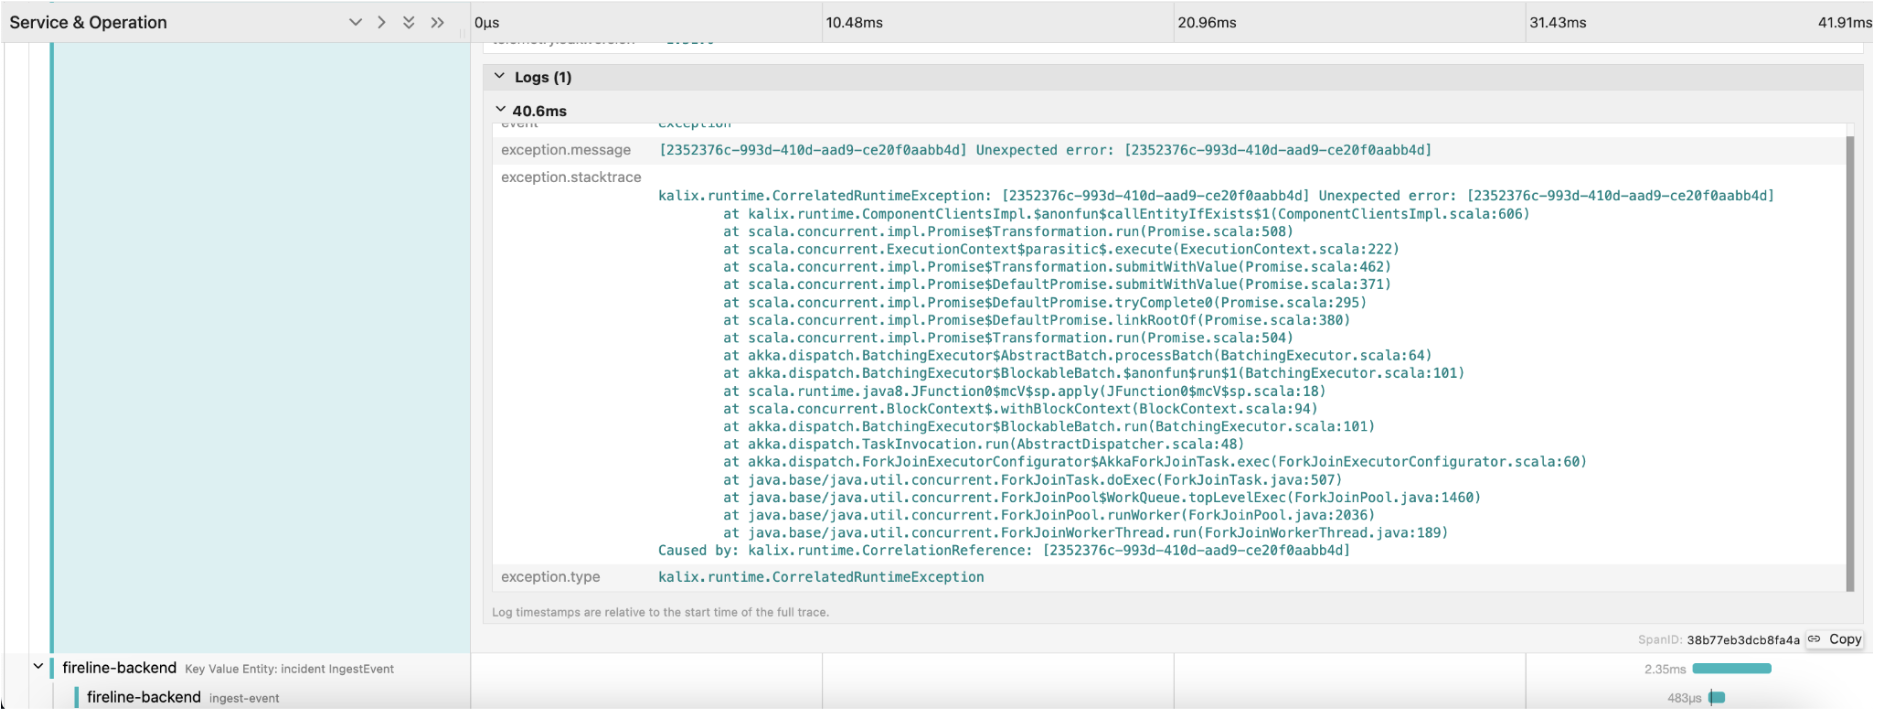
- Observability: Distributed tracing with Jaeger (OpenTelemetry)
- Notifications: Slack integration for real-time alerts
Challenges we ran into
- Tracing setup: Switched from Akka Console to Jaeger for reliable trace visualization
- Prompt injection: Implemented input validation and structured JSON parsing to mitigate LLM prompt injection
- Distributed testing: Used Akka SDK TestKit patterns for testing event-driven components
- Component orchestration: Coordinated Agents, Entities, and Consumers via ComponentClient
Accomplishments that we're proud of
- End-to-end pipeline: Events → incidents → triage → comms → UI working end-to-end
- Distributed tracing: Full visibility into the incident processing pipeline with Jaeger
- Comprehensive testing: Unit, integration, and agent tests with 90%+ coverage
- Slack integration: Real-time notifications with team-based routing and escalation
- Production-ready architecture: Durable state with KeyValueEntities, proper error handling, and observability
What we learned
- Akka SDK patterns: Agents, KeyValueEntities, Views, and component communication
- Distributed tracing: OpenTelemetry integration and trace visualization with Jaeger
- LLM safety: Prompt injection mitigation and structured output validation
- Event-driven architecture: Building resilient systems with Kafka-compatible streaming
What's next for Fireline
- More event types: Integrate monitoring systems (Datadog, New Relic) and chat platforms
- Richer UI: Real-time updates via WebSockets, incident timeline visualization, and status page integration
- Production hardening: Rate limiting, authentication, and multi-tenant support
- Advanced triage: ML-based incident correlation and automated remediation suggestions

Log in or sign up for Devpost to join the conversation.