-
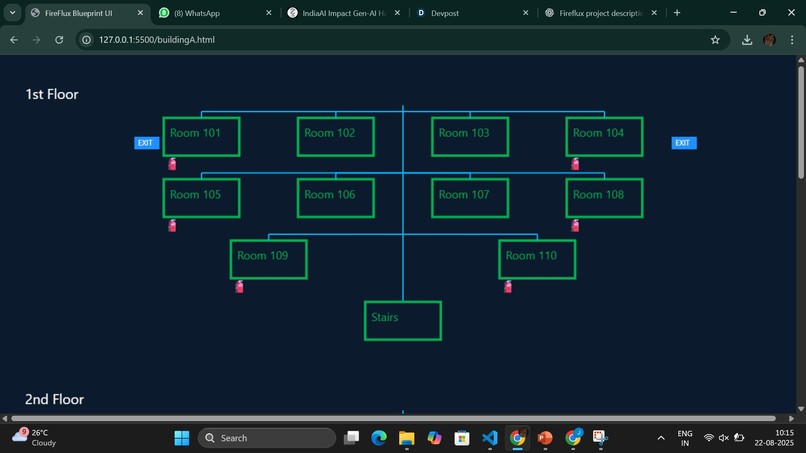
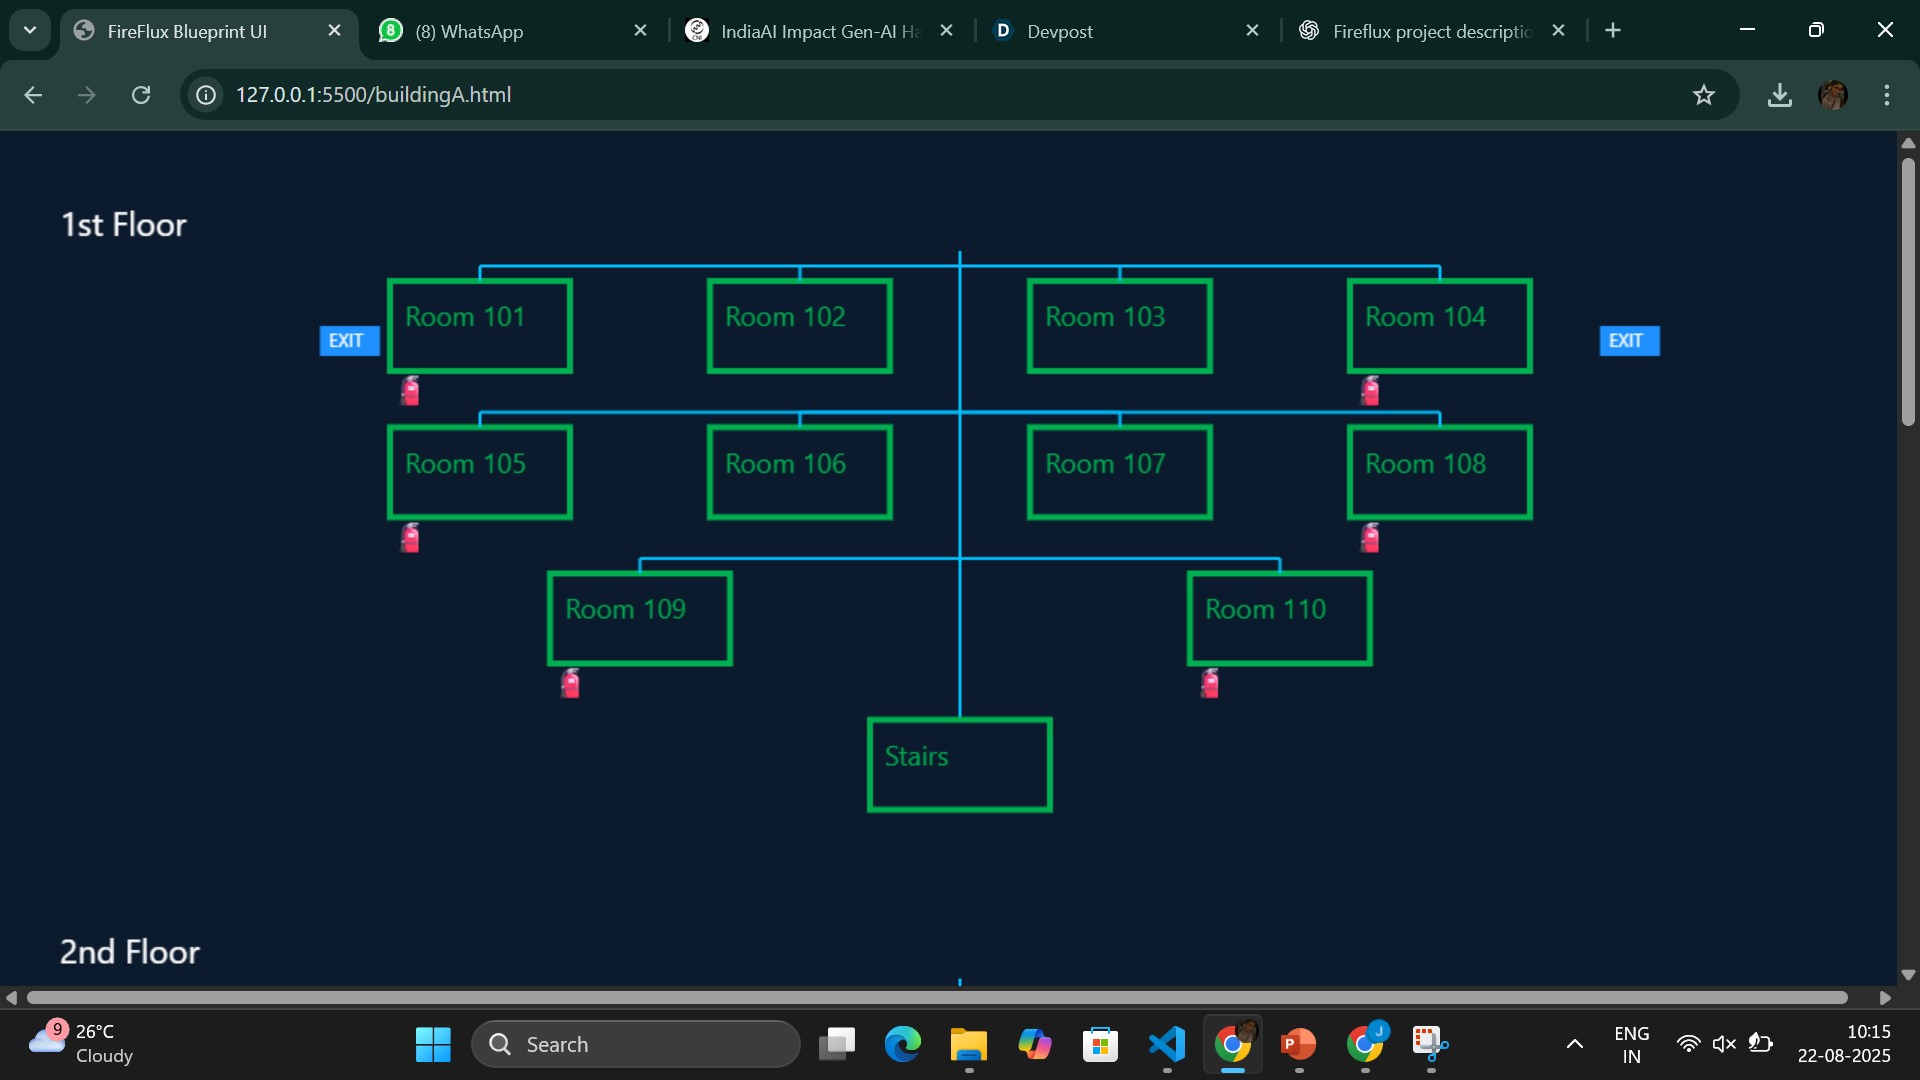
a building wide view showing the maps of building and the rooms and position of exits and fire extinguishers
-
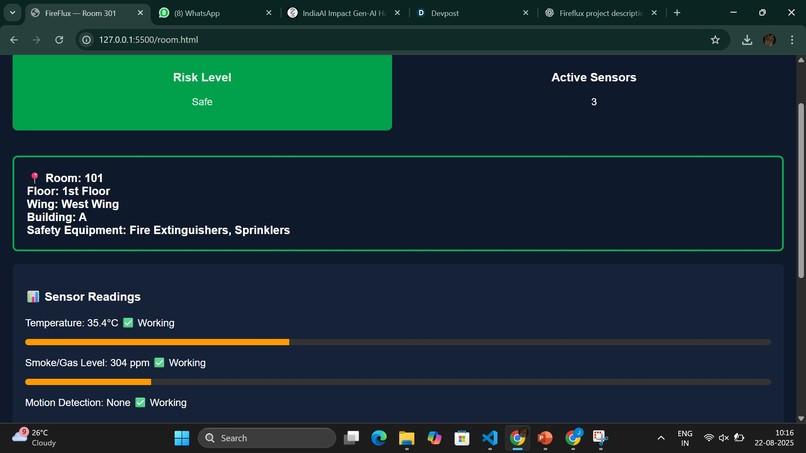
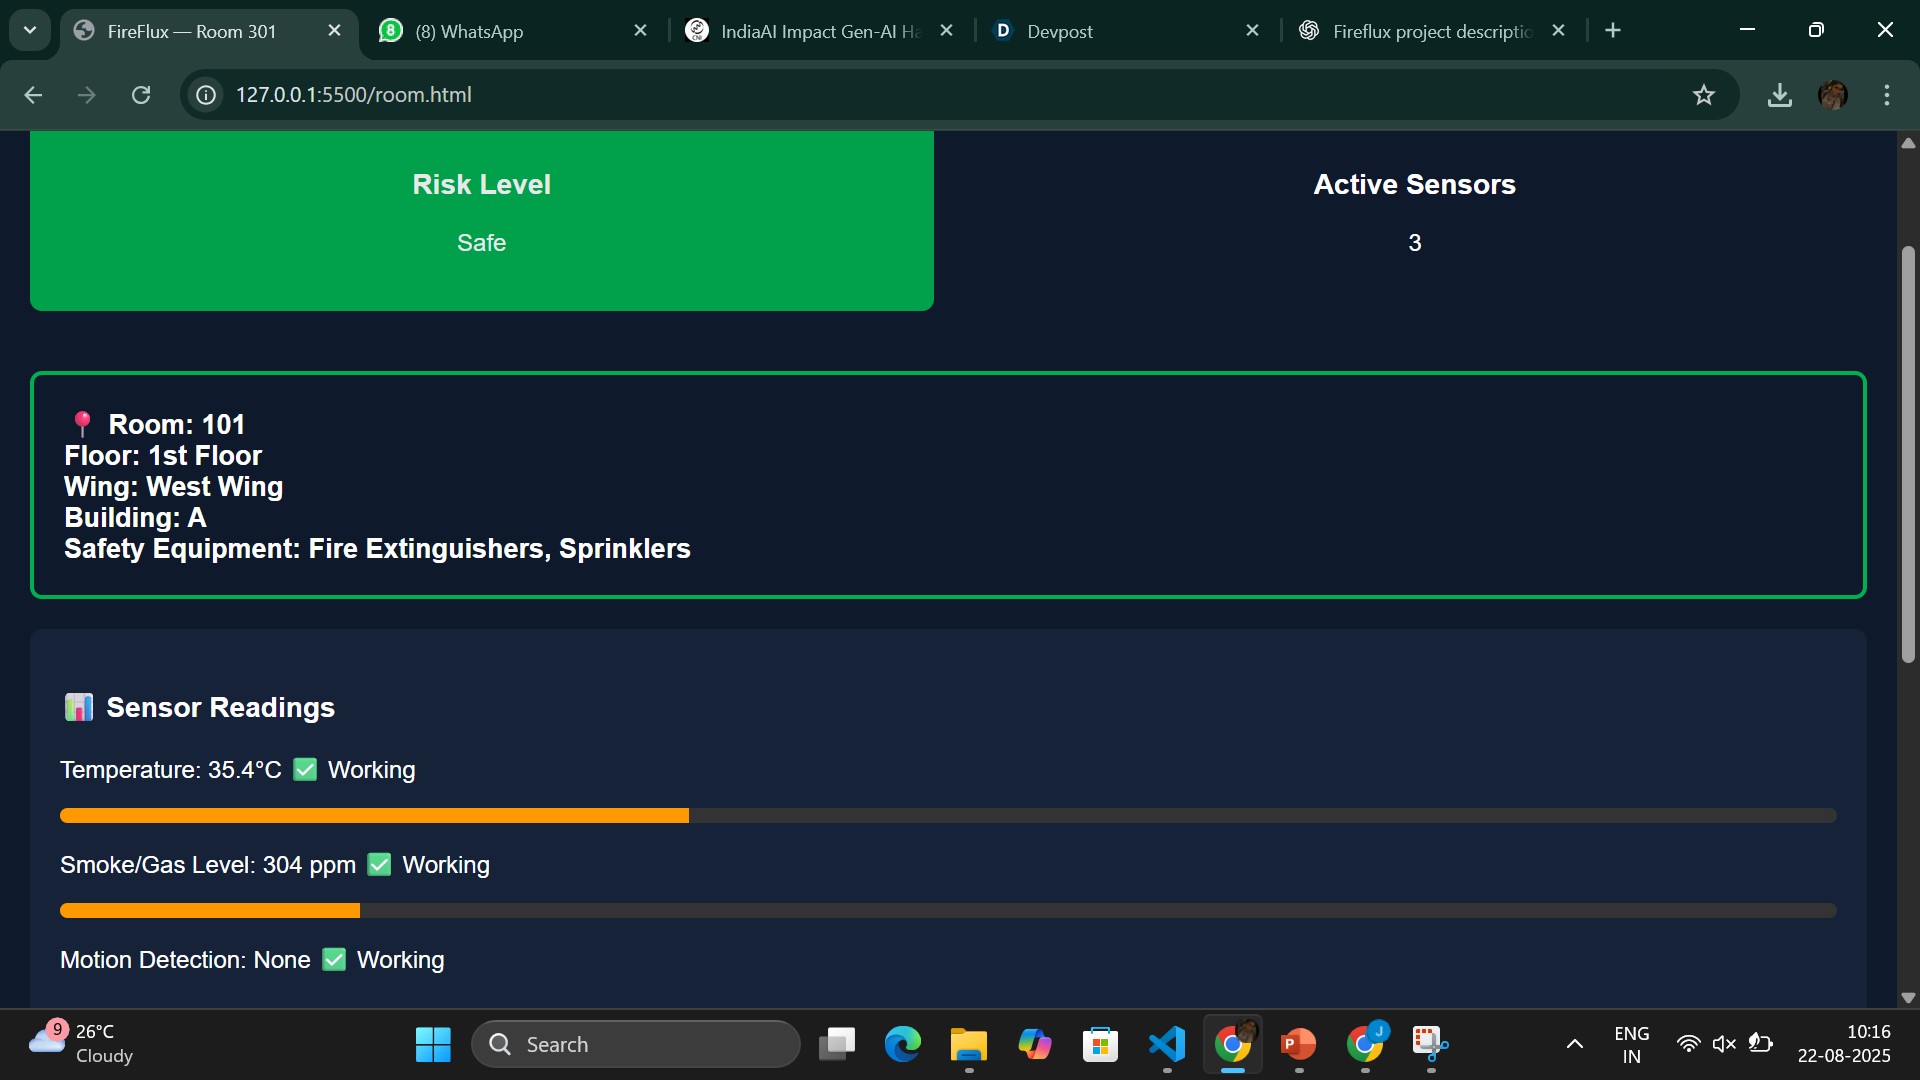
the room view knowing if every sensor is working or not, the risk level and sensor data it also comes with ai prediction telling what to do
-
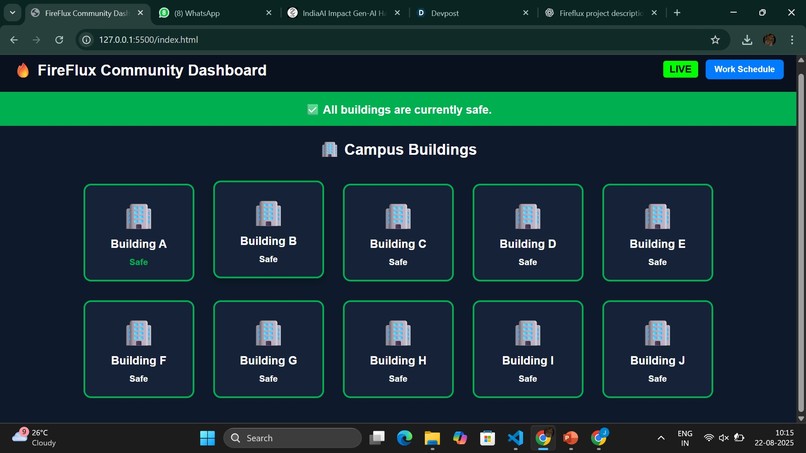
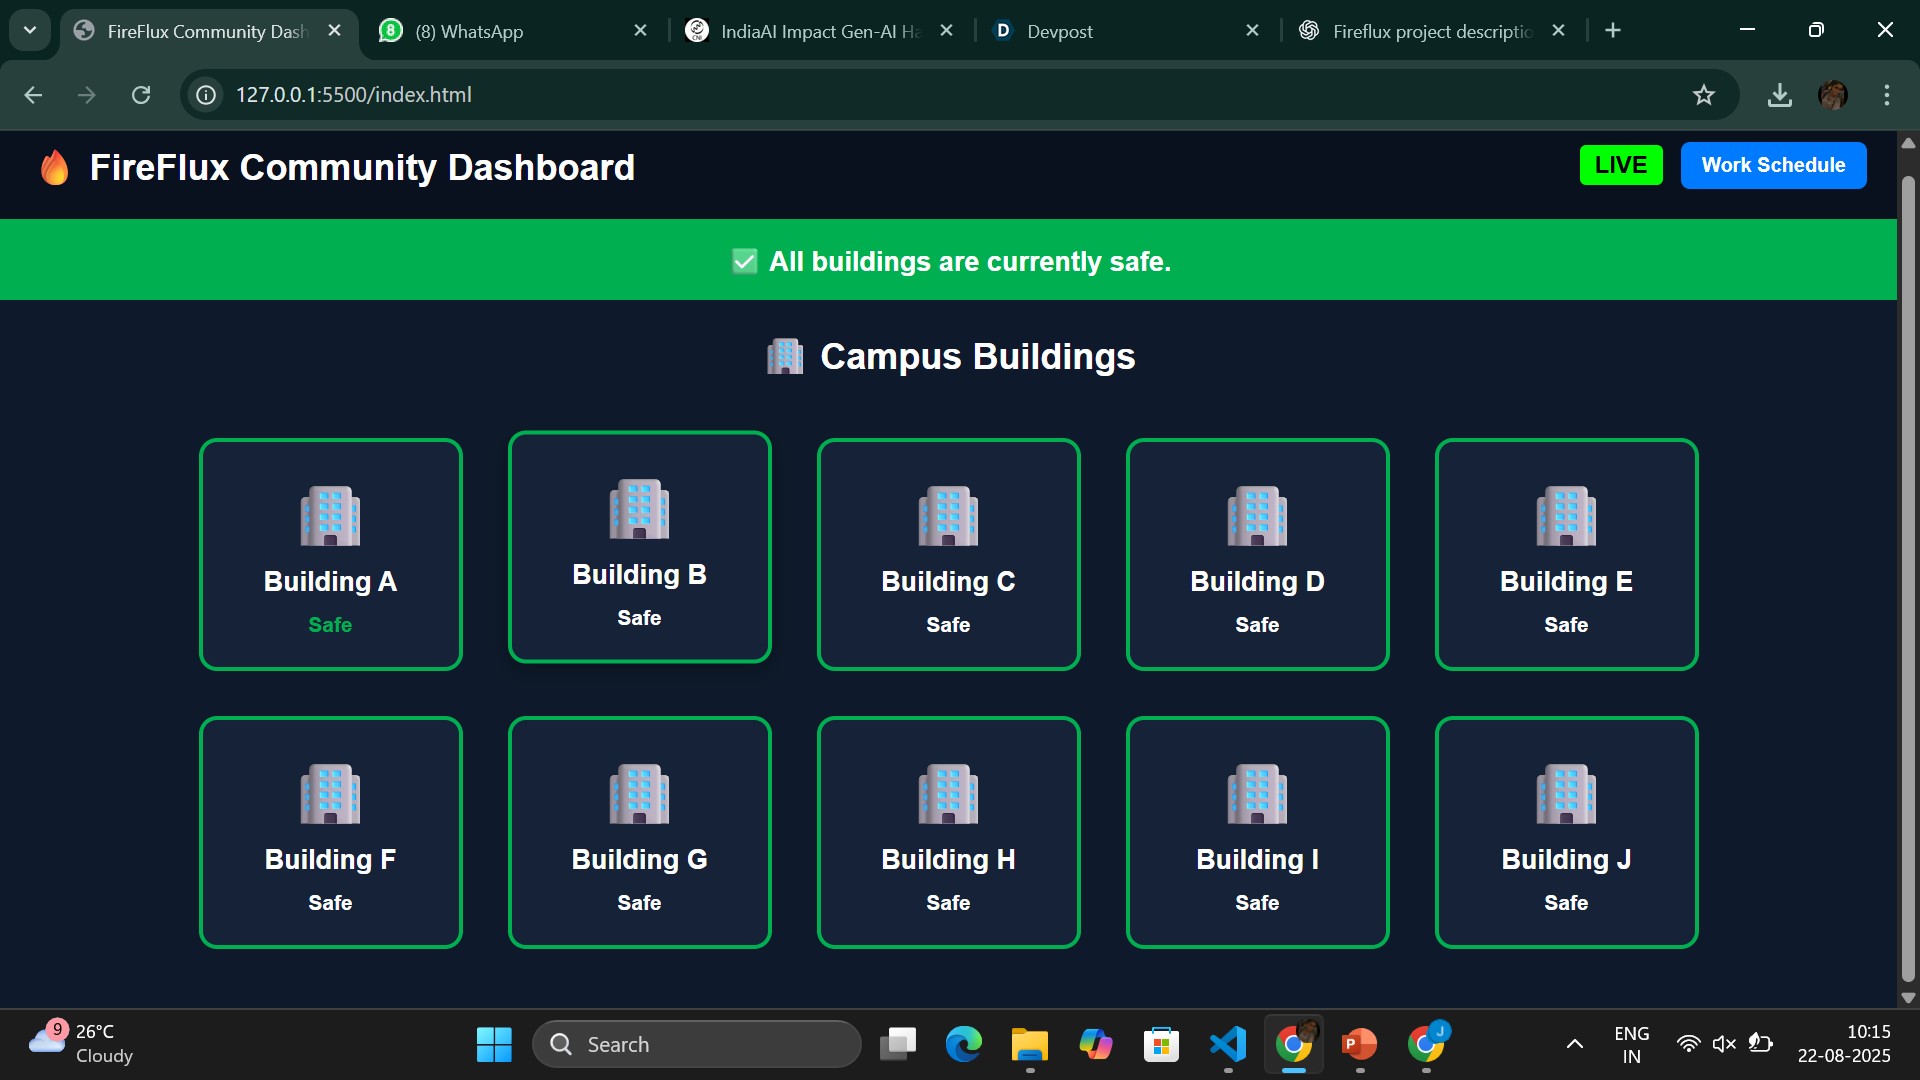
A building wide monitoring view to keep track if all buildings are safe without having to call during emergency
-
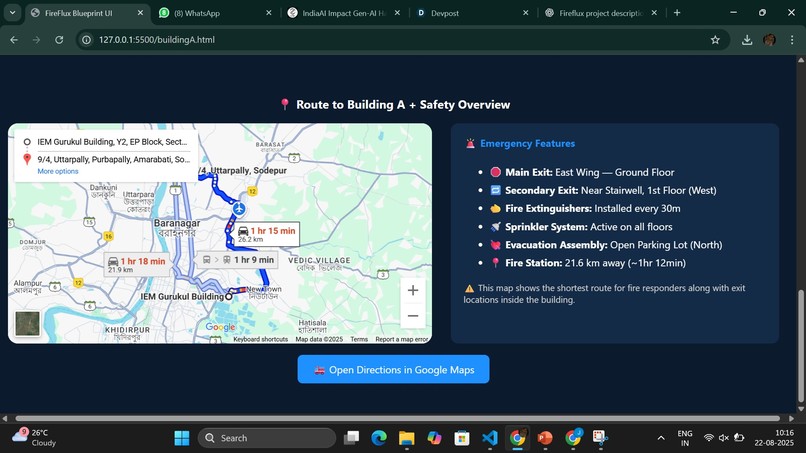
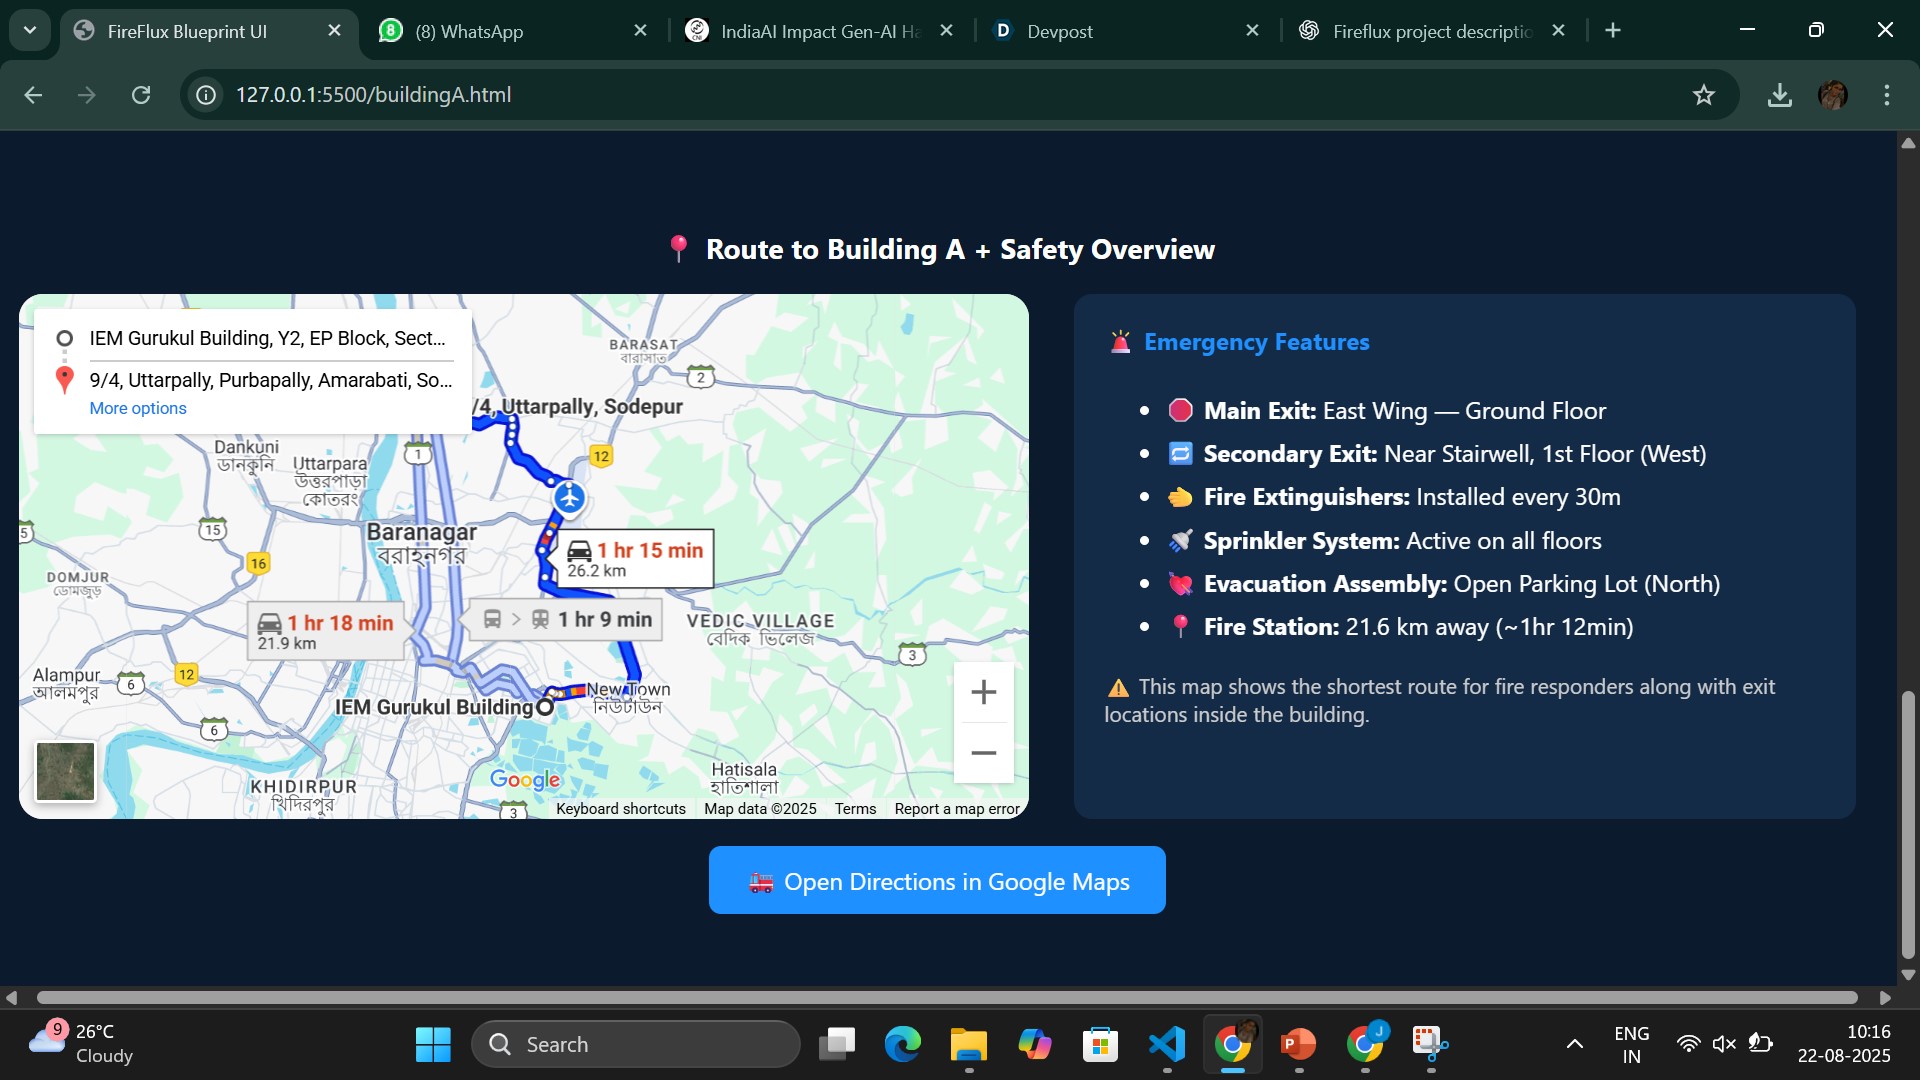
the presence of safety measures as well as google map to reach the building in case of emergency without need of manual intervention
Inspiration
Fire accidents in large buildings often escalate due to delayed detection, panic during evacuation, and lack of real-time intelligence for fire brigades. Tragic incidents in hospitals, malls, and residential complexes show how minutes and information can decide between safety and disaster. We wanted to build a system that not only detects fire risks early but also provides clear, visual intelligence to both building managers and responders.
What it does
FireFlux is an AI-powered fire monitoring system that:
Uses IoT sensors (temperature, smoke, and motion) to continuously monitor building conditions.
Predicts fire risks with color-coded alerts: 🟢 Safe, 🟡 Warning, 🔴 Danger.
Displays live building blueprints showing rooms, sensors, and fire extinguishers.
Uses Google Maps integration to give fire brigades real-time navigation and building location context.
Provides separate dashboards:
Building Manager Interface – monitors sensor health, room status, and receives AI safety suggestions.
Fire Brigade Interface – live blueprint with risk zones, extinguisher locations, exits, and predicted fire spread.
FireFlux acts as a smart fire safety assistant, turning raw sensor data into actionable visual intelligence.
How we built it
Hardware: ESP32, MQ2 smoke sensor, DHT11 temperature sensor, and PIR motion sensor.
Software: Arduino IDE for ESP32 programming, Firebase Realtime Database for cloud storage.
AI: Trained on simulated fire scenarios to predict risk levels with color-coded classification.
UI: Interactive blueprint + Google Maps integration, with role-based dashboards (manager vs. brigade).
Challenges we ran into
Ensuring real-time color-coded updates without lag in Firebase.
Designing different UIs for fire brigades and managers while using the same data source.
Mapping fire safety resources (extinguishers, exits) onto blueprints and syncing with AI predictions.
Creating realistic fire data for AI model training.
Accomplishments that we're proud of
Built a working prototype that combines IoT sensors + AI + cloud + visual dashboards.
Clear color-coded risk indicators that simplify decision-making under pressure.
Seamless integration of building blueprints and Google Maps for contextual awareness.
Two distinct interfaces for different stakeholders, ensuring relevant information delivery.
What we learned
Real-time IoT + AI pipelines can make safety systems actionable and scalable.
Visual cues (color coding, maps) are more effective in emergencies than raw numbers.
Importance of user-centered design in safety systems—different roles need different information.
What's next for FireFlux
Expand to support heat cameras, sprinklers, and advanced fire detectors.
Deploy pilot tests in campuses, hospitals, and commercial buildings.
Connect with government fire control rooms for smart city integration.
Add AI-based evacuation route optimization with live crowd movement tracking.
Built With
- arduino
- arduinoide
- c++
- css
- esp32
- firebase
- google-maps
- html
- javascript
- python
- scikit-learn
- vscode

Log in or sign up for Devpost to join the conversation.