FireCast
Inspiration
Wildfires can turn from a small environmental hazard into a major disaster surprisingly quickly. One of the biggest opportunities for reducing their impact is early detection of dangerous conditions rather than waiting until a fire has already started.
That idea inspired FireCast: instead of simply detecting a fire, I wanted to build a system that asks a more useful question:
“Do the current environmental conditions look dangerous enough that a wildfire is likely to occur within the next 24 hours?”
I wanted the project to combine machine learning, environmental data, and a live sensor pipeline into something that could actually be demonstrated end-to-end.
What FireCast Does
FireCast predicts the probability of a wildfire occurring within the next 24 hours using environmental conditions.
The system considers factors including:
- Temperature
- Dew point
- Precipitation
- Soil moisture
- Wind speed
- Recent weather trends
- Dry-day patterns
- Changes in temperature and soil moisture
- Seasonal patterns
Rather than relying only on the current sensor reading, FireCast creates 41 features from current and historical environmental conditions. These are passed into an XGBoost classification model, which produces a fire probability.
The probability is then converted into four simple risk levels:
LOW        < 0.30
MODERATE   0.30 – <0.55
HIGH       0.55 – <0.75
CRITICAL   >= 0.75
This makes the output much easier to understand than a raw machine-learning prediction.
How I Built It
I started by building a historical dataset from California wildfire and weather information. Historical wildfire perimeters were used to determine whether a fire occurred in a particular area and time period, while weather information provided the environmental conditions leading up to those events.
I then engineered features that captured both short-term conditions and longer-term trends. For example, FireCast does not only look at today's soil moisture. It can also consider soil moisture from the previous reading, rolling averages over 3, 7, and 14 days, and how much soil moisture has changed.
The final machine-learning dataset contained 27,812 observations and 41 features.
I first created a logistic-regression baseline and then trained an XGBoost classifier. The XGBoost model performed better on the held-out test data:
- ROC-AUC: 0.6978
- PR-AUC: 0.4075
- F1 score: 0.4734
The model was saved and integrated into the live inference pipeline.
The Live Pipeline
Recorded Sensor Data
        ↓
FireCast HTTP Bridge
        ↓
Historical Feature Buffer
        ↓
41 Engineered Features
        ↓
XGBoost Model
        ↓
Fire Probability
        ↓
Risk Classification
        ↓
CSV Logs + Dashboard
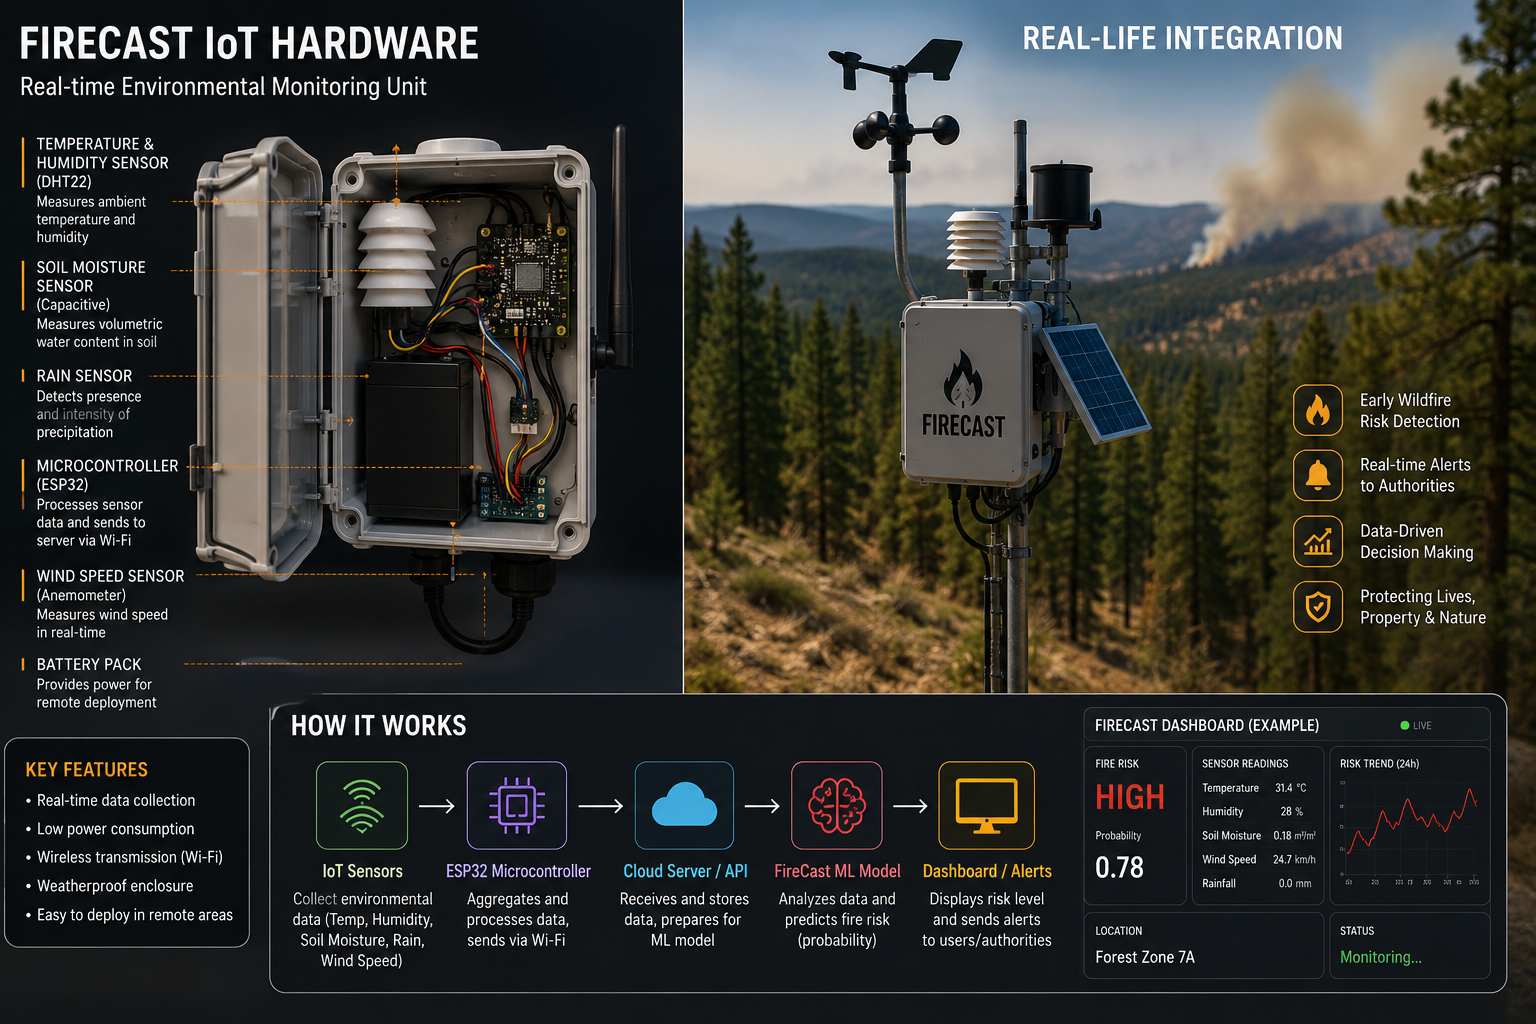
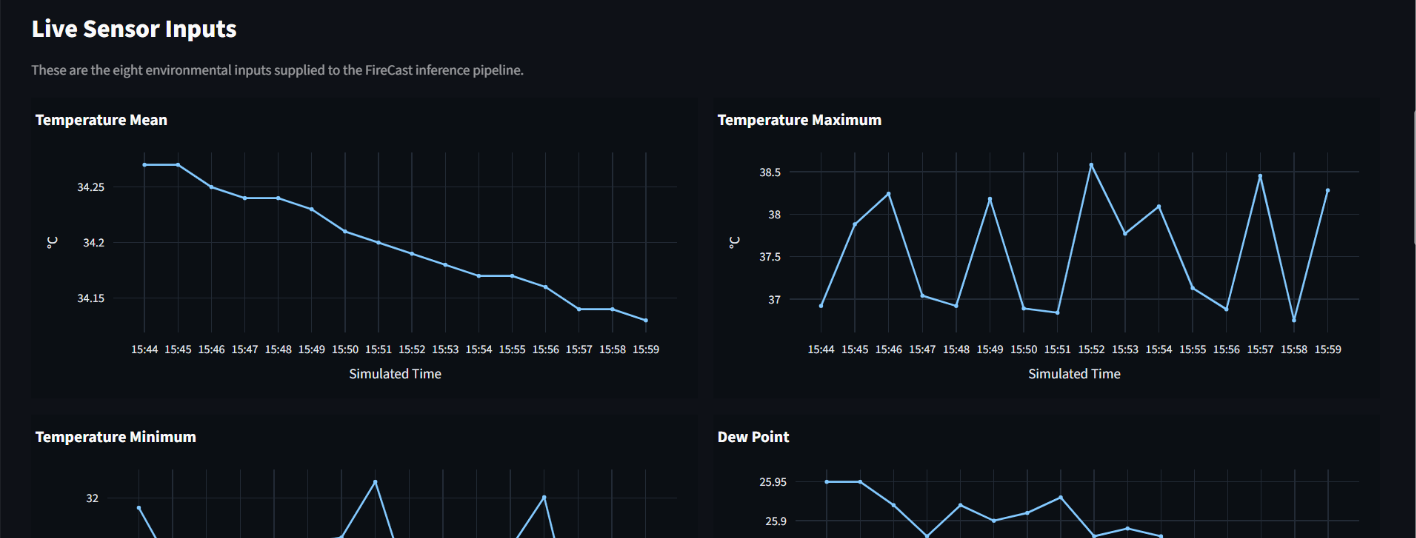
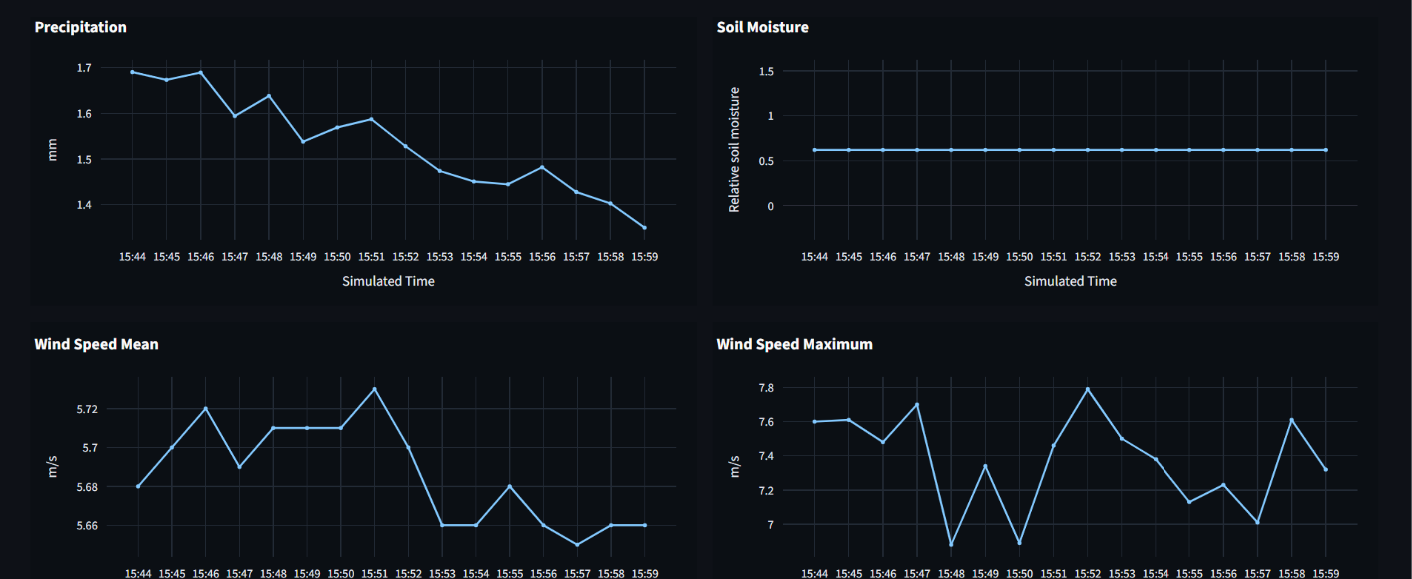
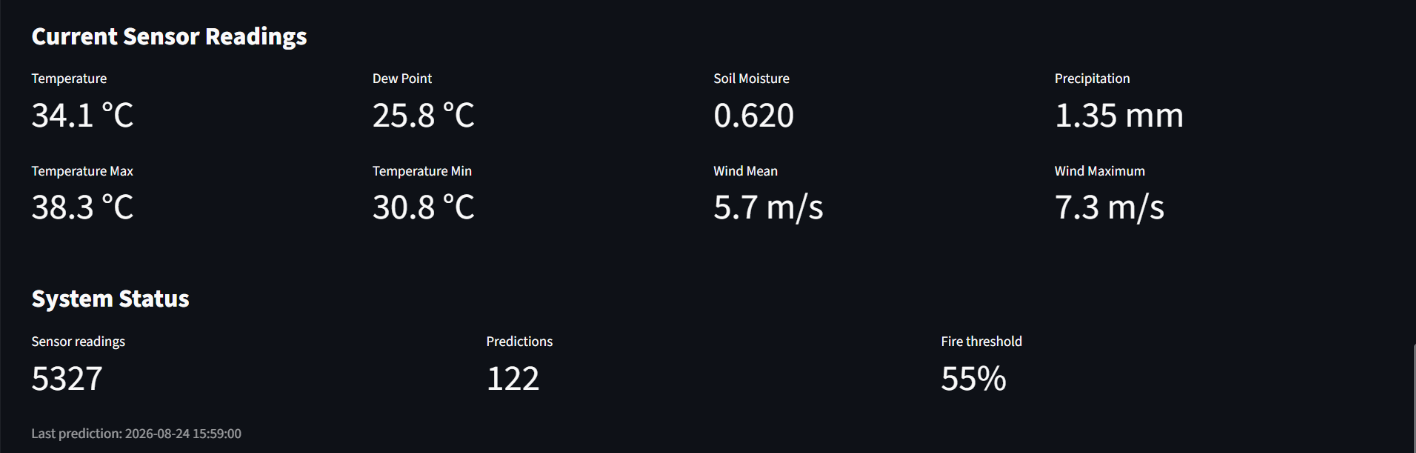
The live bridge receives eight environmental sensor values and reconstructs the complete 41-feature input required by the model.
For the demonstration, I created a recorded sensor replay system. This simulates a real environmental sensor station without requiring physical hardware during the presentation. The replay generates changing temperature, dew point, soil moisture, wind, and precipitation conditions over a simulated 14-day period.
The replay sends those readings to a Flask-based HTTP endpoint, where FireCast processes them just as it would process incoming sensor data.
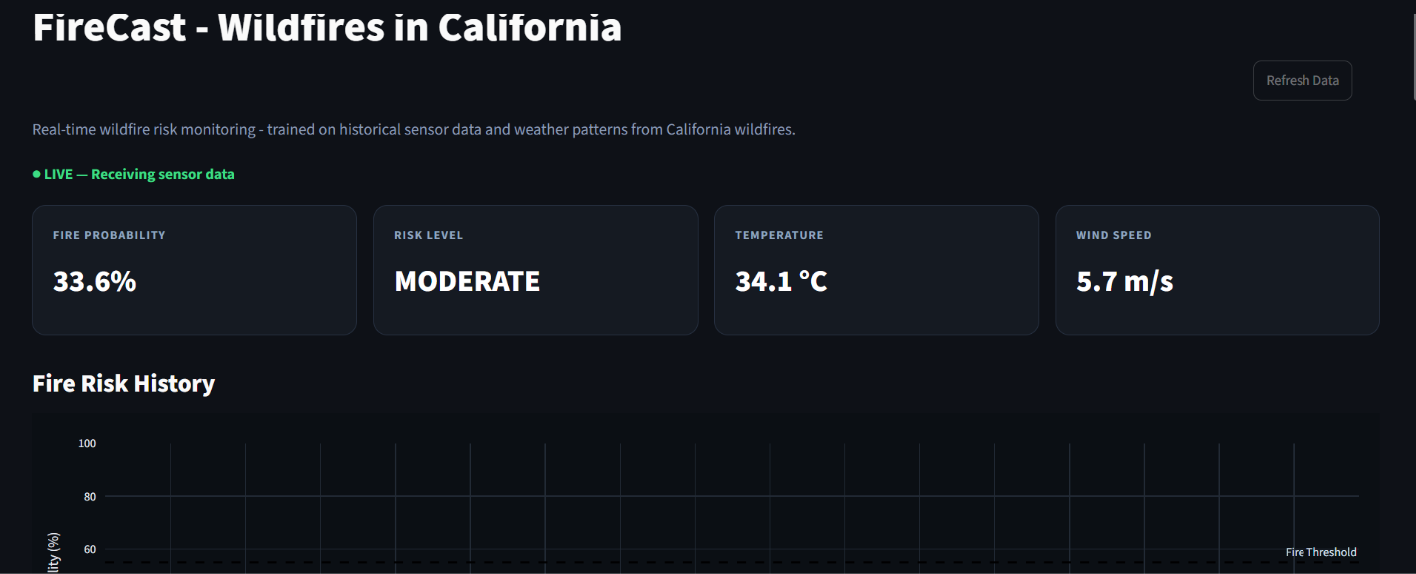
Finally, I built a Streamlit dashboard with Plotly visualizations so the predictions and environmental conditions can be observed in real time.
What I Learned
This project taught me that building a machine-learning application is much more than training a model.
I learned how to:
- Work with large environmental datasets.
- Transform raw weather data into meaningful ML features.
- Build time-based train, validation, and test splits.
- Train and evaluate an XGBoost classification model.
- Select and lock a prediction threshold.
- Build a real-time inference pipeline around a trained model.
- Maintain historical sensor data for rolling features.
- Build an HTTP interface between a sensor source and an ML system.
- Create an interactive Streamlit dashboard.
- Simulate a realistic sensor stream for testing and demonstration.
- Debug problems that occur between the model, backend, data pipeline, and frontend.
One particularly important lesson was that a model can be working correctly while the application around it is still wrong. During development, I encountered issues where the sensor simulator was producing the correct values, but the dashboard was displaying a different section of the historical timeline. Debugging that required tracing the data through the entire pipeline rather than only looking at the model.
Challenges
1. Turning Raw Data into Useful ML Features
A wildfire is not caused by one measurement. A single hot reading does not necessarily mean that a location is at high risk.
I therefore had to combine instantaneous measurements with historical context. Rolling 3-day, 7-day, and 14-day features helped represent how environmental conditions had evolved over time.
2. Avoiding Temporal Leakage
Because FireCast predicts future fire activity, randomly splitting the dataset would not be appropriate. I used a temporal split, keeping later dates for validation and testing.
This better represents how the model would behave when making predictions about the future.
3. Connecting Machine Learning to Live Data
The trained model expects 41 features, but the live sensor interface only provides eight raw environmental measurements.
The bridge therefore had to maintain historical sensor readings and calculate the remaining features dynamically before sending them to XGBoost.
4. Building a Realistic Demonstration
I did not want the demonstration to depend on physical hardware or a perfectly controlled manual setup.
Instead, I created a recorded sensor replay that evolves gradually over time and includes realistic environmental changes such as drying periods and rainfall events. This makes it possible to demonstrate the complete pipeline repeatedly and consistently.
5. Making the Prediction Understandable
A probability such as 0.637 is not immediately meaningful to someone looking at a dashboard.
FireCast therefore converts the probability into a clear risk category while still displaying the underlying probability and environmental measurements.
The Result
FireCast combines machine learning, environmental data, real-time inference, and visualization into one complete wildfire-risk prediction pipeline.
The final system can take changing environmental conditions, transform them into the same features used during training, generate a wildfire probability, classify the current risk, record the prediction, and display everything through a live dashboard.
The project ultimately became more than just an ML model. It became an end-to-end prototype showing how a trained model can be connected to a simulated real-world data source and turned into an application that people can actually interact with.
Built With
- ai
- database
- python
- training
- wildfire


Log in or sign up for Devpost to join the conversation.