-
-
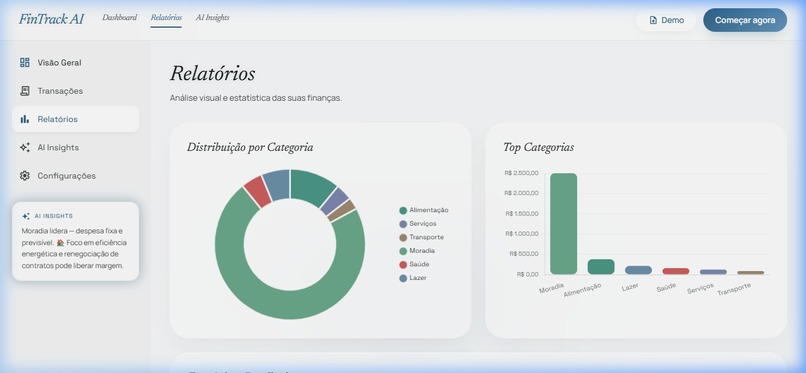
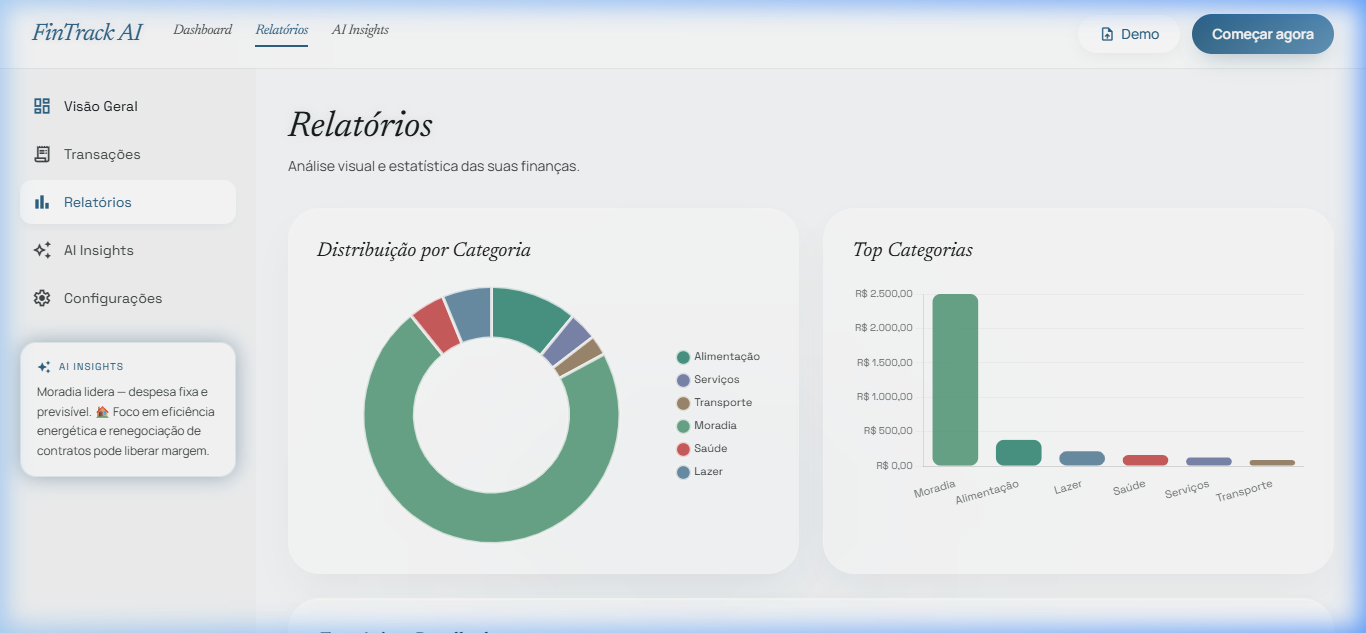
Reports
-

credits
-
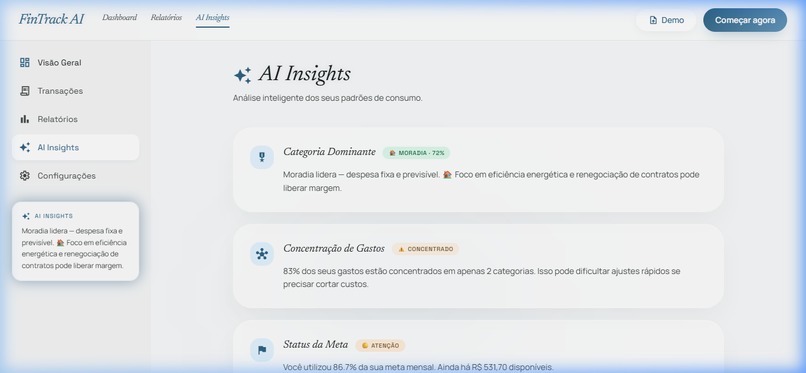
AI Insights
-
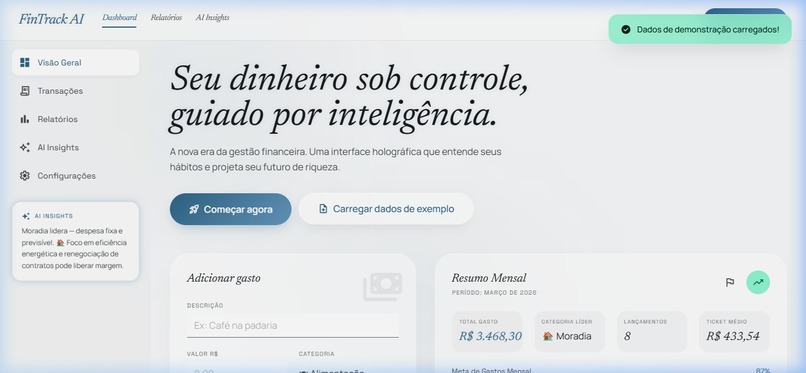
Dashboard
💡 Inspiration
68% of Brazilians don't track their personal finances. Not because they don't want to — but because every tool they've tried was too complex, required a bank login, demanded a paid subscription, or simply looked like a spreadsheet from 2003.
I'm 17, living in Brasília, and I've watched people around me make financial decisions without any data — my family included. When the Octoverse Hackathon launched, I saw a clear challenge: could I build something so frictionless that someone could get a full picture of their monthly spending in under 30 seconds, with zero setup?
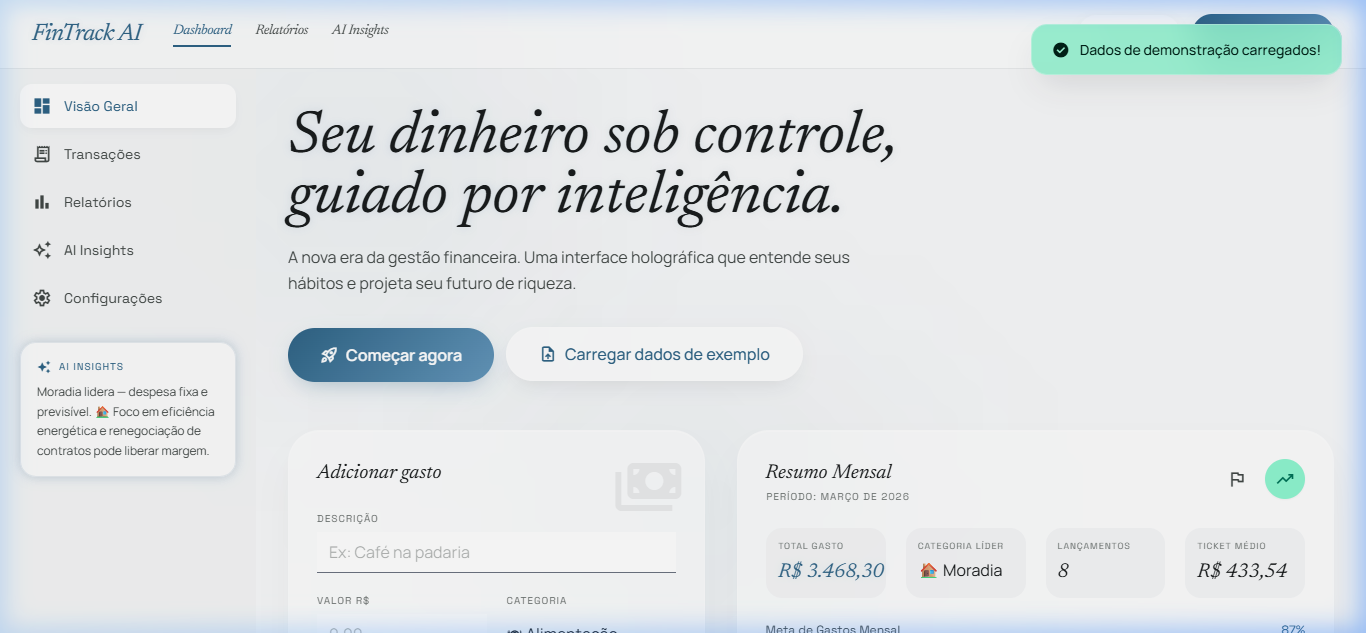
That became FinTrack AI — a financial intelligence dashboard that runs entirely in the browser, requires no account, and treats your data as yours: stored locally, never sent anywhere.
🏗️ What I Built
FinTrack AI is a client-side personal finance dashboard with a behavioral AI engine. It features:
- Real-time expense tracking — add transactions in seconds with smart category defaults
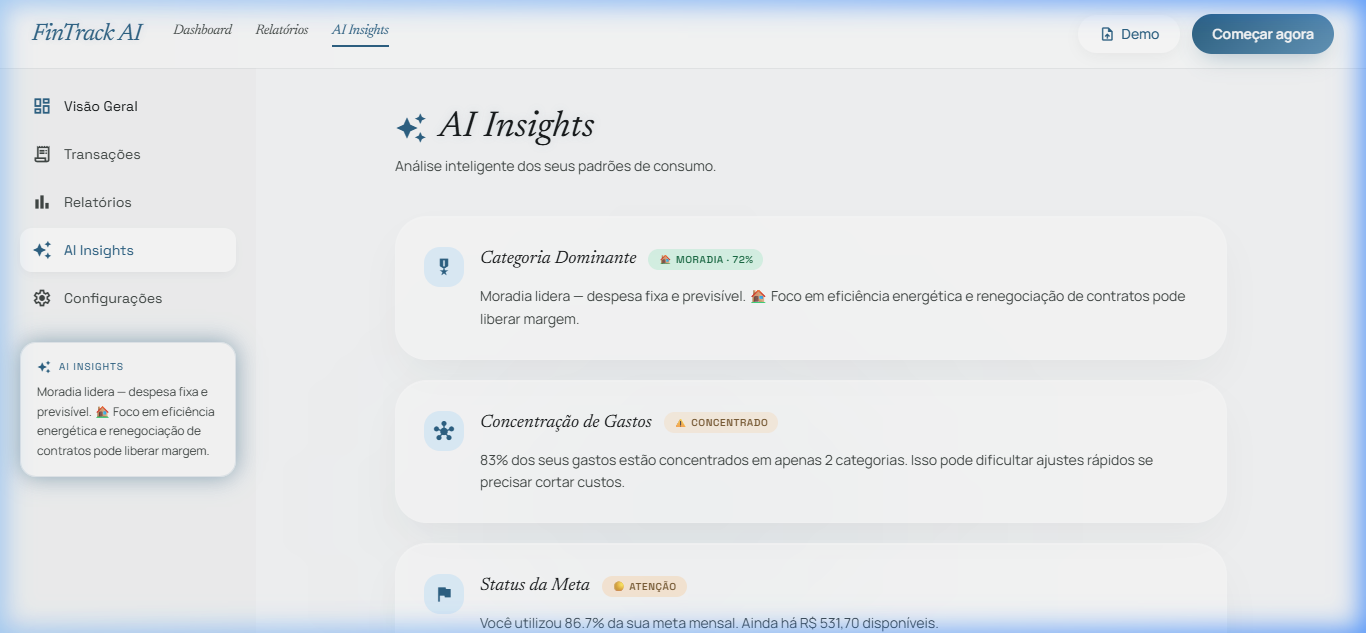
- AI Insights engine — detects spending patterns and generates personalized recommendations automatically
- Interactive charts — donut and bar charts via Chart.js, updating live as data changes
- Monthly goal system — dynamic progress bar that shifts from 🟢 green to 🟡 orange to 🔴 red
- Full transaction history — search, filter by category, sort by date or value
- Dark mode — real toggle with OS preference detection and
localStoragepersistence - "Why This Matters" section — three value-prop cards surfaced directly on the dashboard
The entire app is a single index.html + app.js — no build step, no install, no backend.
⚙️ How I Built It
Architecture
index.html  →  UI shell (5 views, modals, toasts, dark mode CSS)
app.js      →  ~1,100 lines: state, rendering, AI engine, UX utilities
AI Insight Engine
The AI layer uses deterministic behavioral analysis — no API calls, zero latency, full privacy. Four signals drive the insights:
\( \text{dominance}(c) = \frac{\sum_{t \in c} v_t}{\sum_{\text{all}} v_t} \times 100 \)
| Signal | Trigger | Insight generated |
|---|---|---|
| Category dominance | top category > 60% | "Concentrated spending" warning |
| Spending concentration | top 2 categories > 80% | "Diversify" recommendation |
| Goal burn rate | spent > 80% of goal | Budget urgency alert |
| Outlier detection | max > 3× average | "Unusual purchase" flag |
🚧 Challenges I Faced
1. Dark mode without a CSS framework that owns it — escrevi 50+ regras .dark manualmente para cobrir cada superfície sem quebrar o light theme.
2. Chart.js em dark/light dinâmico — canvas não re-renderiza no toggle; tive que destruir e recriar cada instância de gráfico passando novos configs de cor.
3. AI que soa inteligente, não scriptada — a parte mais difícil não foi a lógica, foi o tom. Iteração pesada na linguagem de cada insight para soar pessoal, não robótico.
4. State management sem framework — 5 views, 2 modais, 3 gráficos, filtros, sync com localStorage — tudo em Vanilla JS puro com um padrão updateUI() centralizado.
📚 What I Learned
- Restraint is a superpower. Every time I wanted to add a dependency, I asked: "can I build this in 20 lines of JS?" — usually the answer was yes.
- Design systems pay off immediately. 2h de token system economizou 10h de inconsistências visuais.
- Users trust what they understand. A copy "zero servidor" no dashboard é um trust signal real.
- AI transparency matters. Documentei explicitamente que o AI usa regras determinísticas — jurados merecem saber.
🔭 What's Next
- Gemini API — natural language queries sobre seus gastos
- CSV import — compatibilidade com extratos bancários
- PWA — uso offline + instalação na home screen
- Supabase sync — persistência cross-device opt-in
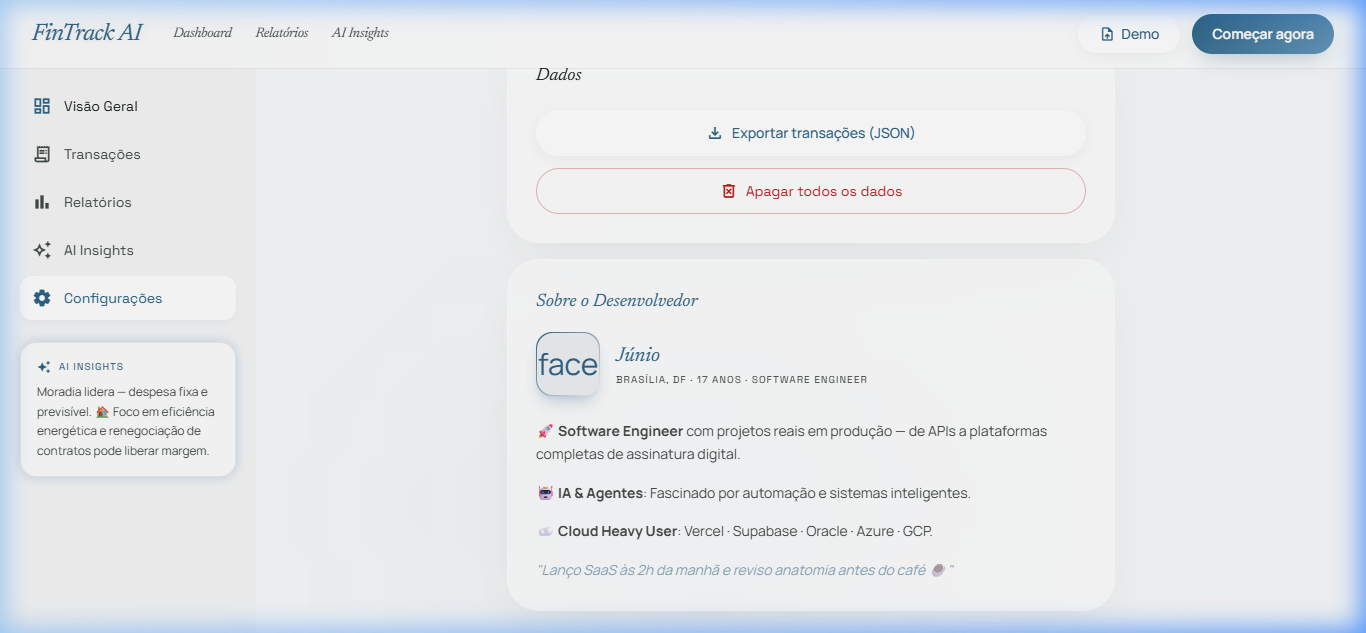
👨💻 About Me
I'm Júnio, 17, from Brasília, Brazil — Software Engineer with real projects in production.
"I ship SaaS at 2 AM and review anatomy before coffee." ☕
Built With
- chart.js
- css3
- github
- google-fonts
- html5
- javascript-(es2022)
- localstorage-api
- material-symbols
- tailwind-css

Log in or sign up for Devpost to join the conversation.