-
-
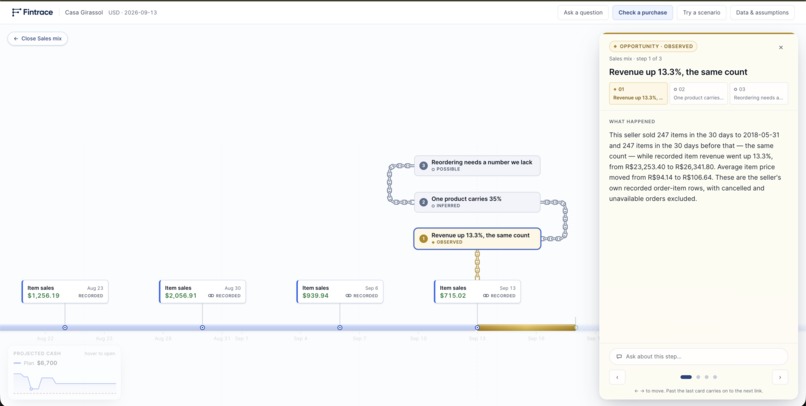
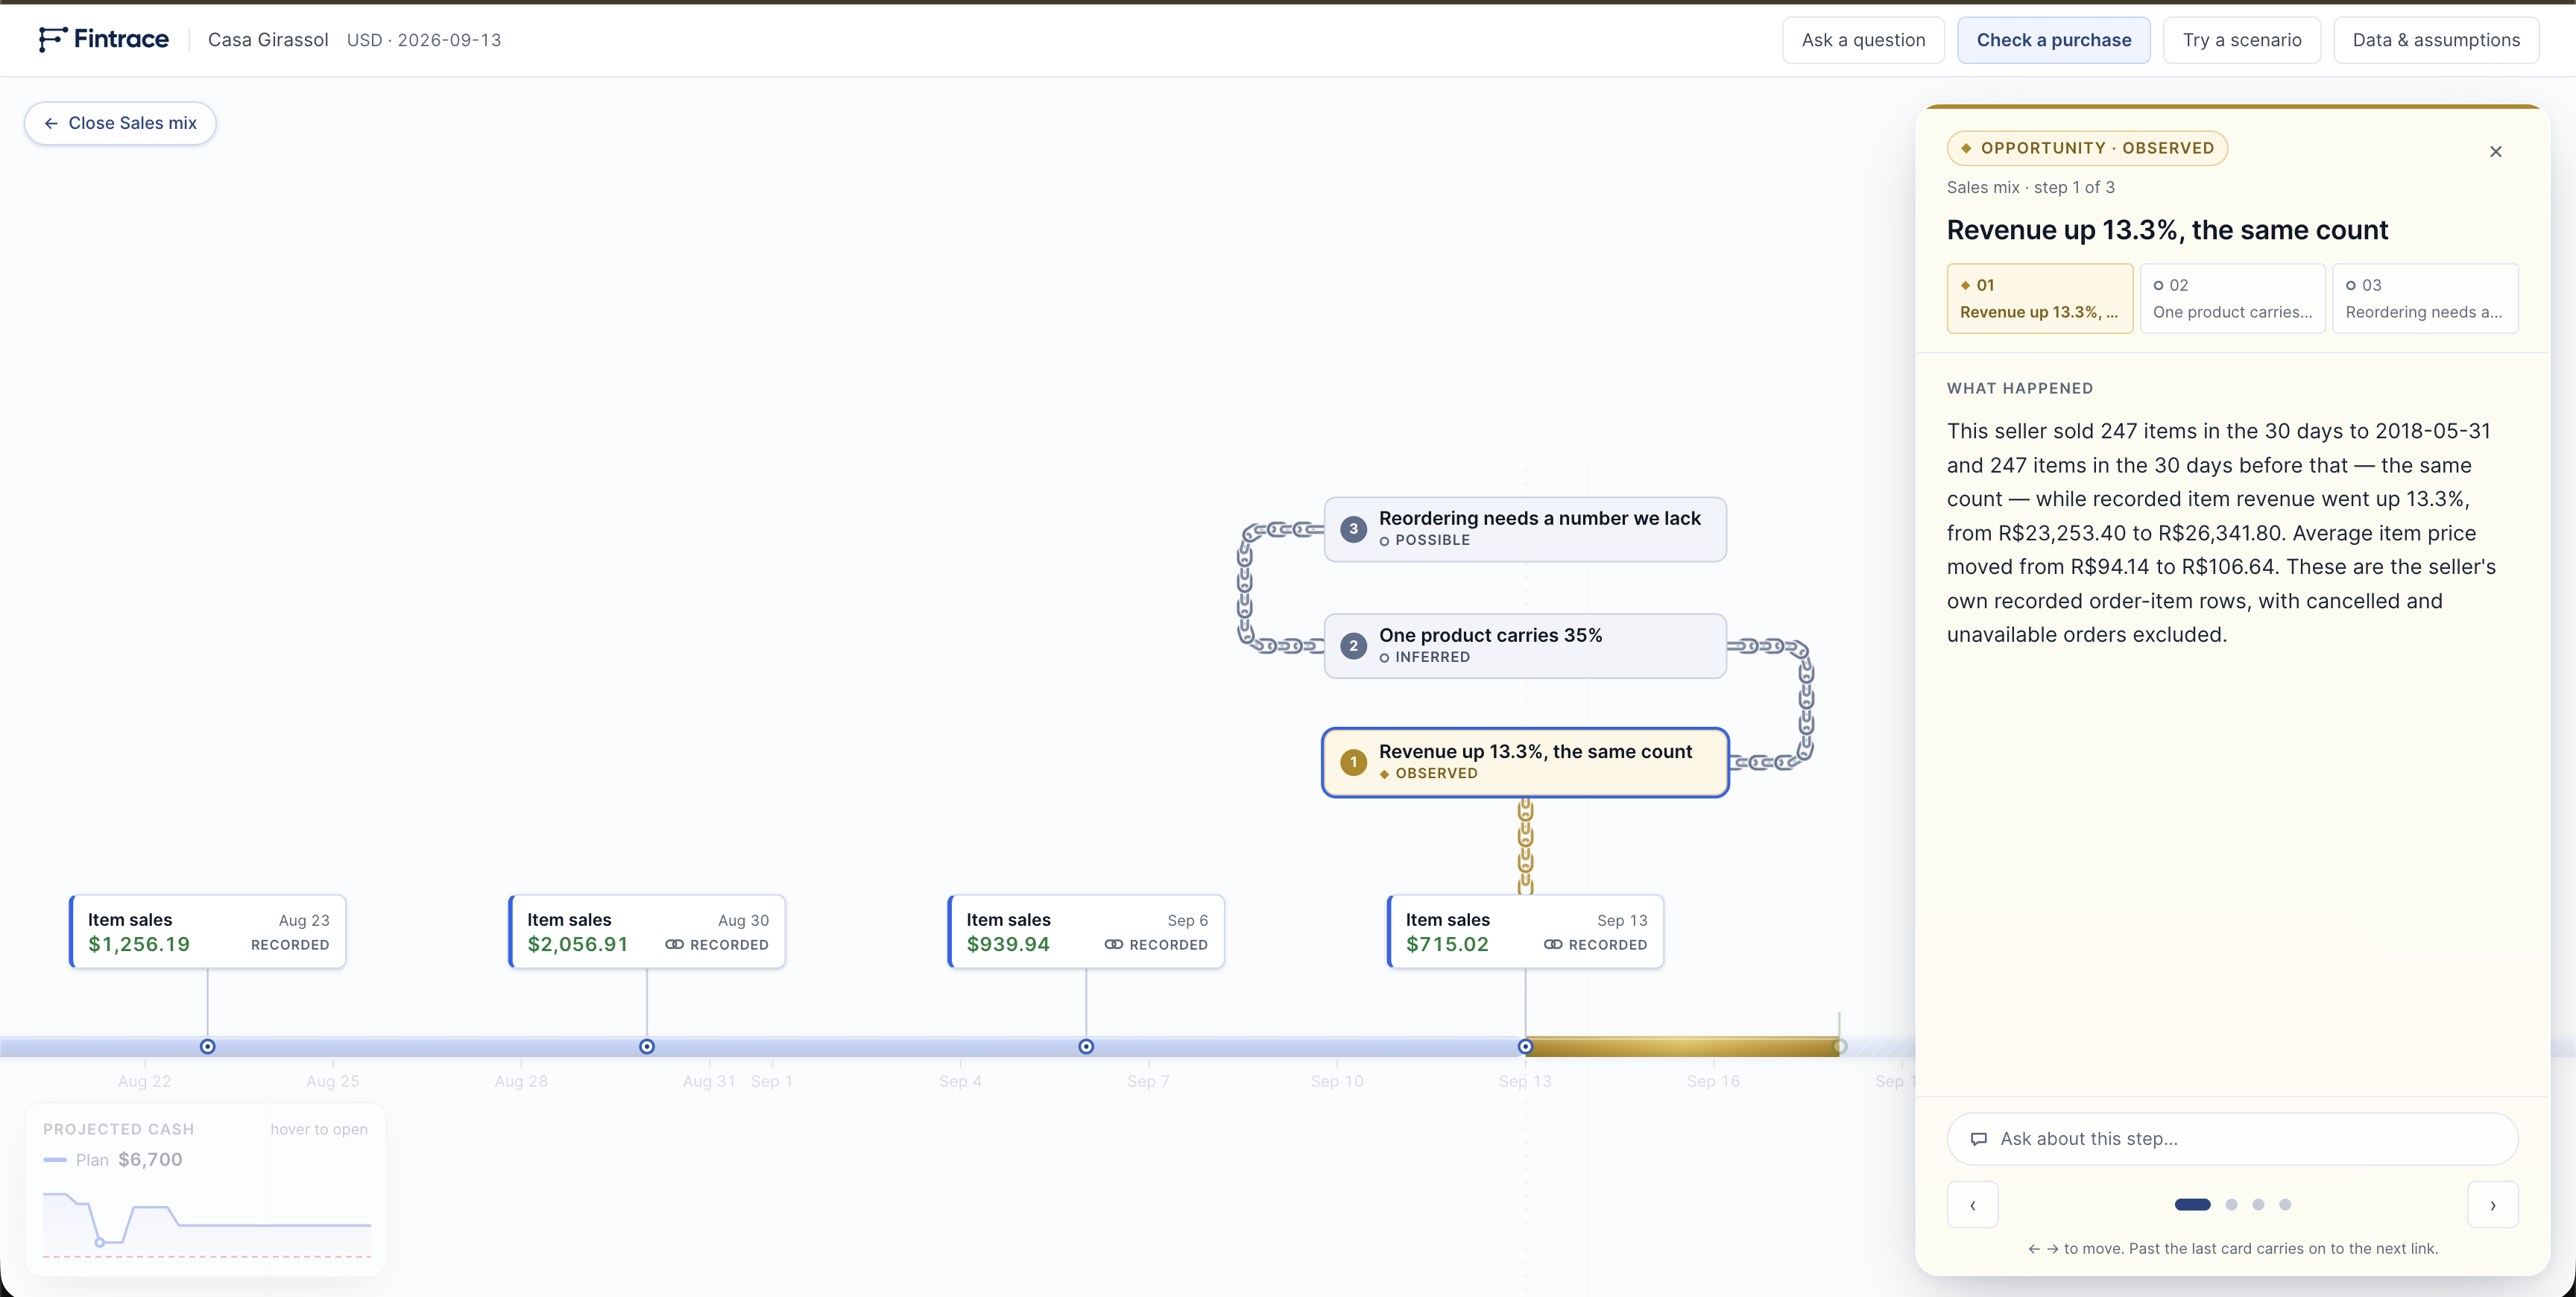
Chain Visualization and side menu description for the timeline.
-
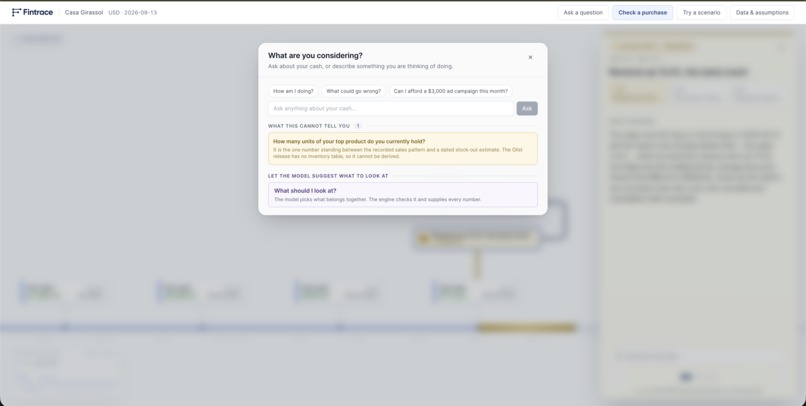
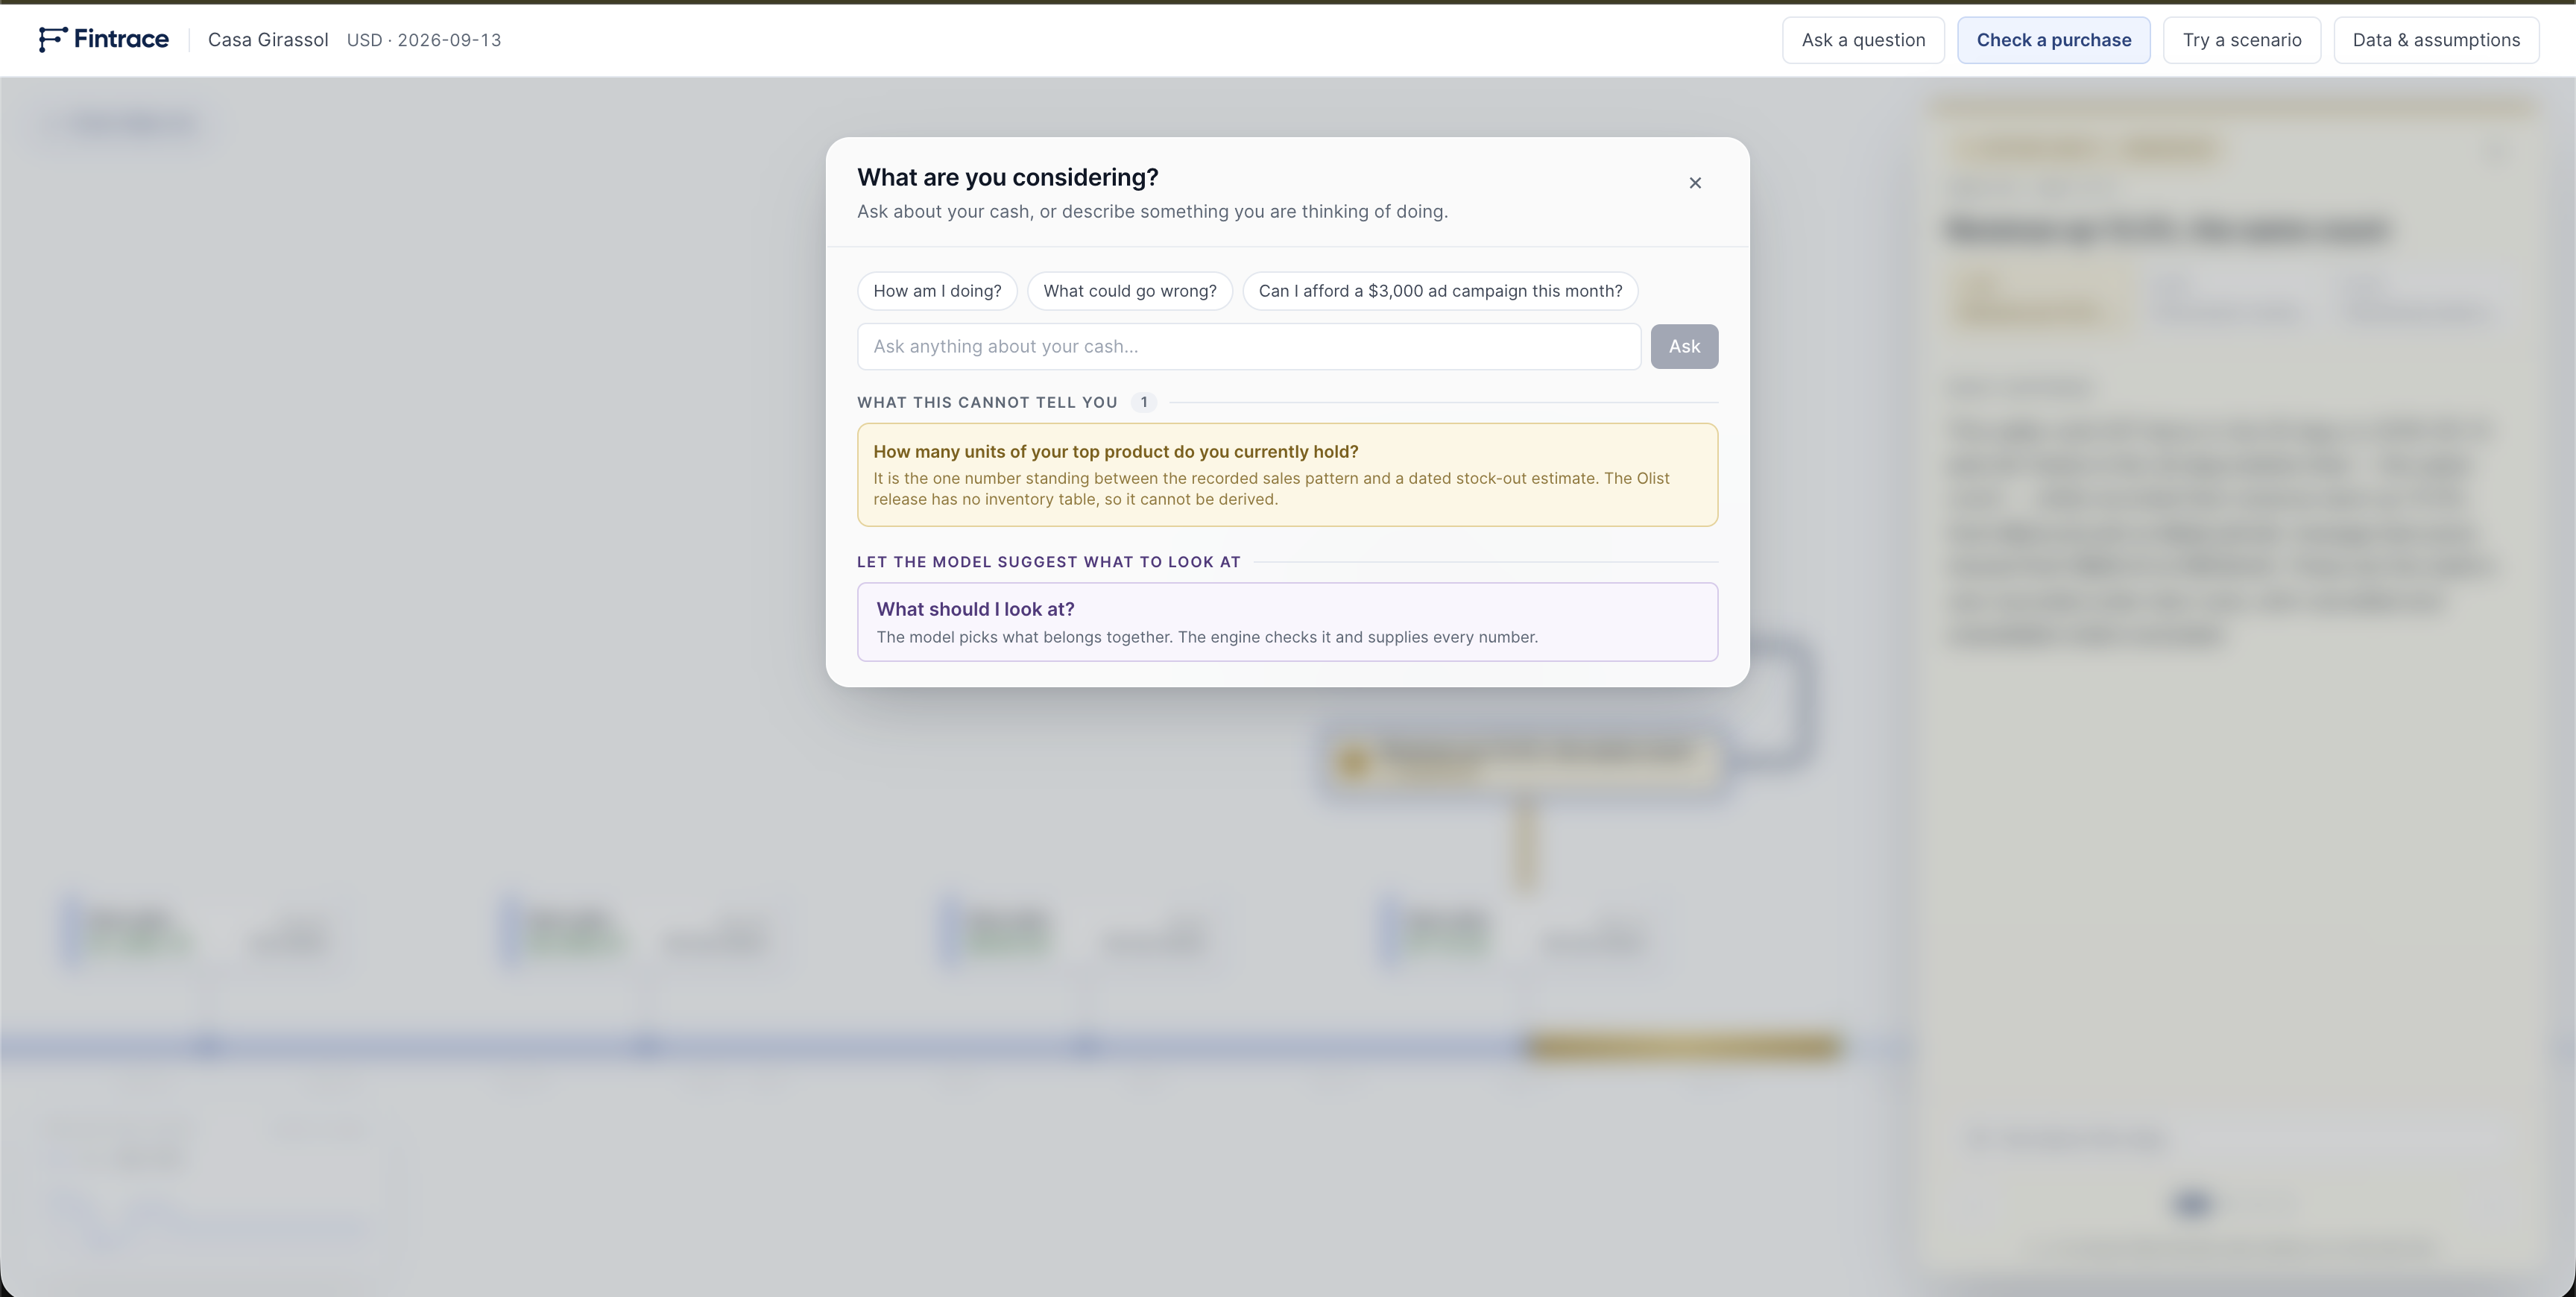
"What are you considering" menu, for discussing ideas with the AI chatbot.
-
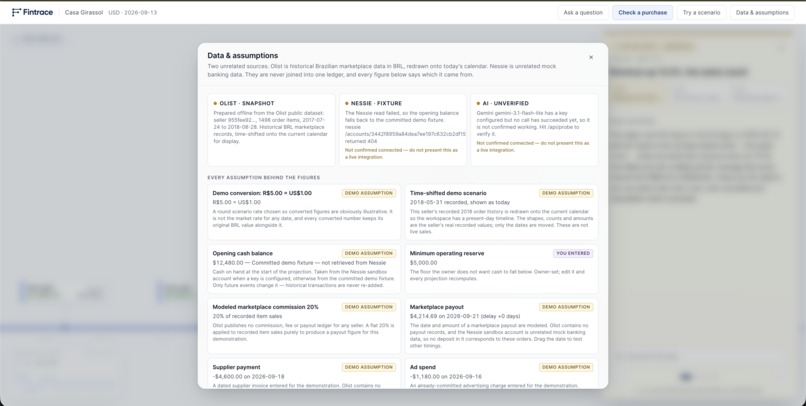
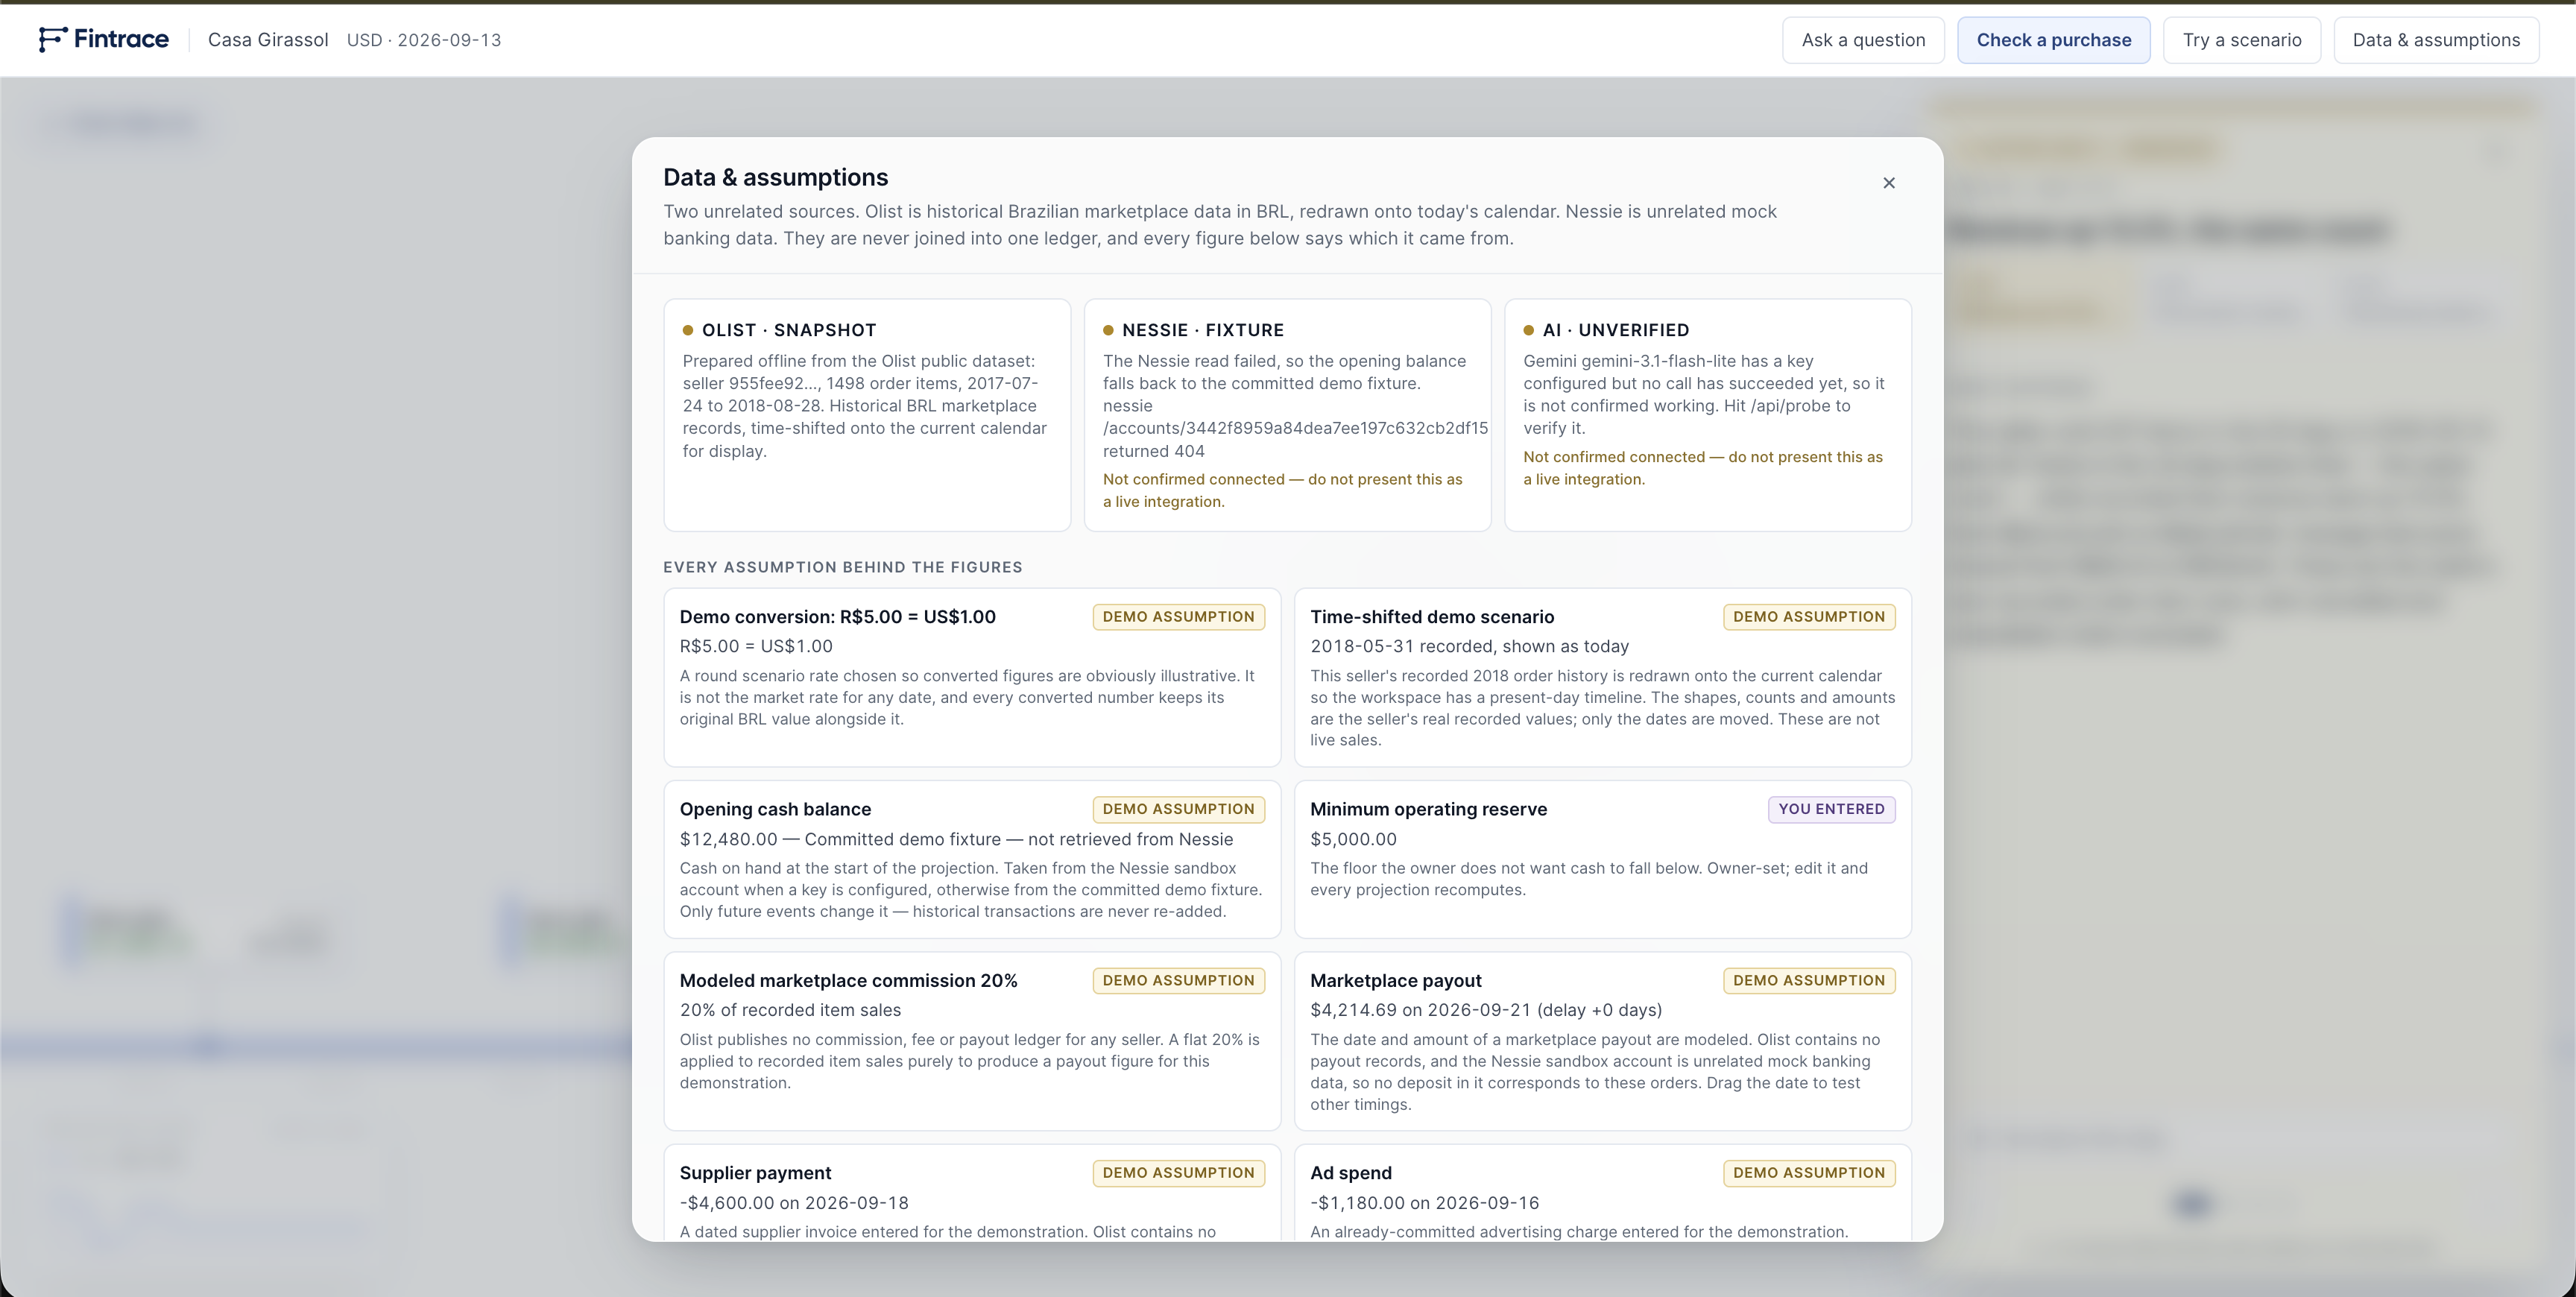
All of the data, sources and different things considered for the specific company.
-
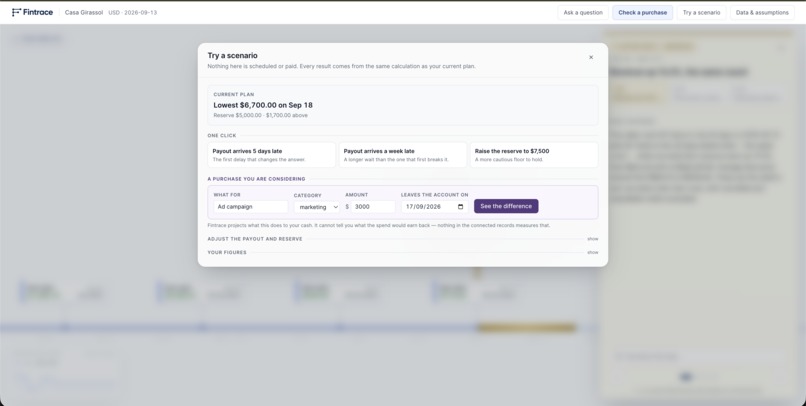
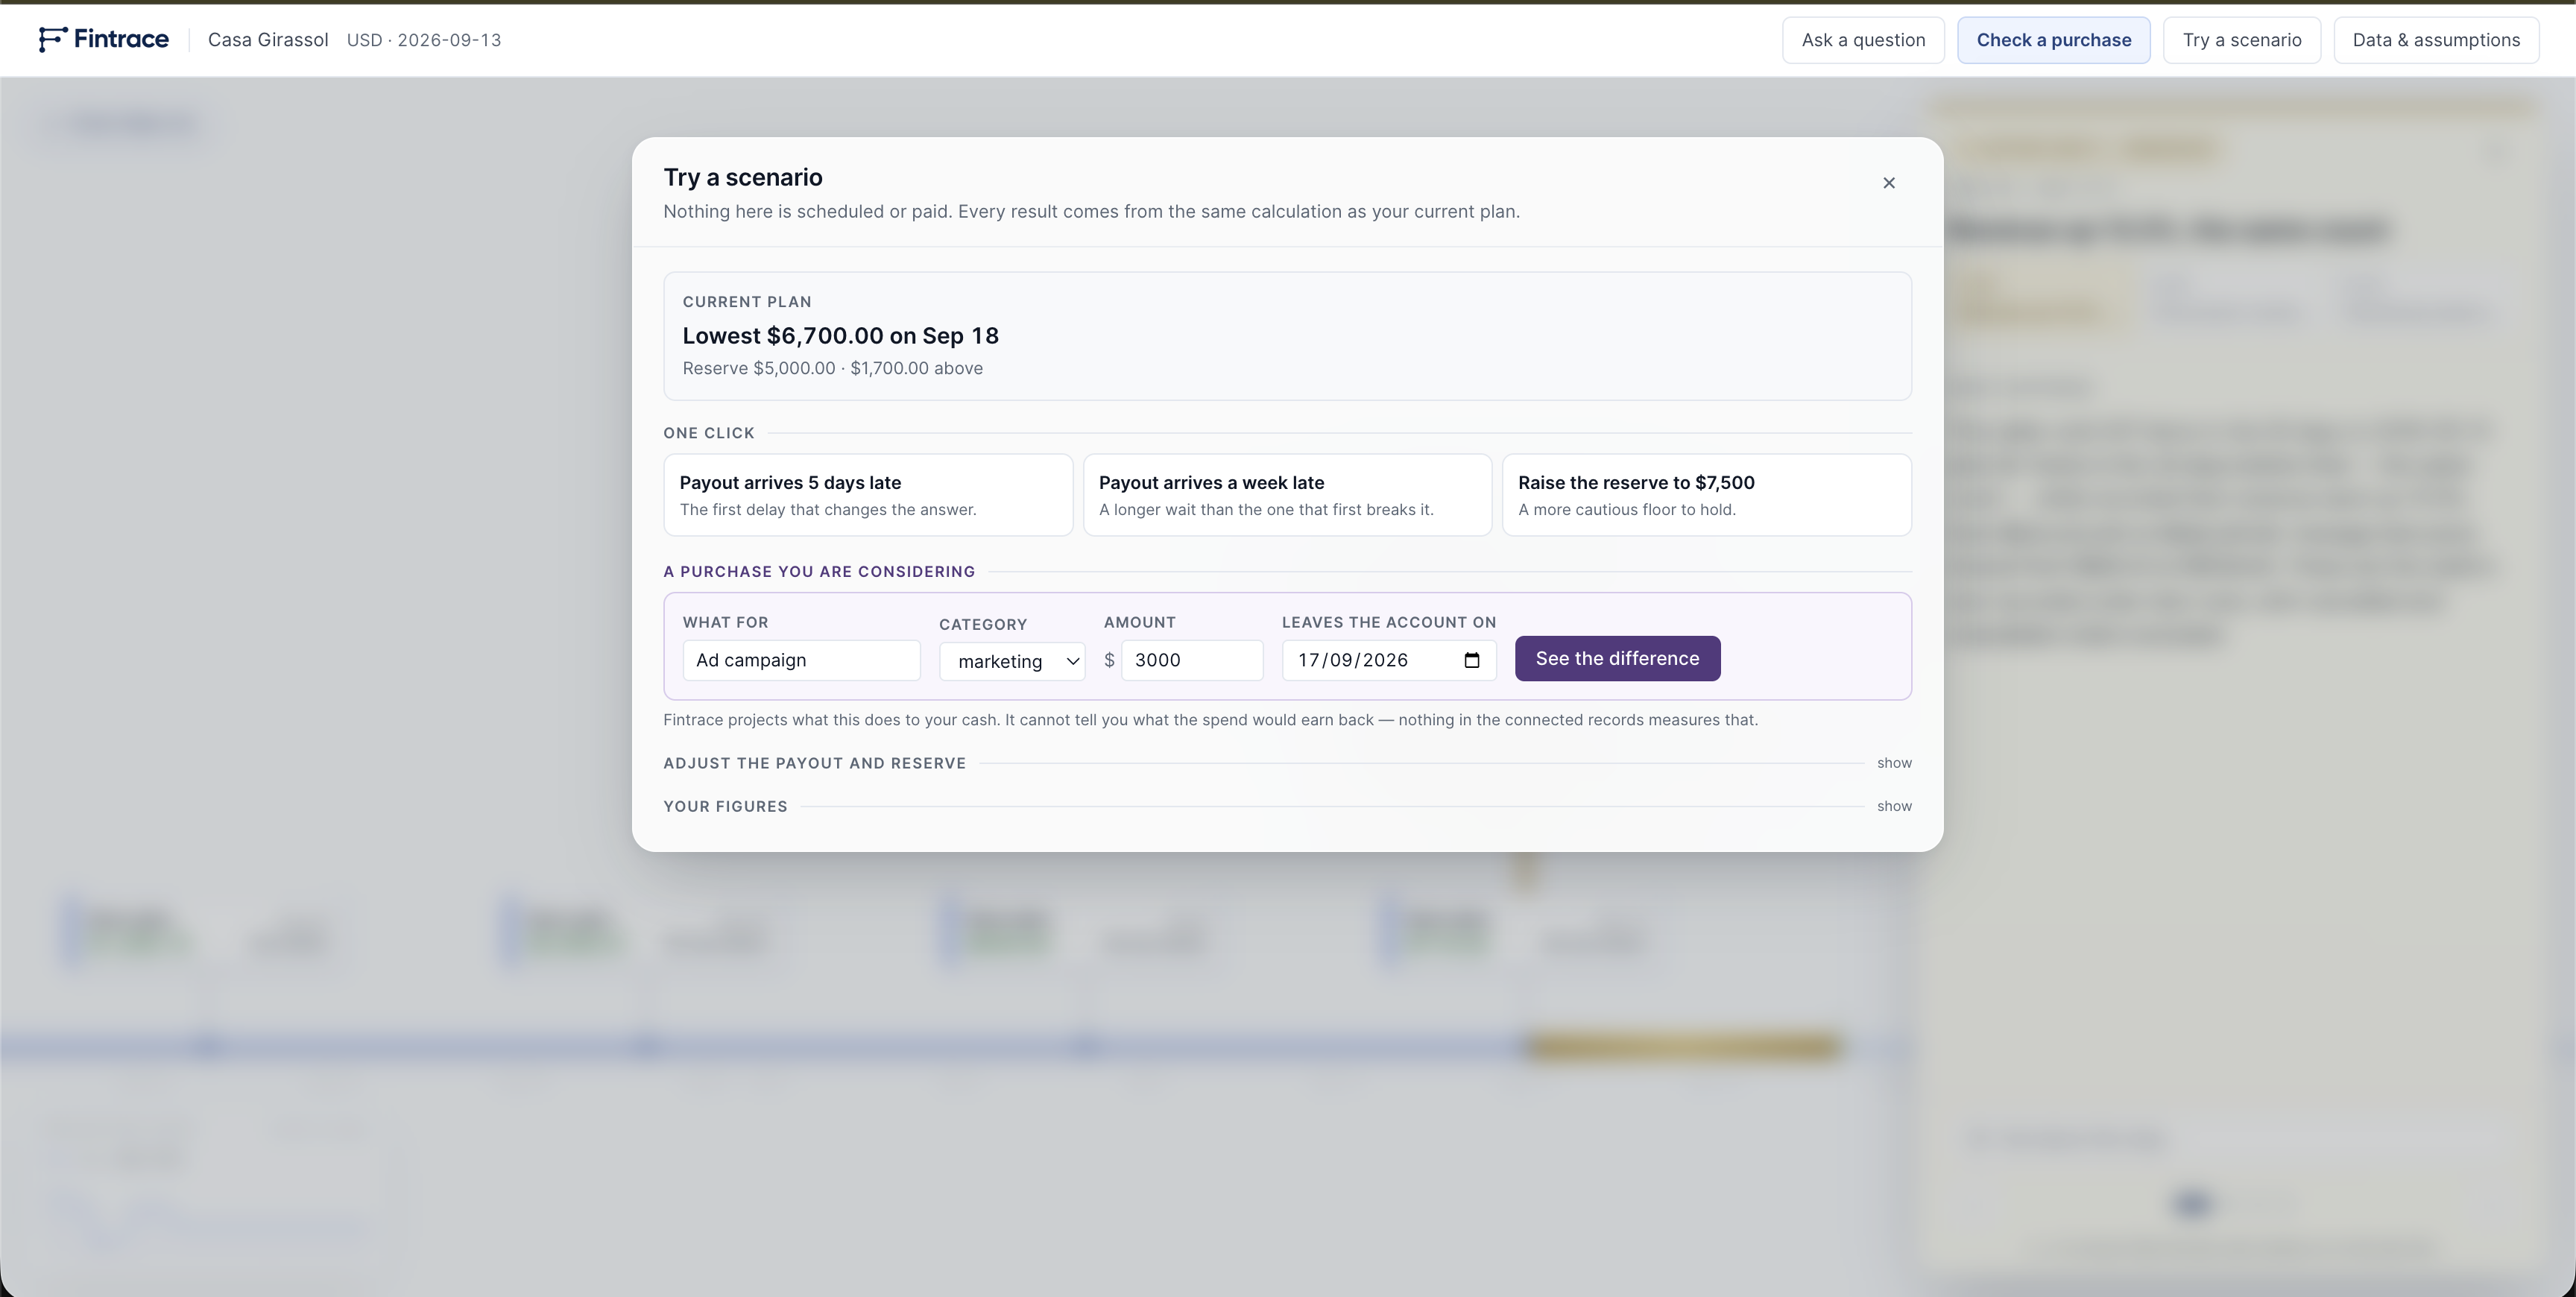
"Try a scenerio" menu, to type in and describe your specific financial plans and movements to simulate with Fintrace.
-
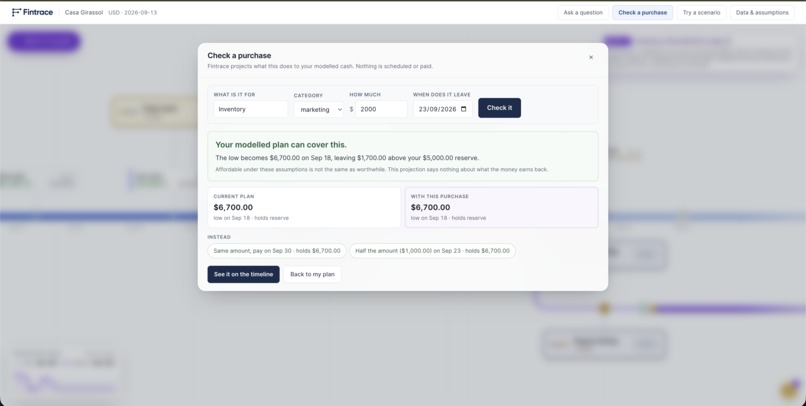
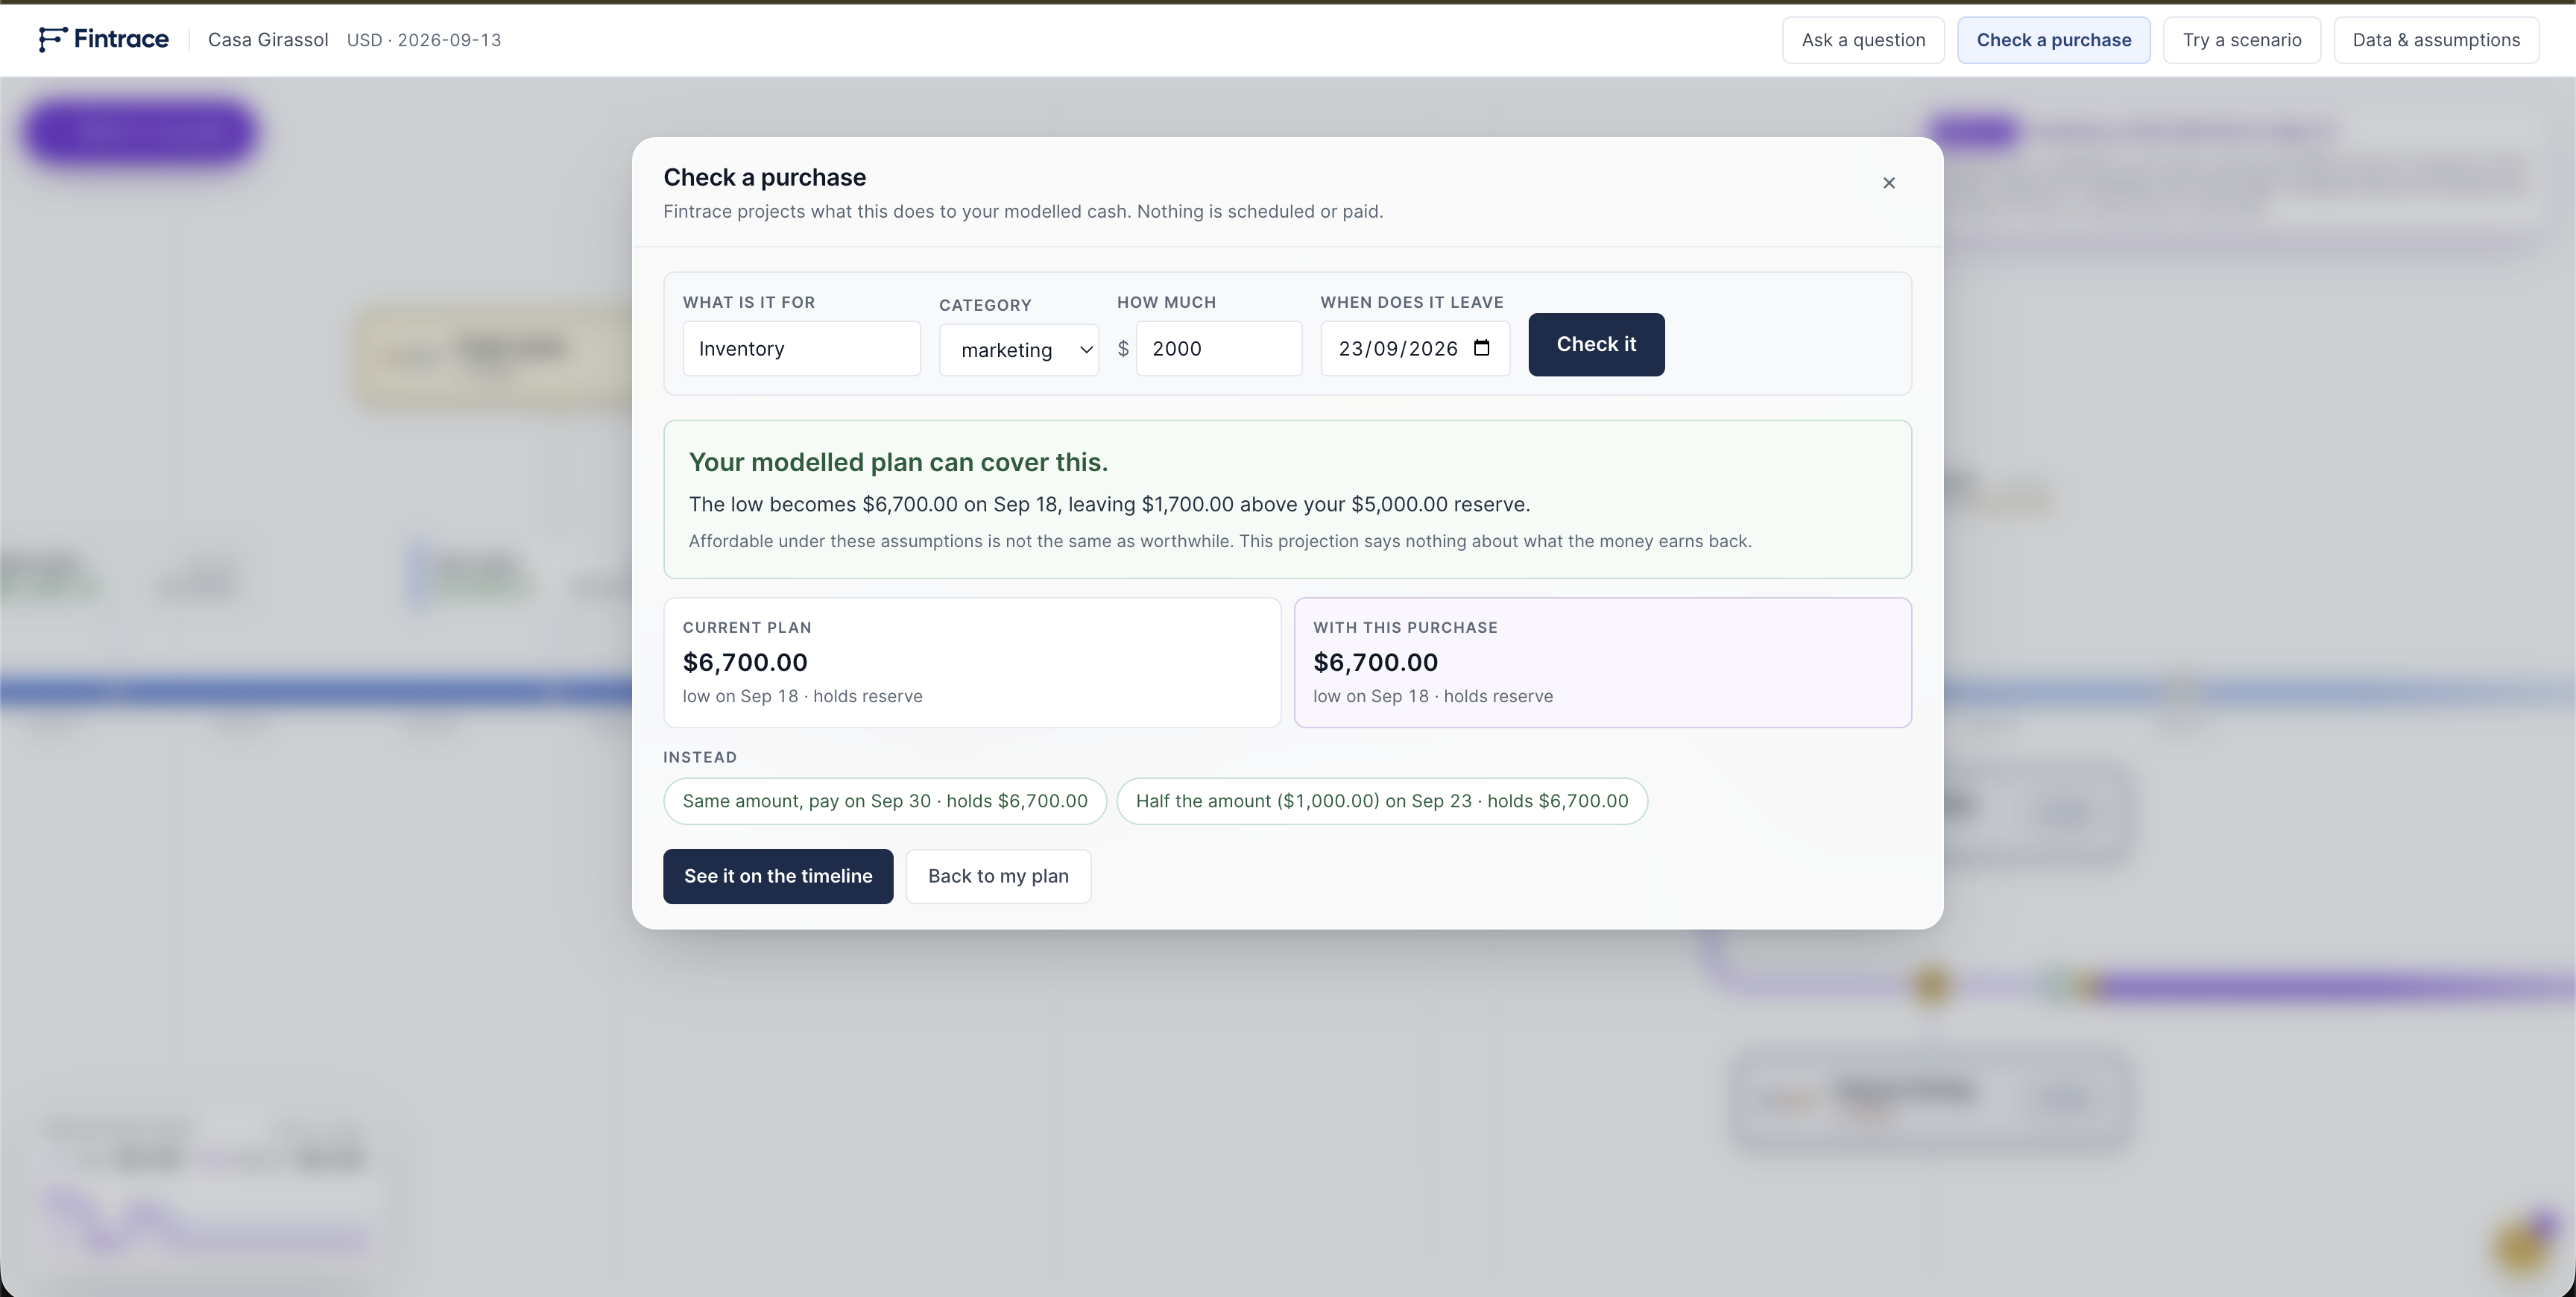
"Check a purchase" Menu, for an AI descriptive insight on your financial investents on different areas.
-
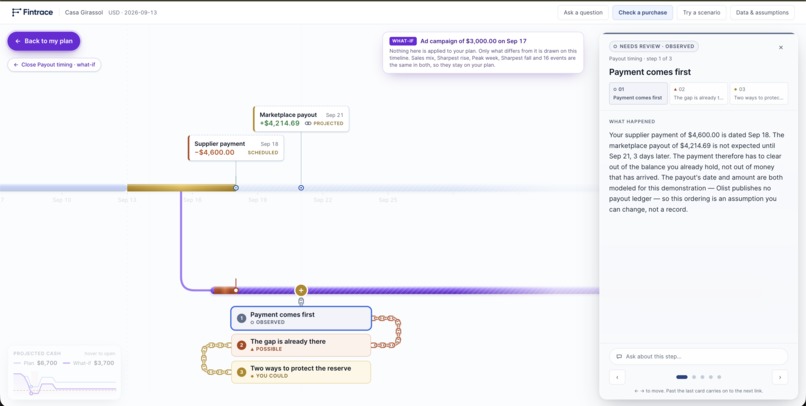
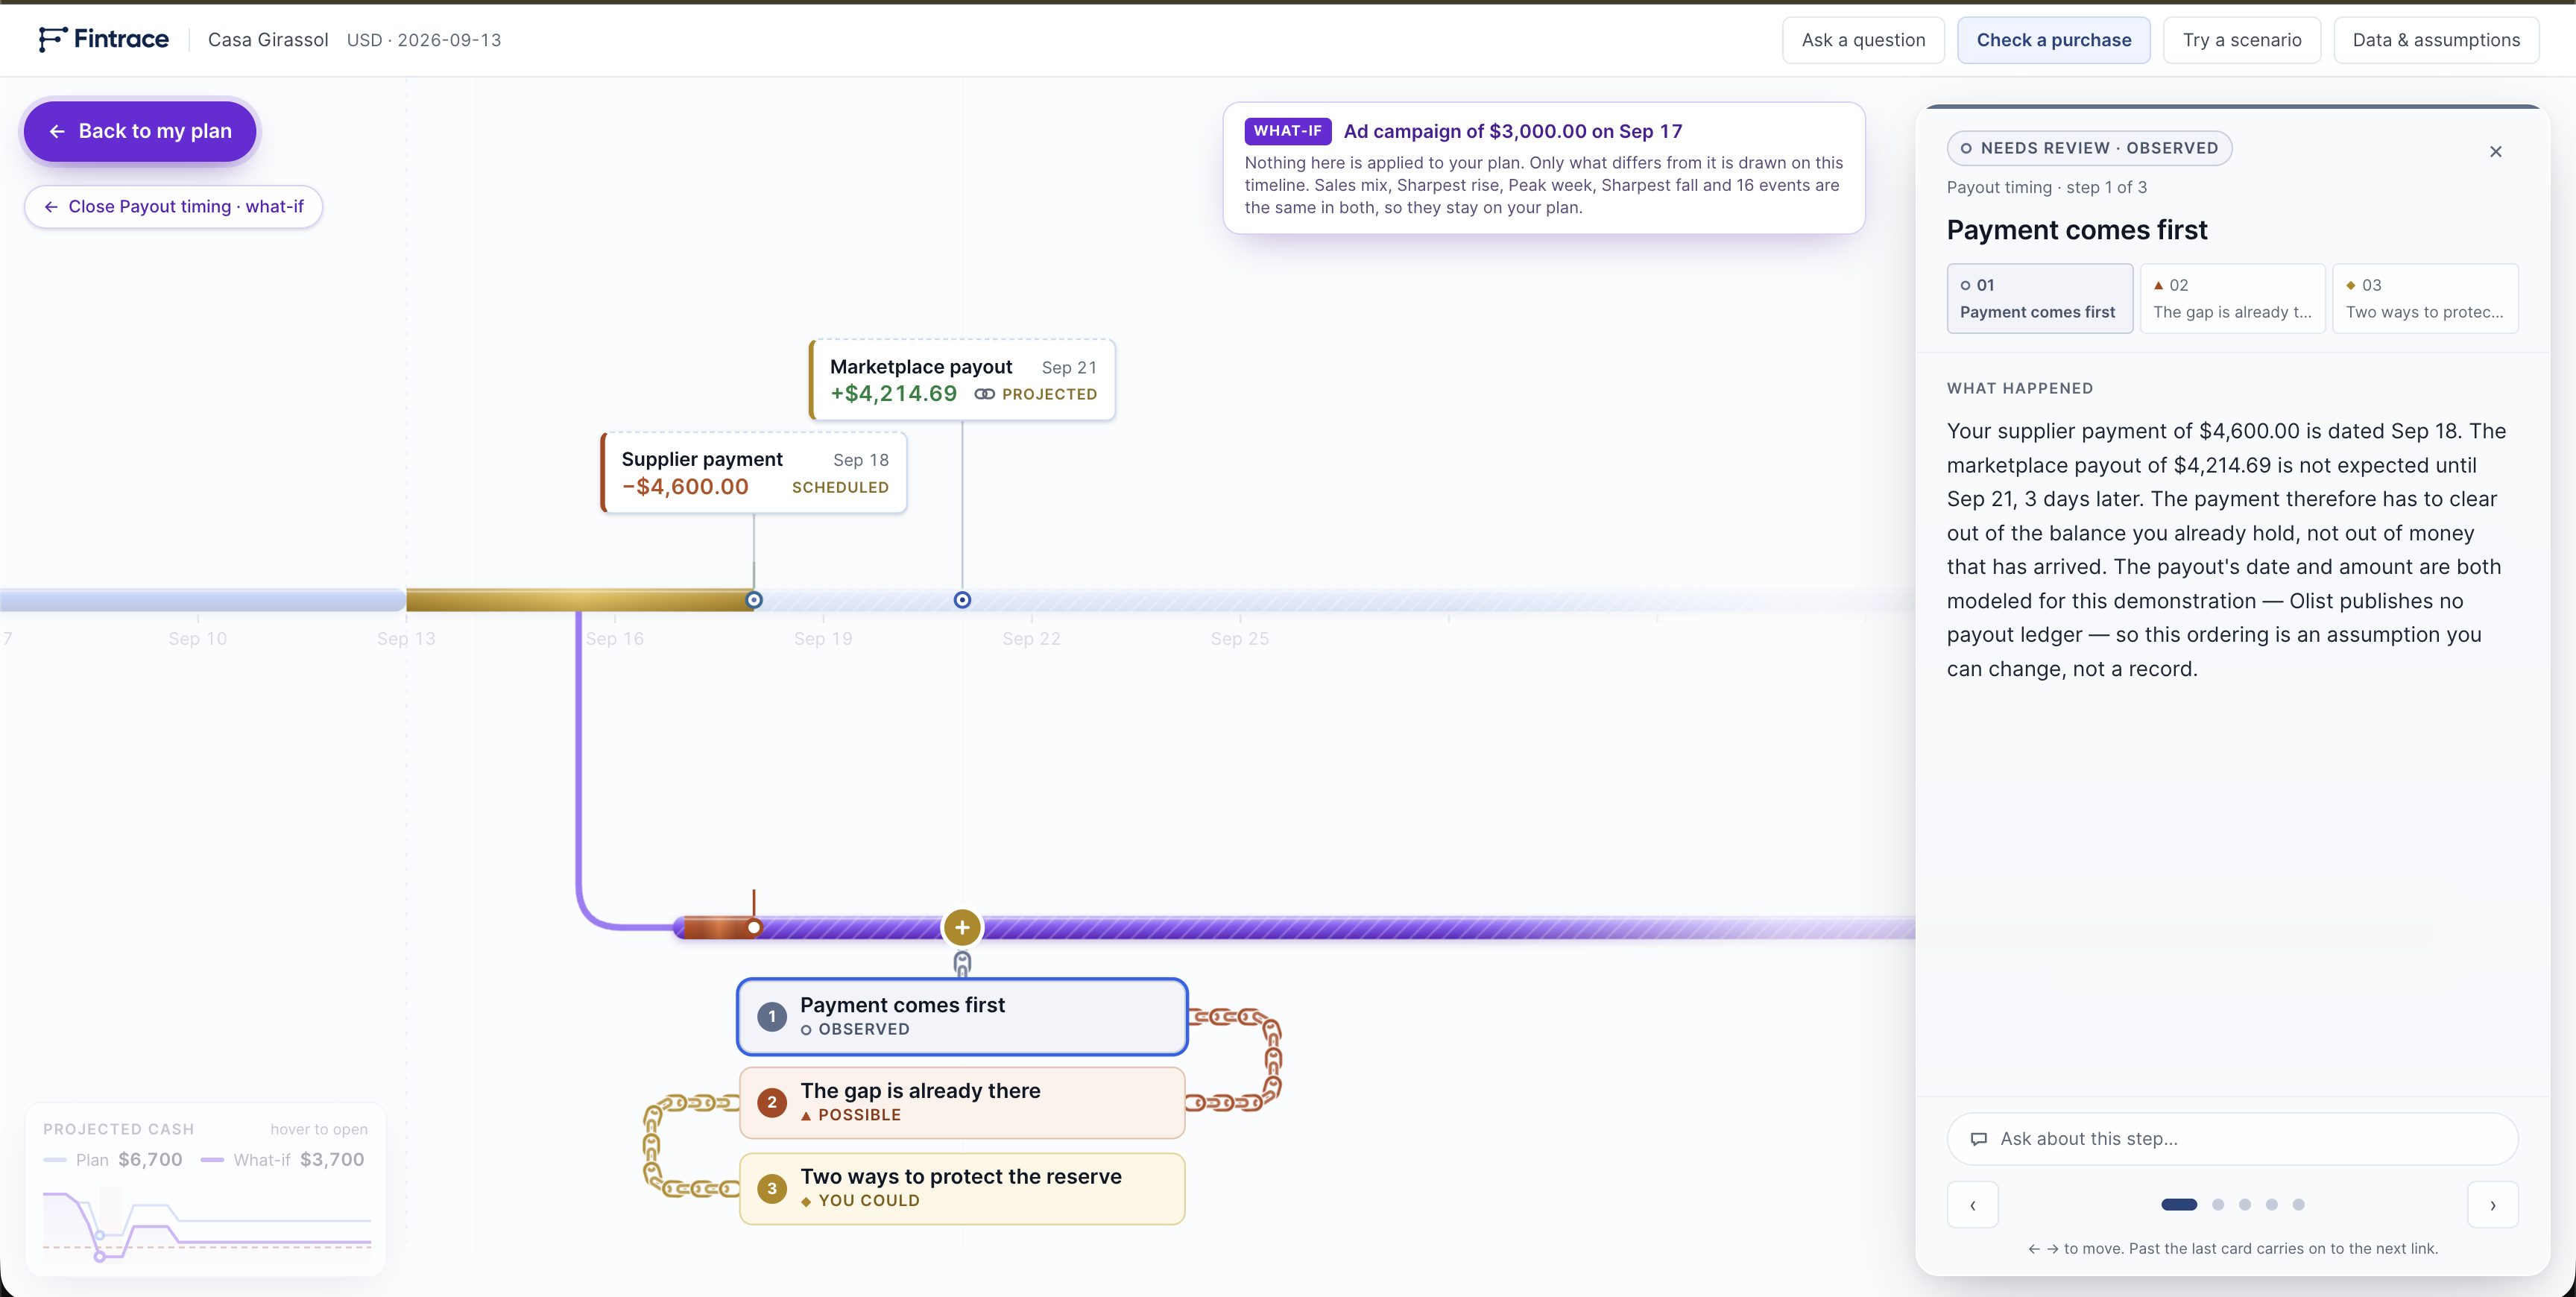
Showcase of the simulated scenario timeline for predicting the financial behaviour of the different routes/decissions a company could take.
-
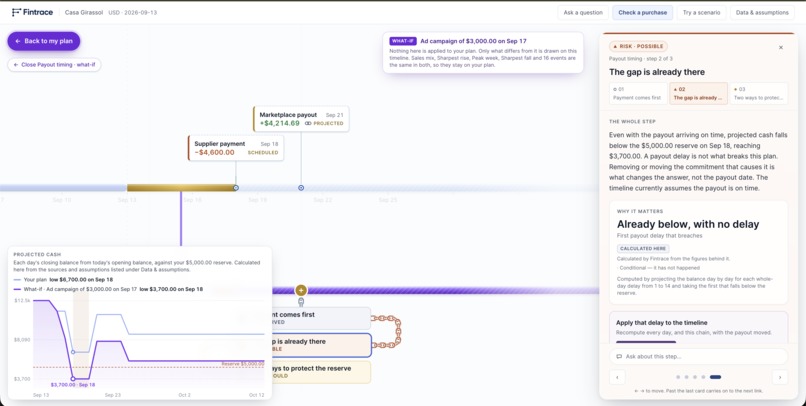
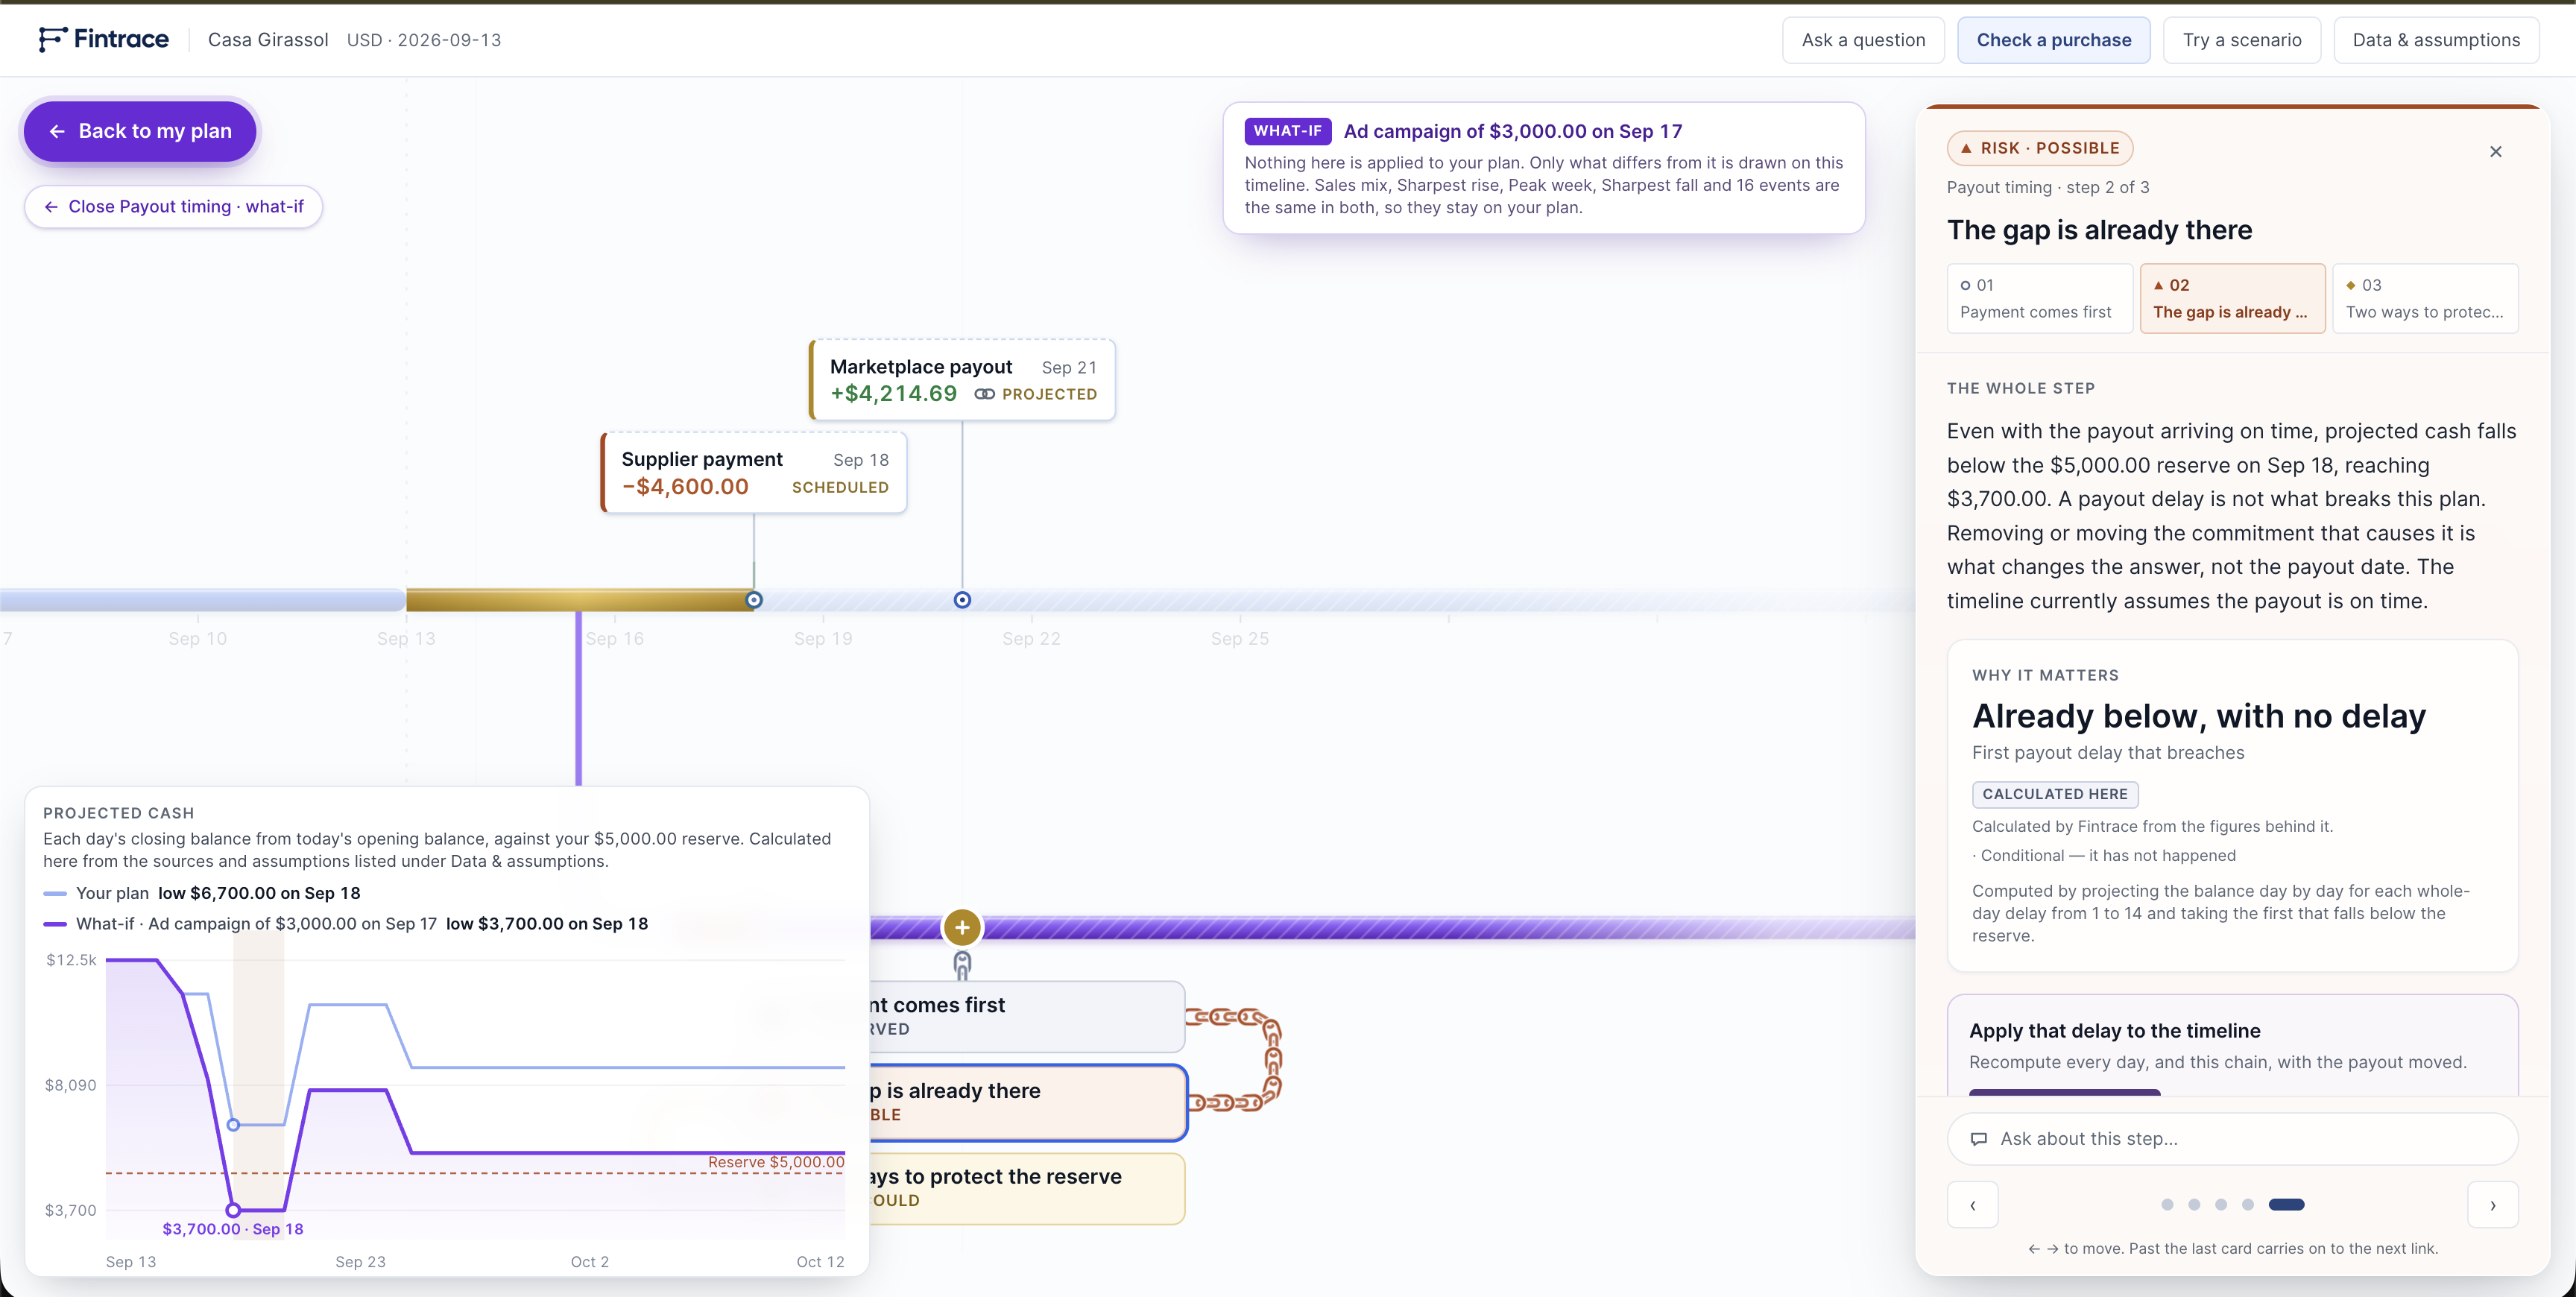
Showcase of the simulated timeline with the graph expanded.
Inspiration
For a small online seller, the dashboard usually says things are going well: orders are up, revenue is up. But sales are not cash. The marketplace pays out days later, while the supplier, the rent and the ads want paying on fixed dates. A good month can still leave the account short for a week.
The Capital One challenge pointed us at a real e-commerce seller's history and Capital One's Nessie banking API. We wanted to build the tool that seller is missing: one that answers the question an owner actually has before spending money — can I spend this, on this date, without breaking my reserve?, and that never makes up a number to sound helpful.
What it does
Fintrace is a cash decision workspace built around a single timeline.
- One line, past and future. Left of today is what is recorded; right of today is what is projected, scheduled bills, a modelled marketplace payout, and the owner's minimum reserve. Nothing before today is ever shown as a prediction.
- The answer is painted on the timeline. The stretch of days that matters turns green (clear of the reserve), amber (holds, but only just) or red (breaks the reserve). Hover for the one-line reading, click for the full reasoning. The colour comes from the engine, not from someone's opinion.
- Chains of evidence. Important events carry a chain, for example Payout timing: what is scheduled → what could break → what you could do. Opening one zooms the timeline onto it, and you walk it card by card with the arrow keys while each step lights up exactly the days it talks about. Past weeks get chains too: the peak week, the sharpest rise and the sharpest fall.
- What-ifs you can see. Try "the payout arrives 5 days late" or "$3,000 on ads next week" and a purple branch splits off the plan, drawing only what changes, with a clear way back. Nothing is ever scheduled or paid.
- Every number has a source. Each figure is badged Olist record, Sandbox bank, Demo assumption, You entered or Calculated here, and the underlying record or assumption opens inline.
- Ask in plain language. A chat box answers questions about what you are looking at. If a language model is connected, it only rephrases facts the engine already computed.
- It says what it cannot know. The data has no unit costs and no stock on hand, so Fintrace shows no margin and no days-of-stock figure. It names the missing number instead of guessing.
How we built it
- Engine and API; Go. A standard-library
net/httpserver that serves both the API and the built UI from one process. All money is integer cents and all dates are date-only, so there is no floating-point or timezone drift. The engine projects the daily balance, the lowest point, reserve breaches, the first payout delay that would break the plan, and alternatives for a proposed spend. The chains are generated by Go rules, including a general rule that finds a seller's notable weeks from the daily records. - Frontend; React 19, TypeScript, Vite and Tailwind v4. The timeline, chains and what-if branch are custom SVG, moved by a CSS-transform "camera" that zooms into whatever you open. Recharts draws the evidence charts.
- Data; Python and DuckDB, offline. We used the real Brazilian E-Commerce Public Dataset by Olist (Kaggle, CC BY-NC-SA 4.0), reduced to one seller's own order items, time-shifted onto today's calendar and labelled as such. The opening balance comes from Capital One's Nessie sandbox API, with a clearly labelled fixture when it isn't reachable.
- AI; optional, and fenced in. Gemini (or a local Ollama model) may rephrase the engine's sentences. A validator checks every number in the answer against the engine's facts and discards anything that doesn't match, and falls back to the engine's own wording, labelled.
- Deployment. One Docker image, the web build and the Go binary, on Render.
- Tests. 89 Go tests, covering the reserve boundary at exactly equal and one cent under, payout delays crossing a bill date, sales never moving the bank balance, nothing predicted in the past, what-ifs never altering the past, and the language model never emitting a number the engine did not compute. A Python script checks the seller attribution against the raw CSVs.
Challenges we ran into
- Two real data sources that are not the same business. Olist is a real seller's 2017–2018 sales in Brazilian reais; Nessie is a fictional sandbox bank customer in dollars. Joining them would produce numbers that look precise and mean nothing. We kept them separate, used Nessie only for the starting balance, badged every figure, and documented exactly where each number comes from.
- The seller in the brief had only 3 order items. That cannot support a month of cash projection, so we substituted a São Paulo seller with 1,498 order items across 23 product categories, and recorded the substitution in the app itself.
- Keeping the AI honest. We built a validator that treats
$6,700.00,6700and6,700.0as the same value and rejects any number the engine didn't produce, plus a list of claims the model may never make, like margins or "I have scheduled this". - Subtle engine bugs. Measuring the payout-delay breakpoint from already-shifted events once produced "a 1-day delay breaks the reserve", and empty Go slices serialised as
nullonce blanked the whole React page. Both are now fixed and guarded. - Showing a lot without overwhelming anyone. Early versions put everything on screen at once. We rebuilt around progressive disclosure: quiet markers for upcoming events, cards only where a chain hangs, a camera that zooms into one chain at a time, and readings that open on hover.
- What-ifs without confusion. A hypothetical must never be mistaken for the plan, so it lives on its own purple branch with a pinned label and an always-visible "Back to my plan".
Accomplishments that we're proud of
- Every number on screen traces back to a dataset row, an API call, a written-down assumption or an engine calculation, and the app shows you which.
- It works with no credentials at all. If the bank API or the language model is down, everything still runs and the app says so plainly.
- A what-if you can actually see, as a second timeline that shows exactly what moves.
- It refuses to answer what it cannot know, instead of guessing.
- 89 passing tests that enforce the honesty rules, not just the arithmetic.
What we learned
- For a small online business, when money moves matters as much as how much comes in.
- Being honest about data is a design problem as much as an engineering one: badges, labels, and deciding what not to show.
- Language models are useful for wording and dangerous for numbers. A deterministic engine plus a strict validator gets the best of both.
- Less on screen made the product clearer. Waiting to be asked beat a dashboard full of charts.
What's next for Fintrace
- One real business, end to end. Replace the two demo sources with a single business's own bank connection and its own sales channel (Shopify, Mercado Libre or wherever it sells), so the data can finally be joined honestly.
- Accounts and saved plans, so an owner's reserve and what-ifs persist between visits.
- General chain rules. The payout and sales-mix chains are written for this demo's events today; the notable-weeks rule already works for any seller, and the rest should too.
- Costs and stock, when a business provides them, unlocking the margin and reorder decisions we deliberately refuse to guess today.

Log in or sign up for Devpost to join the conversation.