-
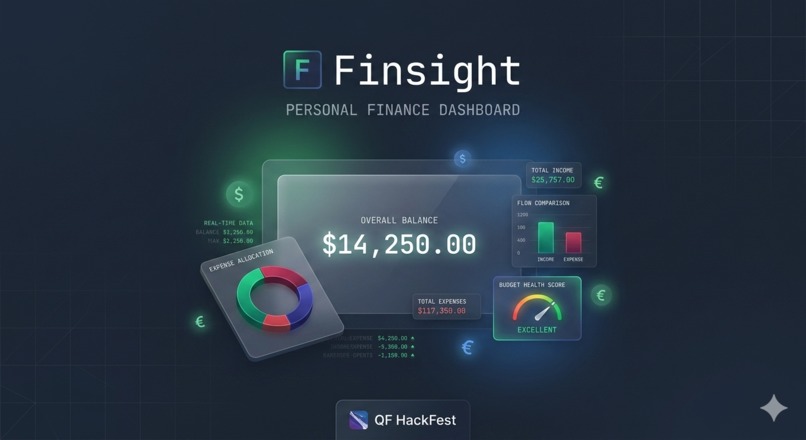
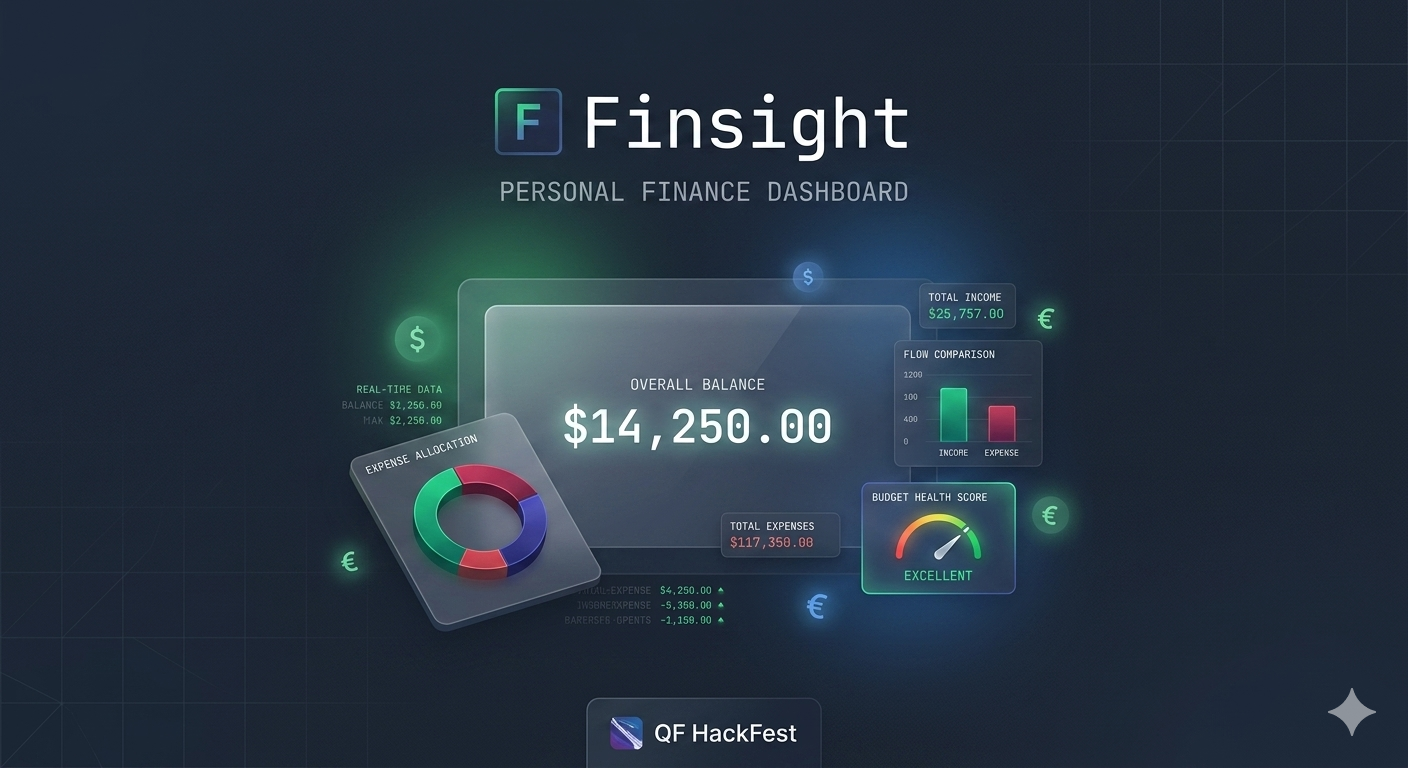
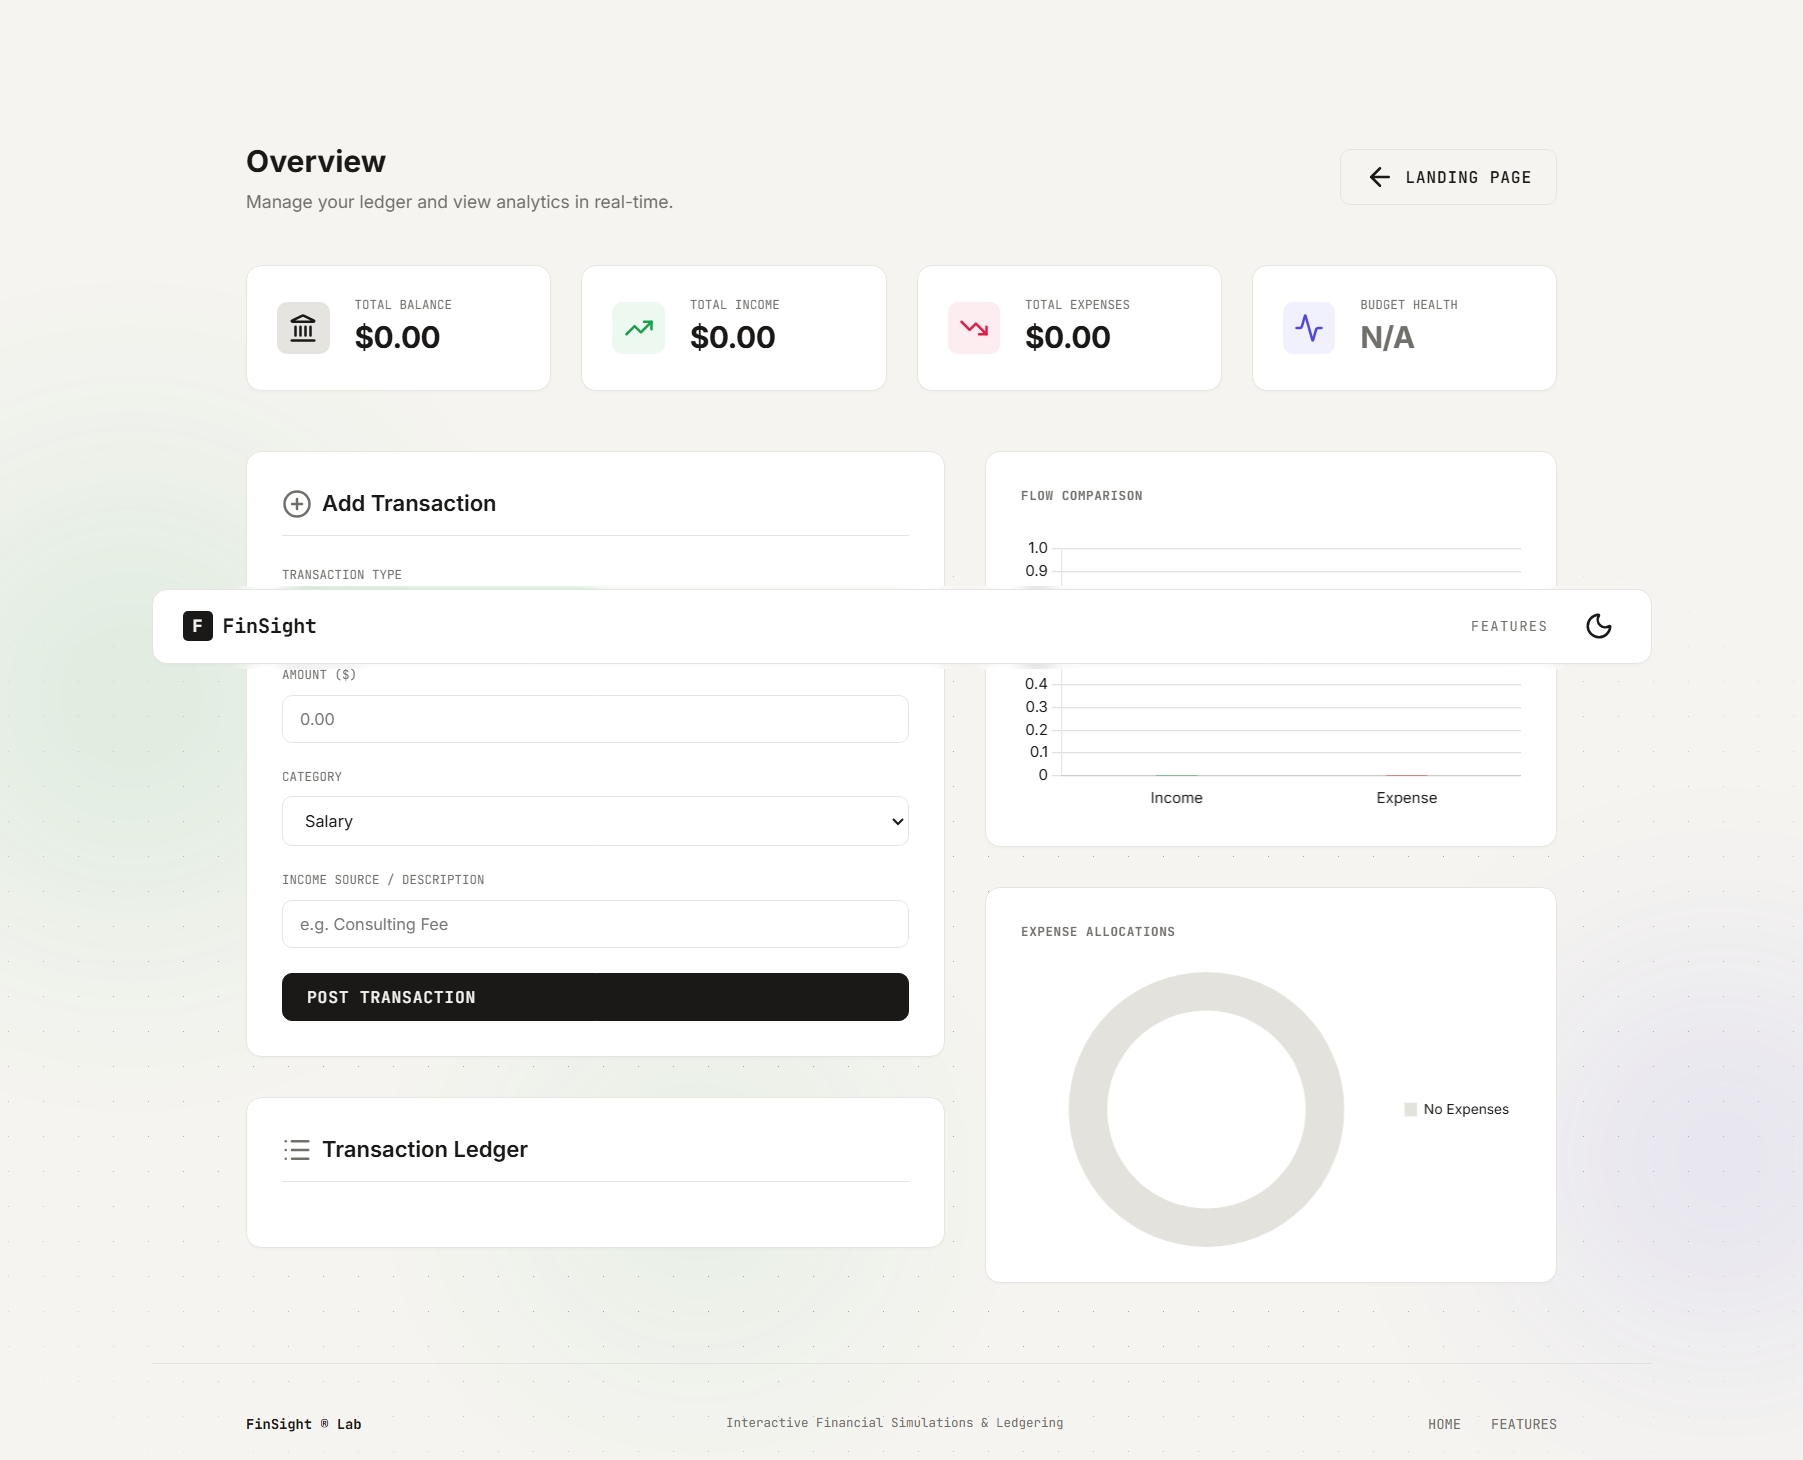
FinSight primary dashboard interface featuring real-time analytics and dynamic charts.
-
-
-
Inspiration
Most personal finance tools require users to link sensitive bank accounts or trust third-party servers with their data. I wanted to build a clean, secure, and completely private dashboard where users could track their financial flows instantly without handing over a single byte of personal information to an external cloud database[cite: 1].
What it does
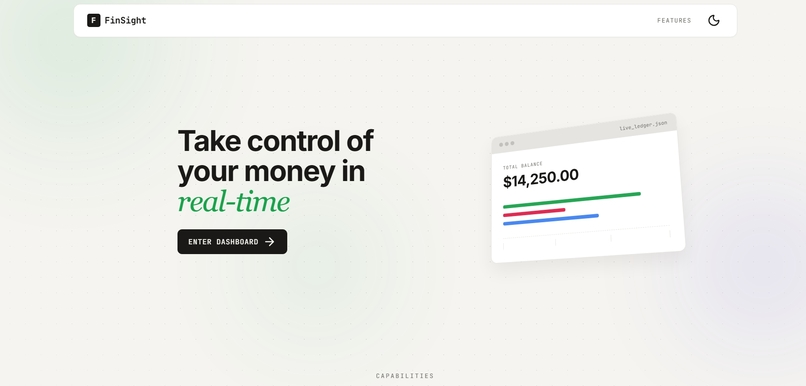
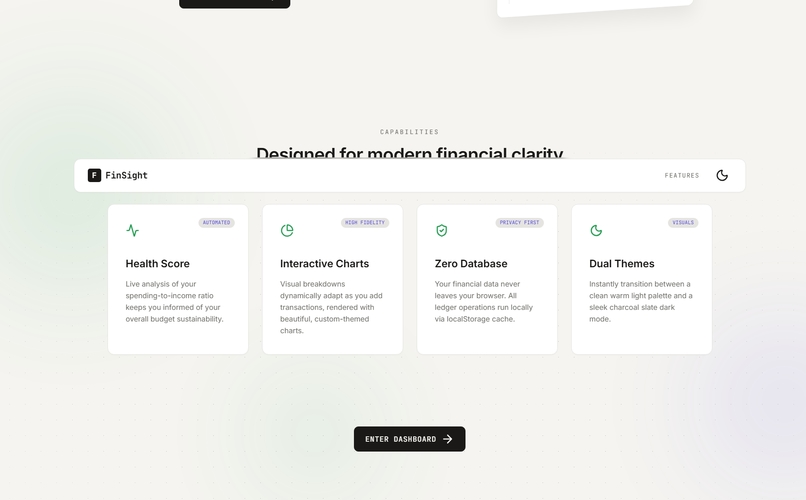
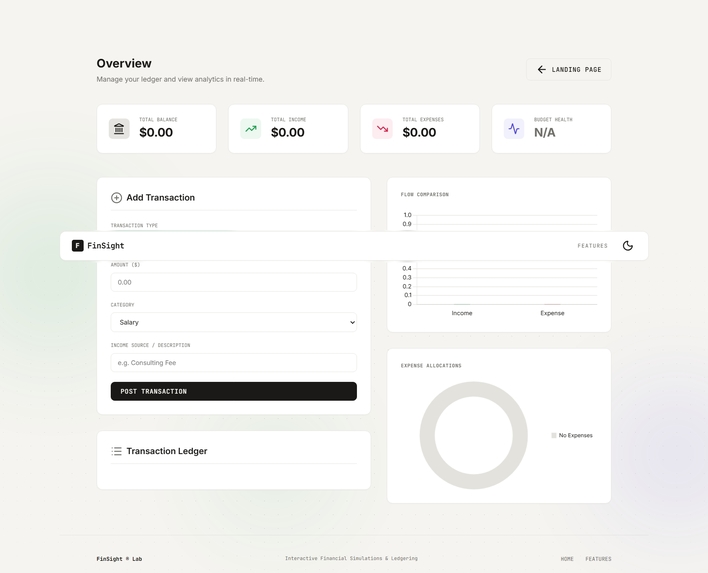
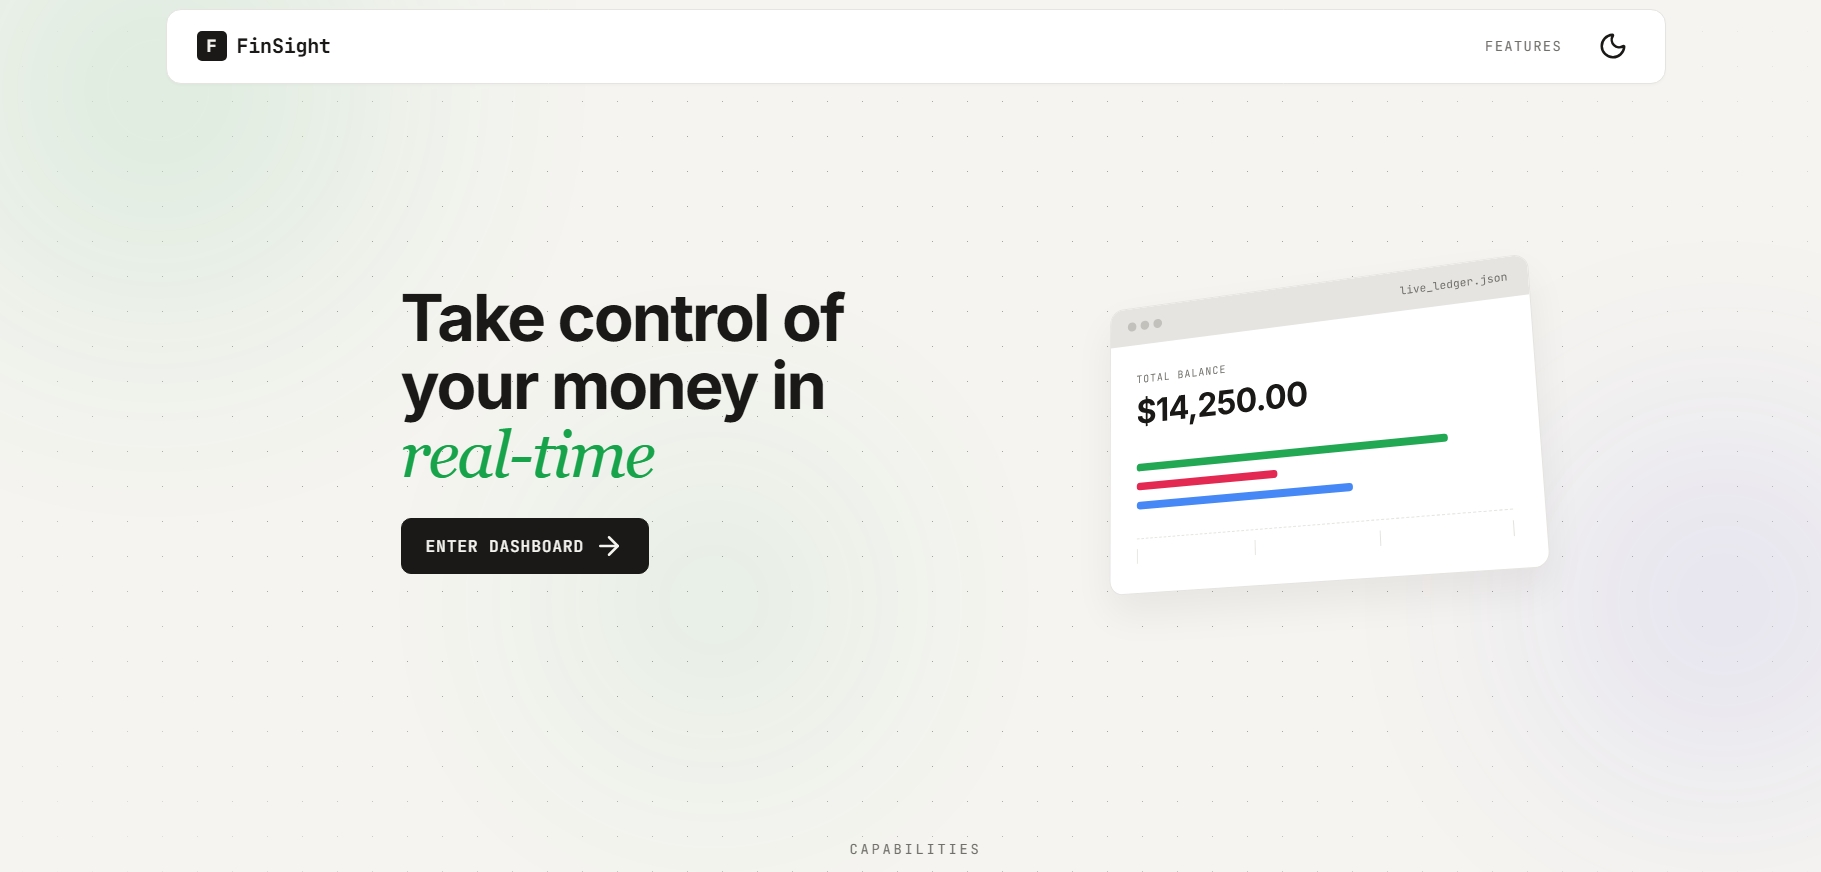
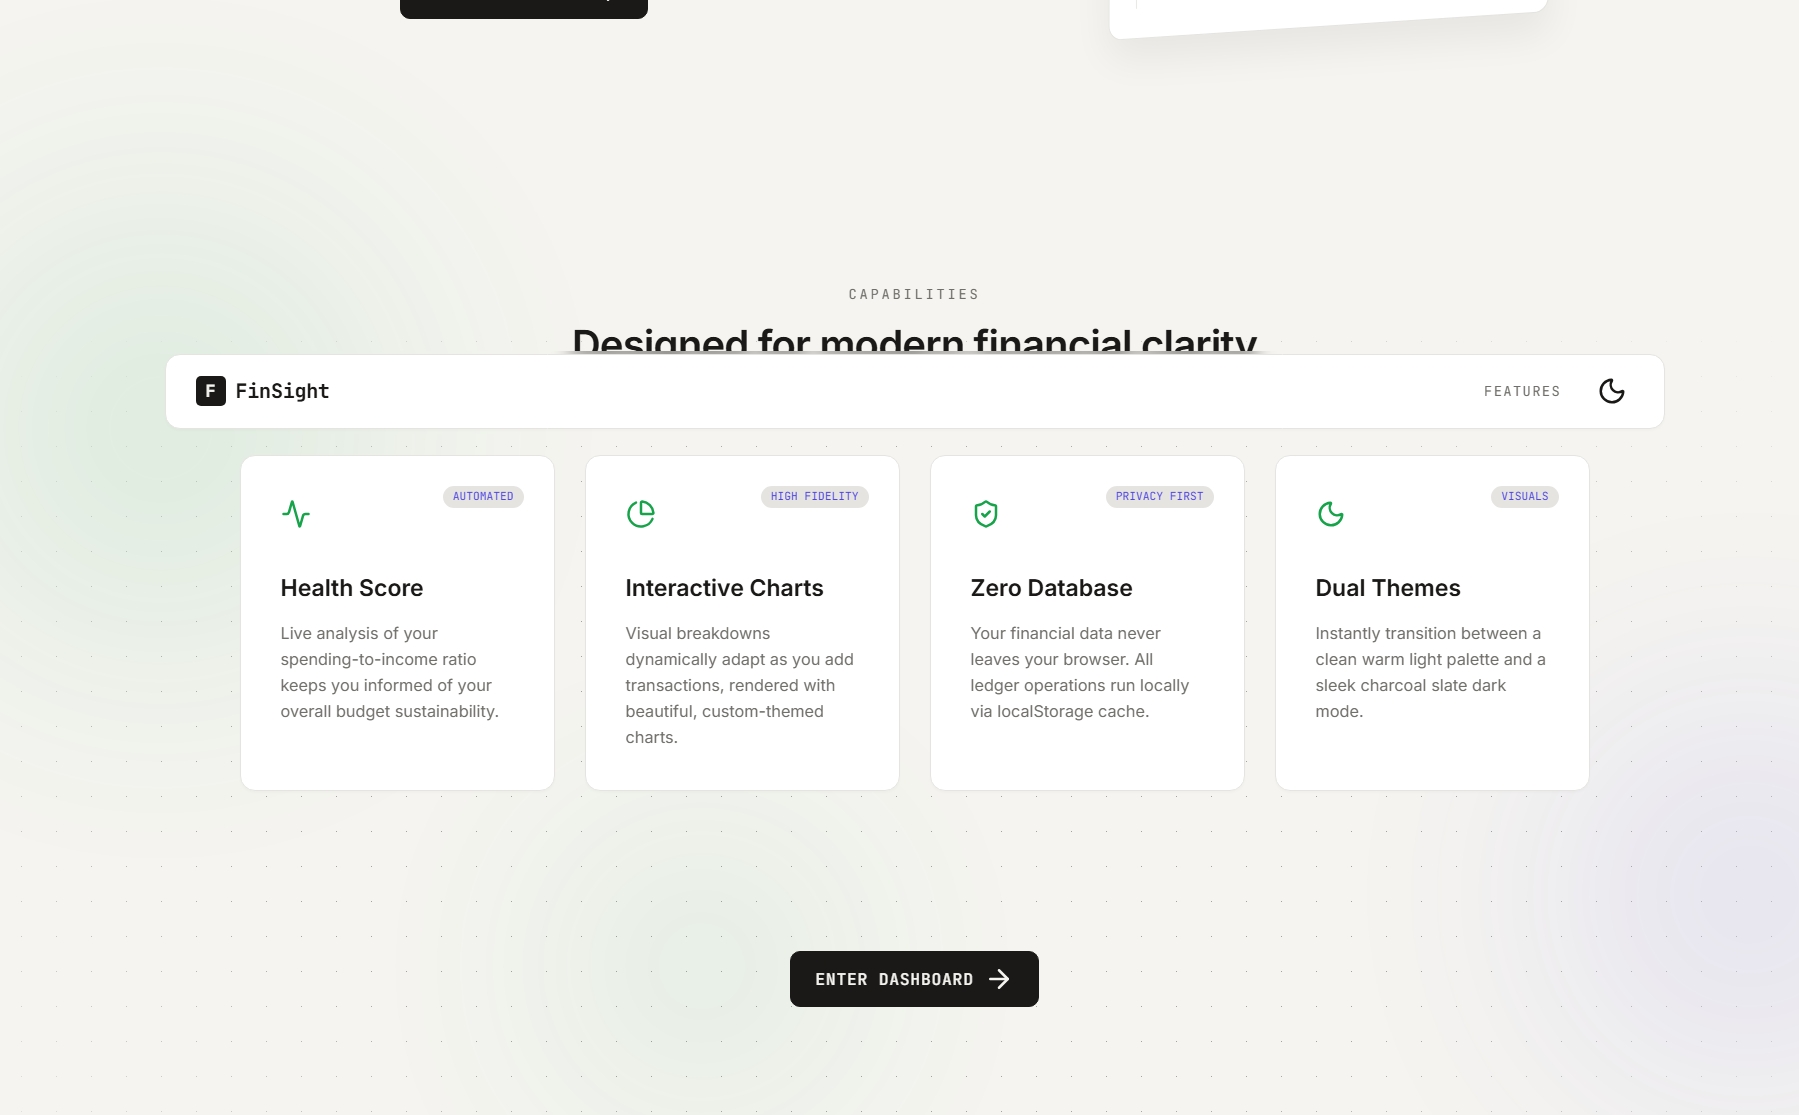
FinSight is a personal finance simulation and real-time ledgering platform[cite: 1]. From the elegant landing page featuring an interactive 3D perspective mockup, users enter a fully client-side dashboard[cite: 1, 2]. They can log income or expenses across distinct categories, see their absolute balances update on the fly, monitor an automated "Budget Health Score" (ranging from Excellent to Critical), switch between smooth Light and Dark mode UI templates, and analyze their spending allocations instantly via dynamic Chart.js visualizations[cite: 1, 2, 3].
How I built it
The application is crafted using standard frontend primitives:
- HTML5: Semantic architecture ensuring seamless layout shifts between the landing showcase and the primary workspace[cite: 1].
- CSS3: Built using fluid CSS Grid configurations, smooth custom transitions, and interactive 3D perspective transforms (
rotateXandrotateY) for an optimized desktop experience[cite: 3]. It utilizes CSS custom properties (variables) to execute dynamic, instant theme swaps[cite: 3]. - JavaScript (ES6+): Pure vanilla scripting manages the foundational transactional state loop, updates data objects dynamically, updates DOM references, and coordinates client-side data persistence[cite: 2].
- Libraries: Chart.js for canvas rendering of real-time flow distributions and Lucide Icons for clean vector imagery[cite: 1, 2].
Challenges I ran into
A major engineering roadblock was syncing data metrics fluidly. When a transaction is posted or destroyed, the change must immediately propagate across the total balances, recalculate the percentage limits for the health gauge text color thresholds, and fully tear down and reconstruct active Chart.js canvas contexts simultaneously without crashing the client window or triggering laggy UI flashes[cite: 2]. Resolving this meant abstracting the dashboard's rendering pipeline into centralized, clean modular functions[cite: 2].
Accomplishments that I'm proud of
I successfully developed a deeply interactive, desktop-first fintech utility that runs with zero database overhead[cite: 1]. The real-time interactive tilt mechanics on the landing platform and the responsive switching logic between GitHub-style deep navy tones and clean warm slate modes look beautifully polished[cite: 2, 3].
What I learned
This project drastically sharpened my structural handling of persistent browser memory cache systems using localStorage[cite: 1, 2]. I learned how to securely bundle complex component structures, handle dynamic multi-input radio triggers smoothly[cite: 2], and maximize chart animations inside highly responsive container frameworks[cite: 2].
What's next for FinSight
- Integration of JSON/CSV localized data configuration export protocols.
- Custom user-defined monthly limit alerts per expense tier.
- Time-series line chart trends to capture month-over-month savings data.

Log in or sign up for Devpost to join the conversation.