-
-
FinSight Logged in
-
Inspiration
Honestly, it started with a frustration most of us have felt. You open your brokerage app, you see a number go red, and you have absolutely no idea why it happened or how bad it actually is. You're staring at a portfolio with no real sense of your exposure — no context, no risk framing, just a percentage loss that means nothing without understanding volatility, correlation, or drawdown.
The premise of the concept stems from the ideology where risk analysis isn't optional, it's the foundation of every decision. Quant teams at those firms have access to Bloomberg terminals, in-house risk models, and teams of analysts to make sense of the numbers. Retail investors have nothing. That gap is what FinSight AI is trying to close.
Iwanted to build something that takes the risk intelligence that exists inside professional finance and makes it legible to anyone — not just people who know what a Sharpe ratio is.
What it does
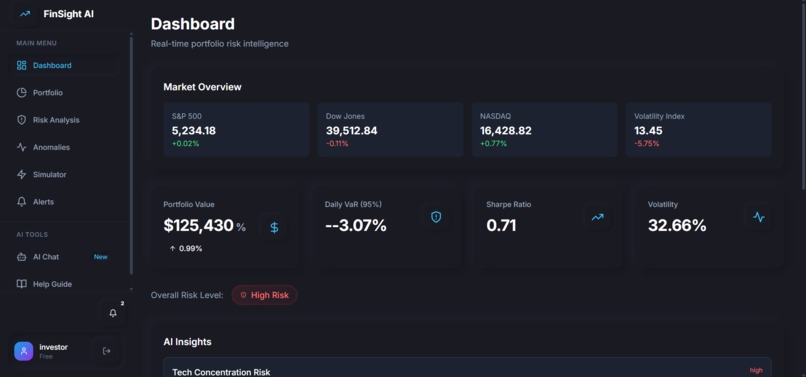
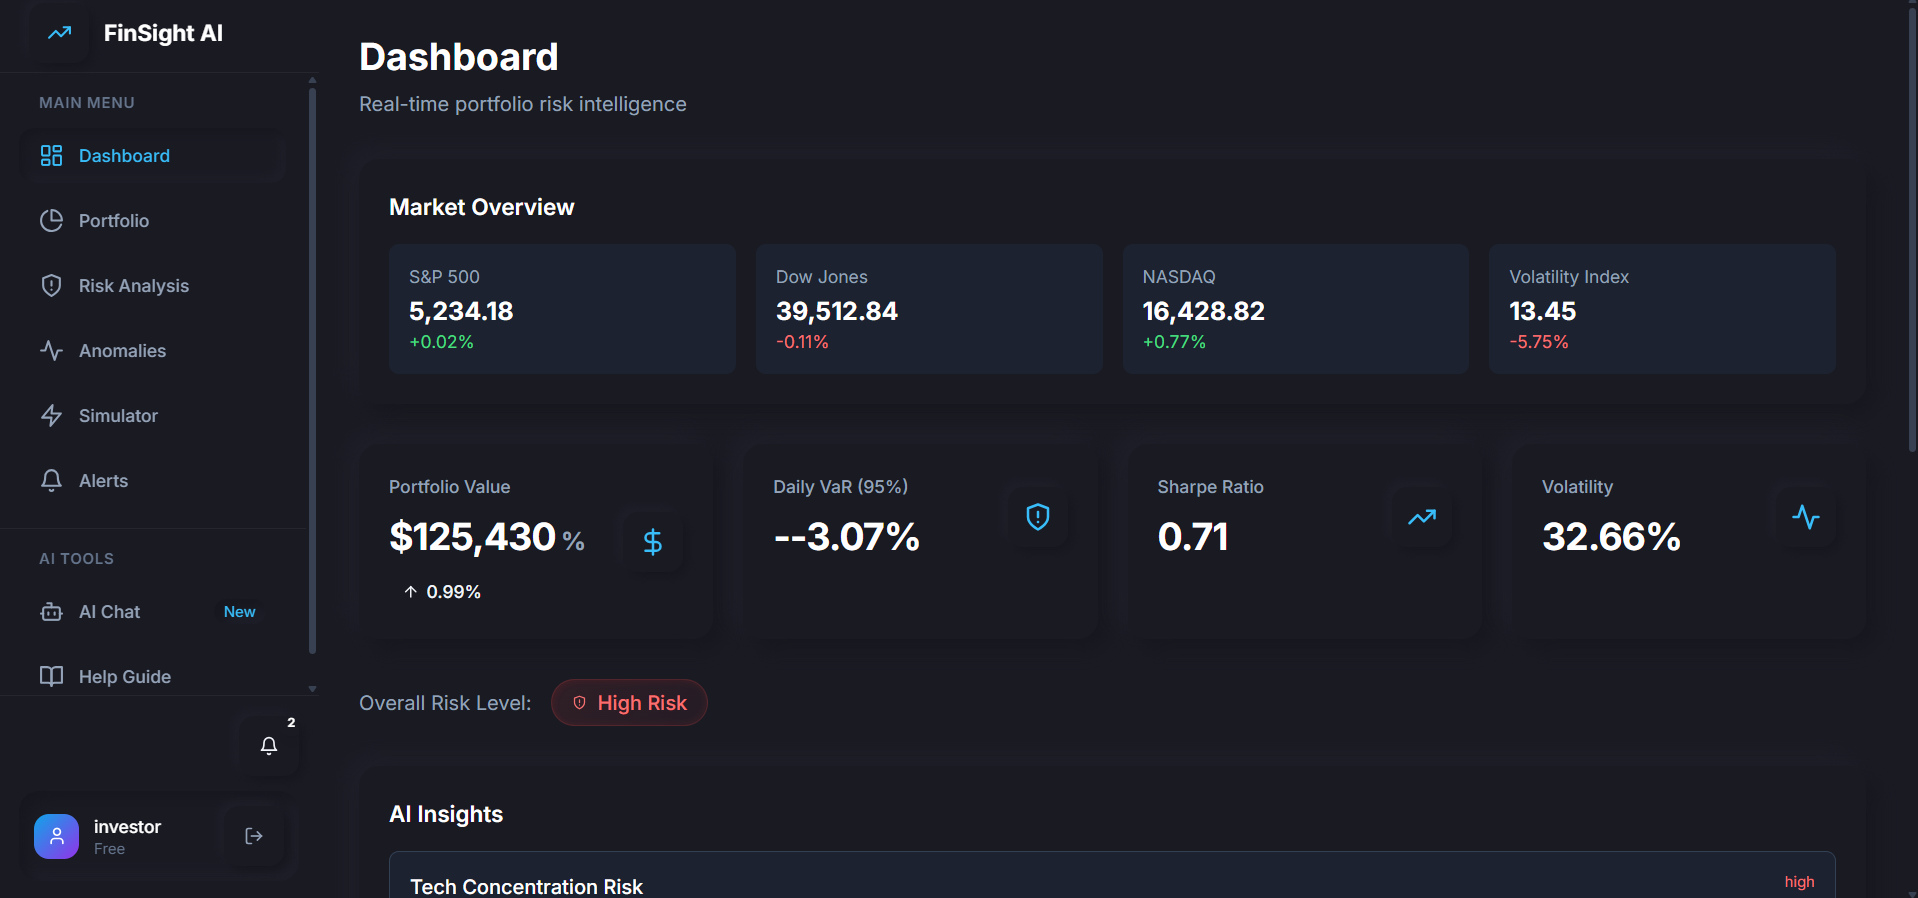
FinSight AI is a real-time portfolio risk intelligence platform. You input your holdings — any combination of stocks — assign weights, and the platform goes to work.
On the risk side, it computes the metrics that actually matter: Value at Risk (VaR) at 95% confidence, Sharpe ratio, portfolio Beta against the S&P 500, maximum drawdown, and rolling volatility. It also generates a full correlation matrix across your holdings so you can immediately see if you're more concentrated than you think.
The anomaly detector uses Z-score analysis to flag unusual price movements across your tickers over a rolling 60-day window — anything beyond two standard deviations gets surfaced as an alert, with a plain-English description of what happened and when.
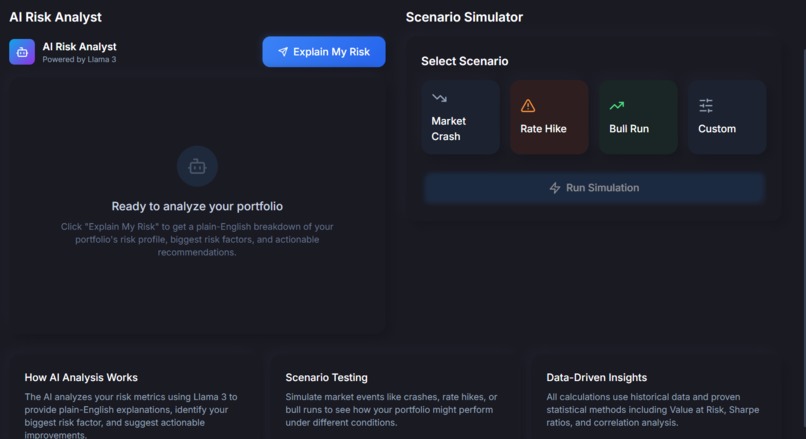
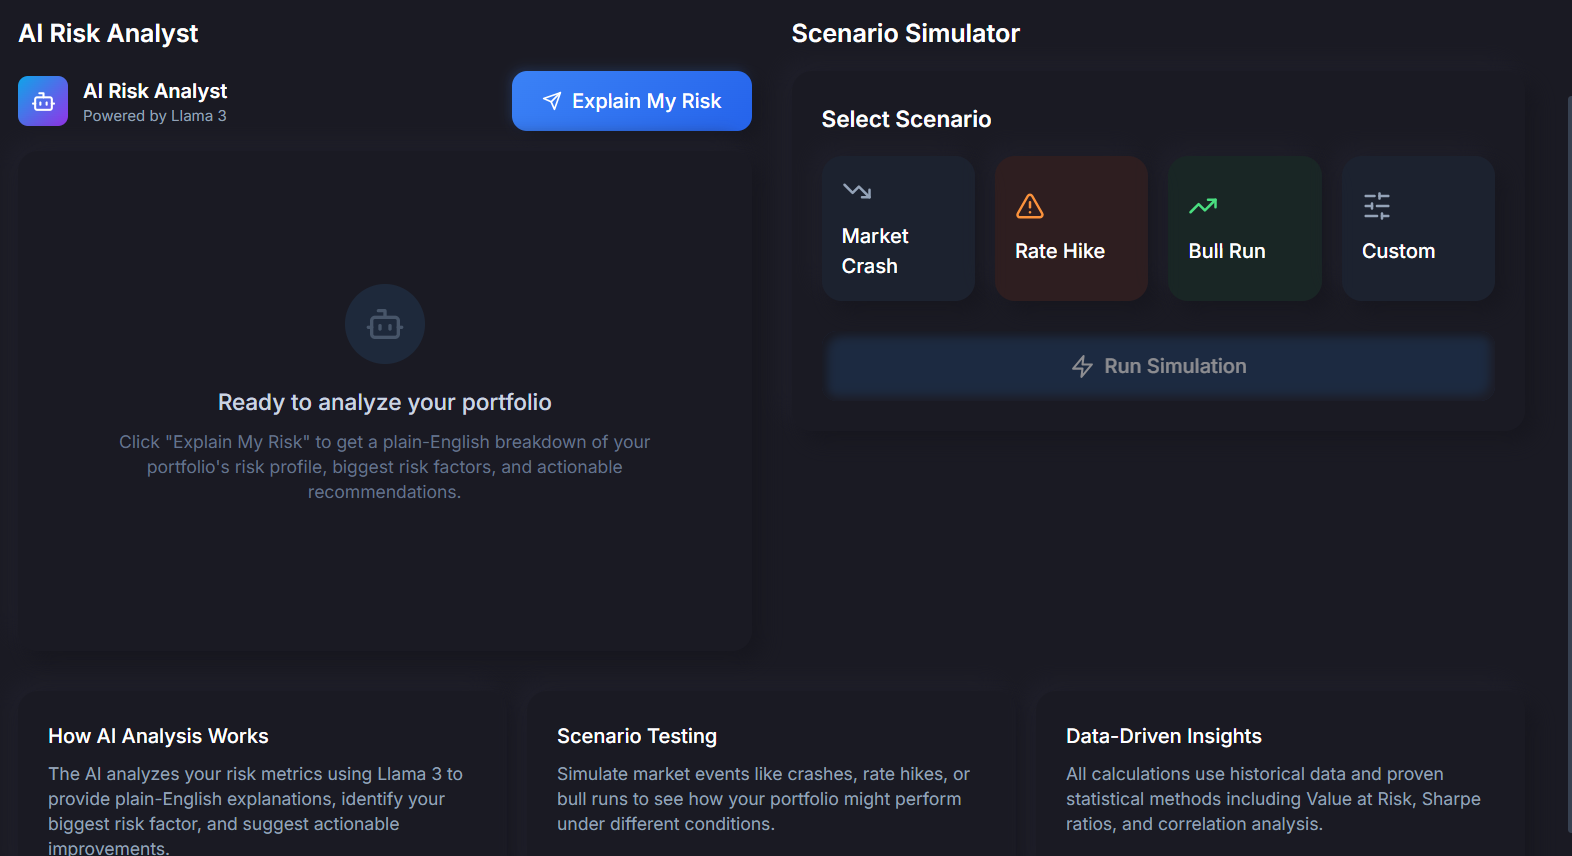
The scenario simulator lets you stress-test your portfolio against three pre-built scenarios — a market crash (−30%), a rate hike environment, or a bull run — or build a custom scenario where you set the percentage move per ticker yourself. You see before/after portfolio value with color-coded gains and losses.
The part we're most proud of: an AI explainer powered by the Claude API that takes all the raw metrics and converts them into a three-paragraph plain-English risk summary — what your biggest risk factor is, why it matters, and two specific actionable recommendations. It's the difference between data and understanding.
Finally, an alert system lets users set VaR thresholds so they're notified the moment their portfolio risk exceeds a level they're comfortable with — the core loop of any serious risk management tool.
How we built it
The backend is Python FastAPI, split into clean service layers: portfolio_service, risk_engine, ai_explainer, anomaly_detector, and market_data. Each service is independently testable and the routes stay thin — they just orchestrate, they don't compute.
Market data comes from yfinance, which gives us real historical and live price data with zero API cost. All the quantitative finance math — VaR via historical simulation, Sharpe ratio, beta regression against SPY, rolling standard deviation for volatility — is done with NumPy and SciPy directly, no black-box libraries.
The AI explainer feeds the computed risk metrics as structured context into the Claude API, with a carefully engineered system prompt that instructs the model to respond as a financial risk analyst — specific, grounded in the numbers, not generic.
The frontend is React 18 with Vite, styled with TailwindCSS, and visualized with Recharts. We built four core chart components: a cumulative returns area chart benchmarked against SPY, a correlation heatmap rendered as a color-coded bar chart, a returns distribution histogram, and a 30-day rolling volatility line chart. All of them are responsive and dark-themed.
The whole stack is containerized with Docker Compose and deployable to Railway (backend) and Vercel (frontend).
Challenges we ran into
The hardest technical problem was VaR calculation accuracy. Historical simulation VaR is conceptually simple but the implementation details matter a lot — particularly how you handle missing data, how you align price series across tickers with different trading calendars, and how you annualize returns correctly. Getting NaN values propagating silently through NumPy operations and corrupting the output without obvious errors took real debugging time.
The correlation matrix also presented a UI challenge. A proper correlation matrix with N tickers generates N² values, and rendering that in a way that's actually readable — not just a wall of numbers — required rethinking the visualization from a bar chart approach to a color-encoded grid where green means low correlation and red means high, so you can immediately see dangerous concentration.
Engineering the AI explainer prompt took more iterations than expected. Generic prompts produce generic output. Getting Claude to ground its response in the actual numbers — specifically referencing the VaR figure, the beta value, and flagging the right risk — required precise system prompt design with explicit instructions on structure, length, and what to cite.
CORS configuration between FastAPI and the Vite dev server also caused about 45 minutes of confusion early on that we'd like to never speak of again.
Accomplishments that we're proud of
The AI explainer genuinely works in a way we didn't fully anticipate. When you feed it a highly volatile, concentrated tech portfolio, the response it generates is specific, accurate, and actionable — it reads like something a junior analyst at a fund might write. That felt like a real product moment, not a hackathon demo.
The scenario simulator with the custom scenario builder is something we're particularly happy with. The ability to say "what happens to my portfolio if NVDA drops 40% and BND gains 5%" and get an immediate visual result is genuinely useful — it's the kind of what-if analysis that institutional investors run constantly but retail tools never expose.
We also built a proper, clean REST API with 15+ documented endpoints across five resource groups. It's the kind of API you could hand to another developer and they'd know exactly what to do with it.
What we learned
We learned that quantitative finance is deceptively hard to implement correctly. The formulas for Sharpe ratio or VaR look simple on a Wikipedia page. The edge cases — handling assets with short price histories, aligning multi-asset series, choosing the right confidence interval and time horizon — are where the real complexity lives. We came out with a much healthier respect for what quant teams actually do.
We also learned how much the quality of an LLM integration depends on the prompt, not the model. Two slightly different system prompts can produce outputs that feel completely different — one generic and useless, one specific and valuable. Prompt engineering is a real skill.
On the frontend, Recharts is powerful but has strong opinions about data shape. We spent time restructuring API responses to match what Recharts expects rather than fighting the library — a good lesson about working with the grain of your tools.
What's next for FinSight
The immediate next step is a proper authentication layer — right now the alert system uses localStorage as a mock, and turning it into real multi-user SaaS with JWT-based auth and a PostgreSQL backend is the obvious path forward.
We want to add options and derivatives to the portfolio analyzer. Right now it only handles equities. Supporting options positions would open up a much more realistic picture of actual retail investor portfolios, and the Greeks (delta, gamma, theta) map naturally onto the risk framework we've already built.
A mobile app is on the roadmap — the core value of getting a real-time risk alert when your portfolio breaches a threshold is actually more valuable on mobile than desktop. You're not at a computer when markets move; you're out.
Longer term, the most interesting version of this is institutional: a white-label risk intelligence API that portfolio managers at small funds or family offices could plug into their existing tools. The infrastructure is already there — it's a business model question, not an engineering one.
Built With
- groqai
- javascript
- python
- react
- recharts
- sql
- tailwind
- yfinance

Log in or sign up for Devpost to join the conversation.