-
-
-
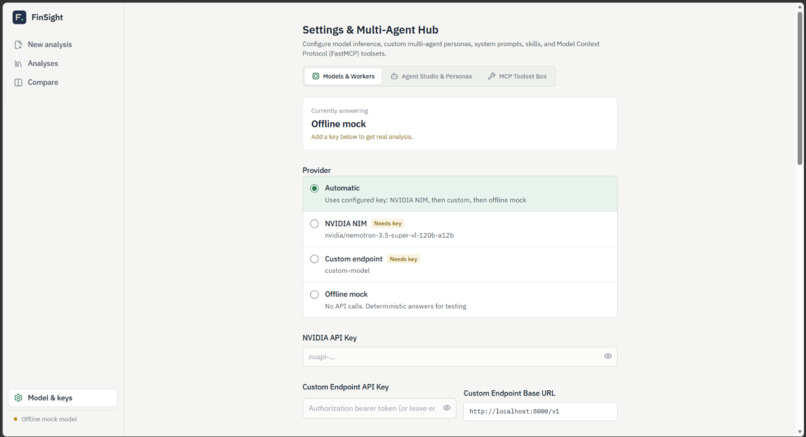
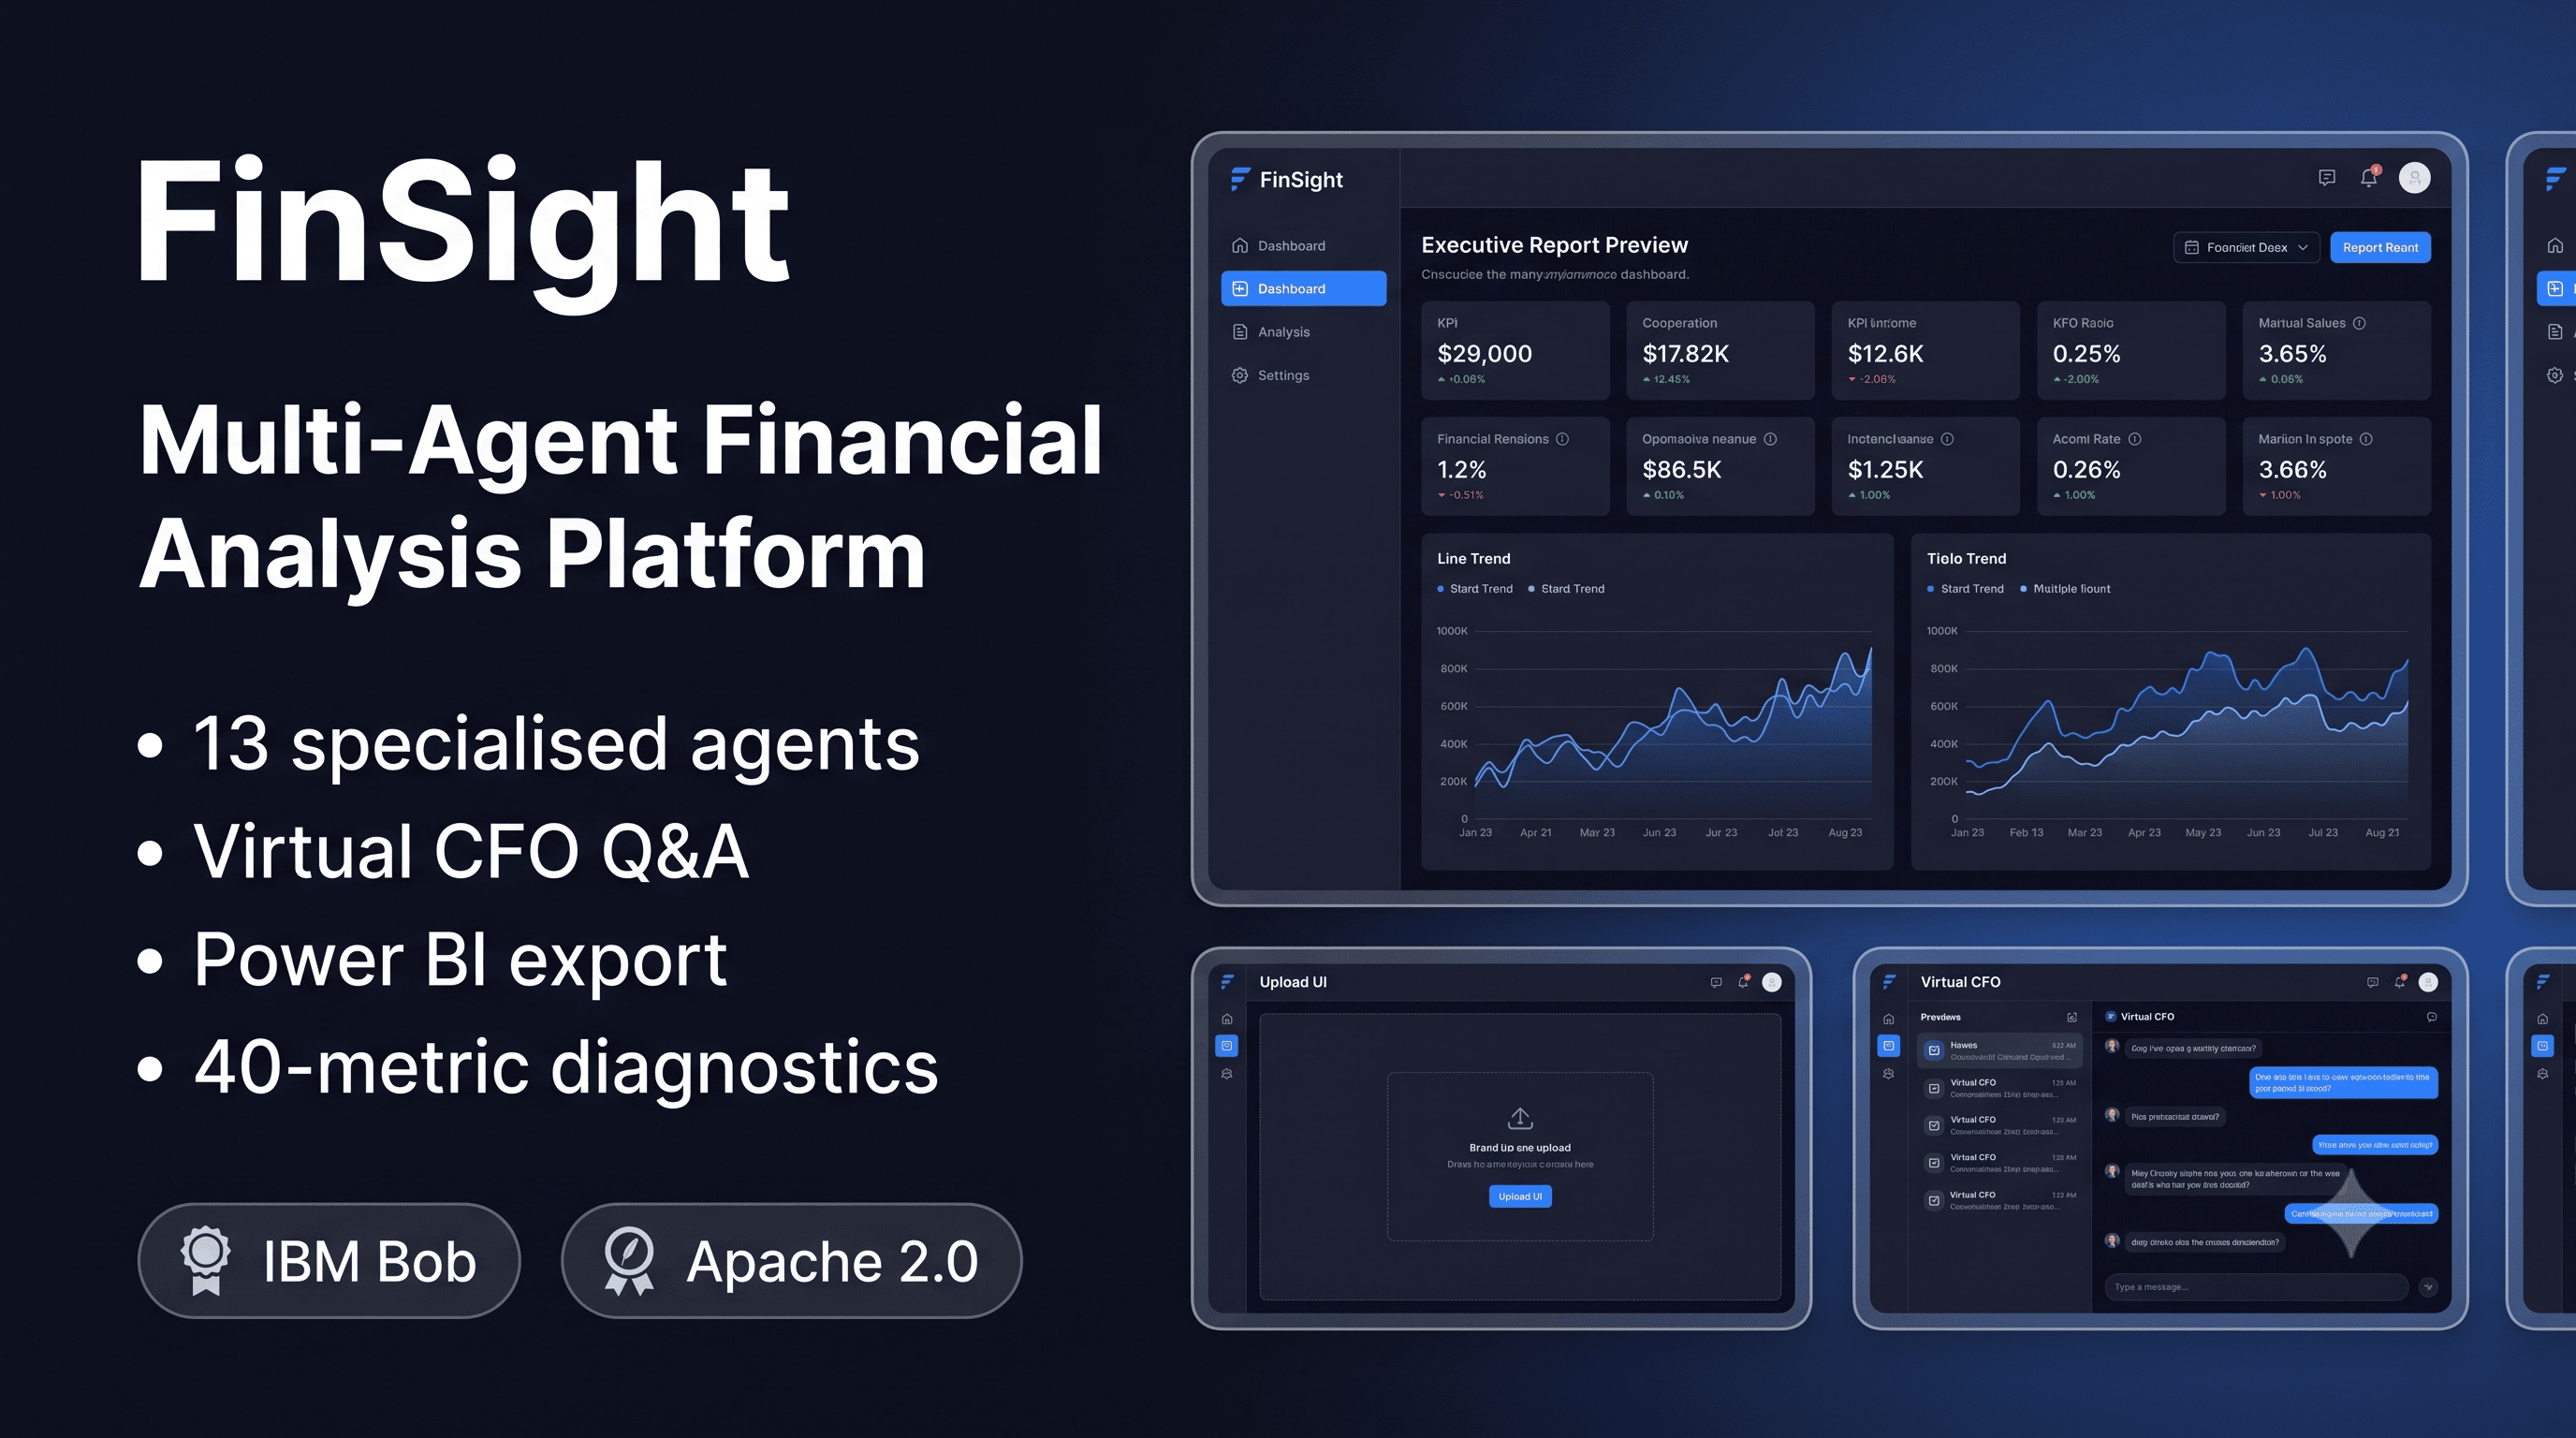
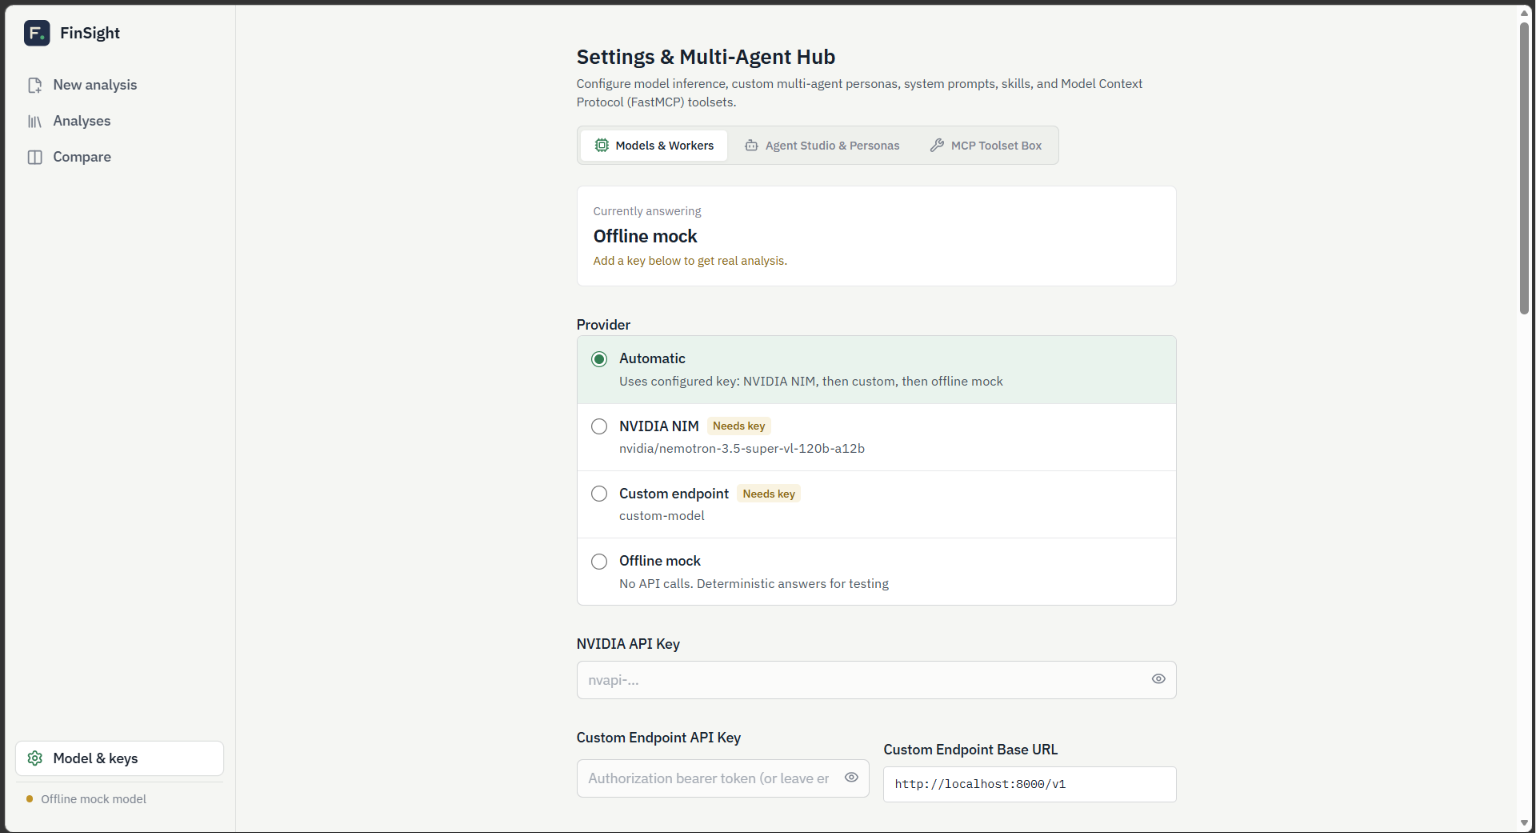
Model configuration
-
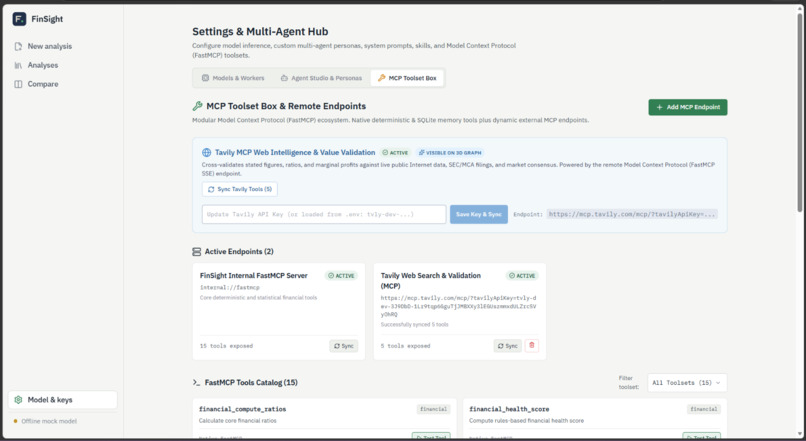
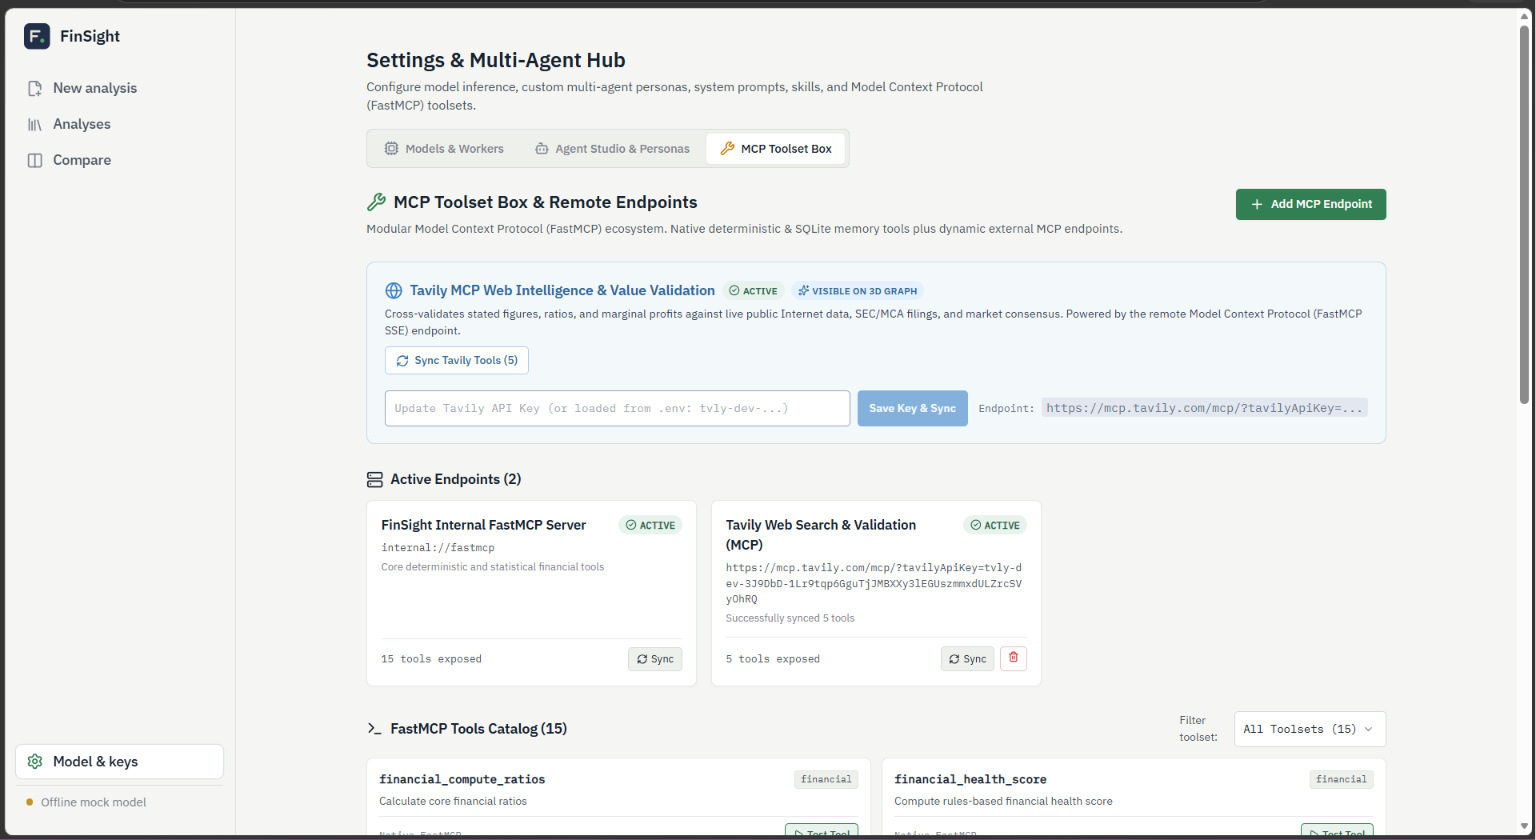
Custom MCP tools
-
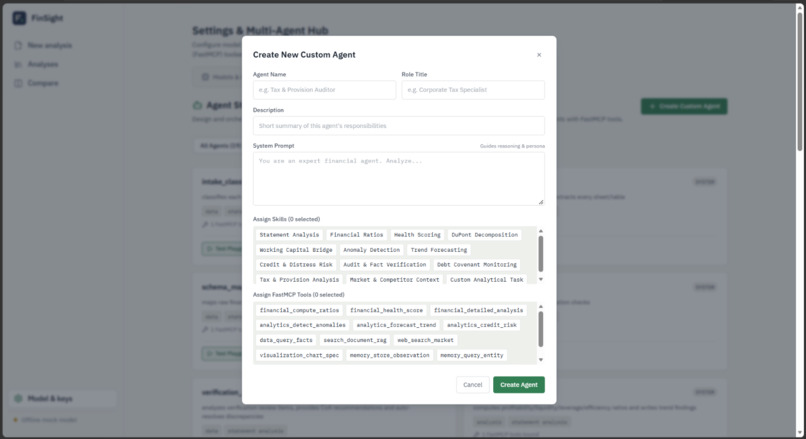
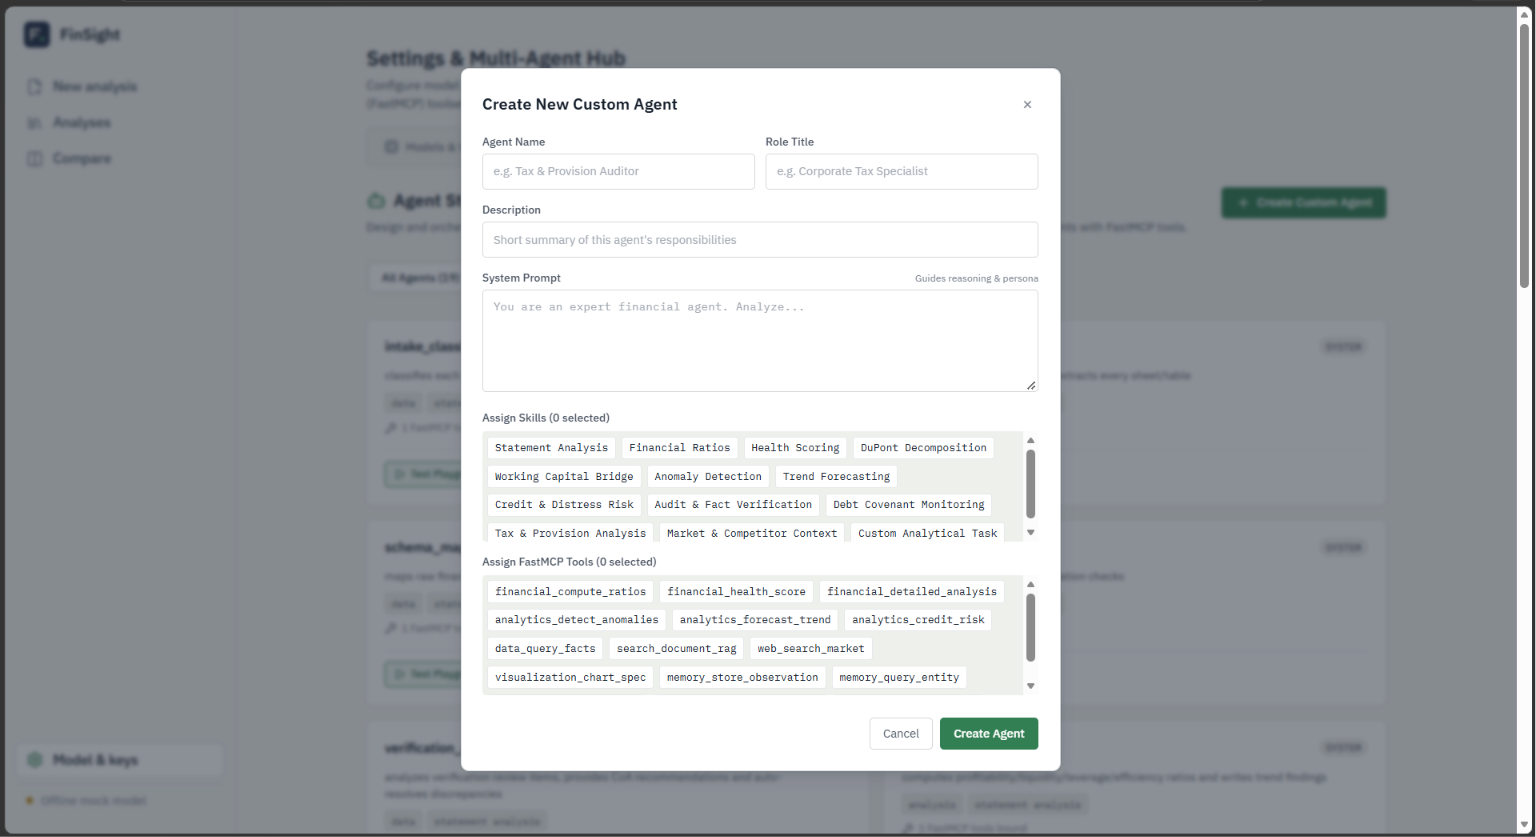
Create Agents and define its Task and tools access
-
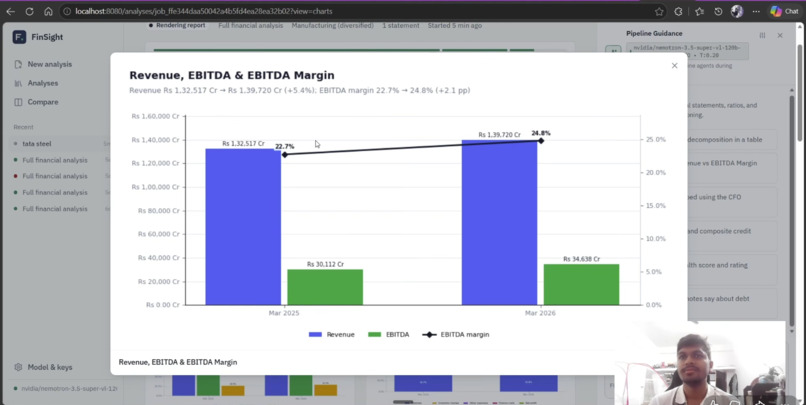
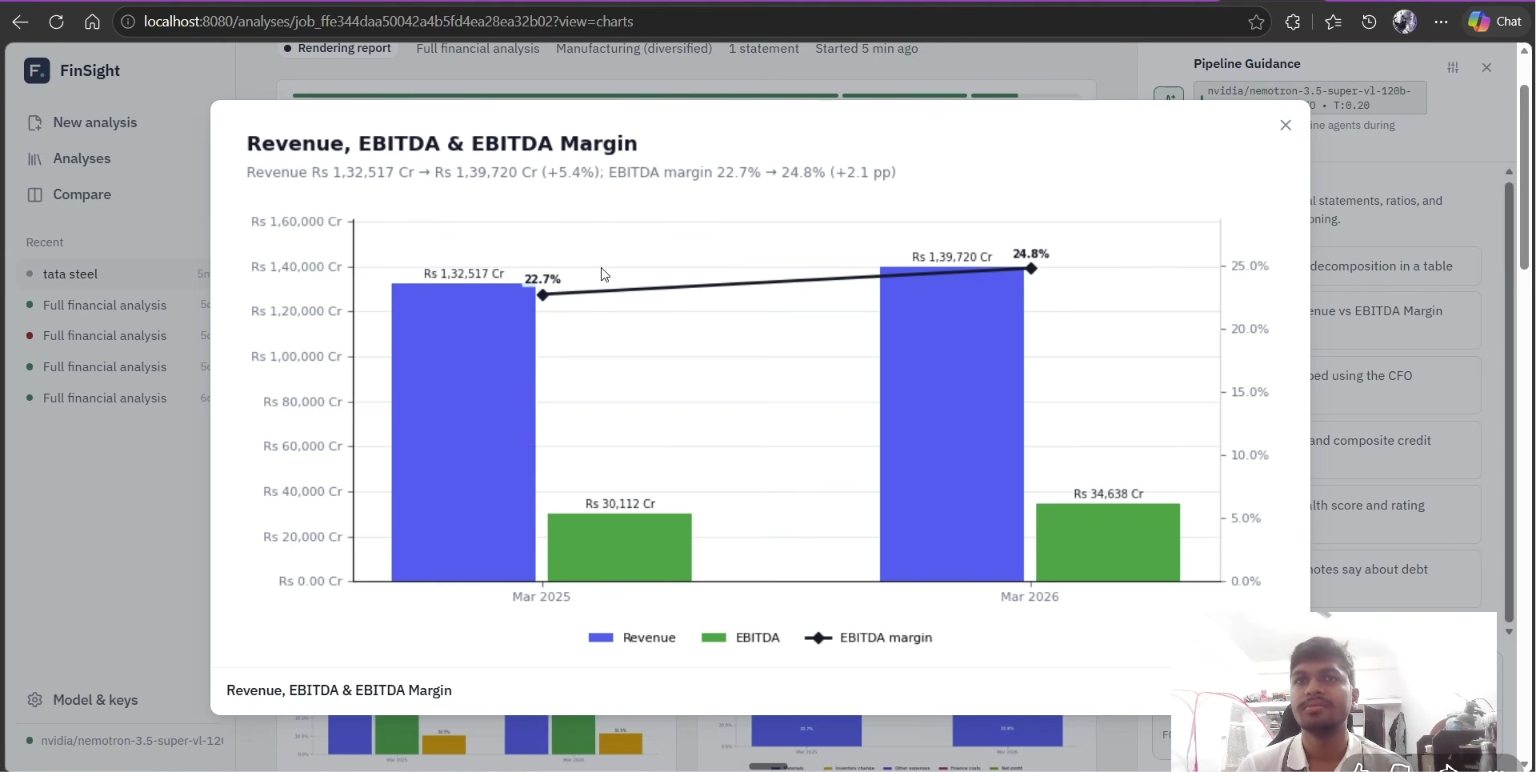
Charts generated by our model
Inspiration
FinSight started with a simple question: why does understanding a company’s finances still involve so much copying, cleaning, and switching between spreadsheets?
A balance sheet shows what changed, but understanding why often requires digging through income statements, cash flows, and document notes. I wanted to bring those steps into one place, where someone could upload financial documents, inspect the results, and ask follow-up questions.
What it does
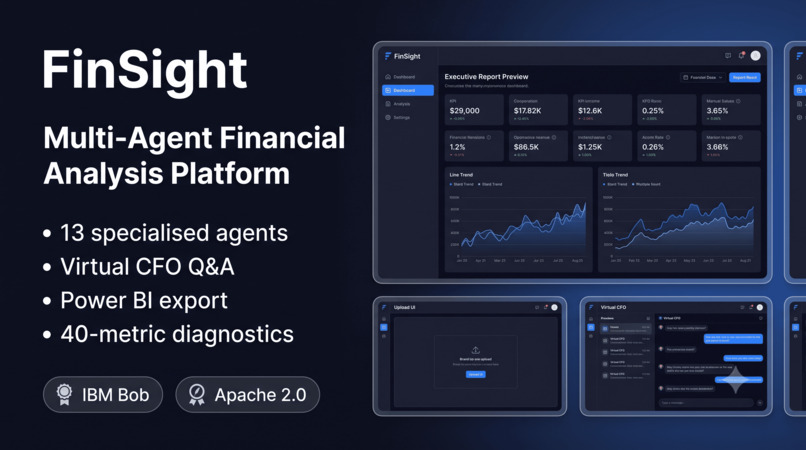
FinSight processes financial documents in PDF, Excel, and CSV formats. It extracts data, maps accounts, checks reconciliation, and produces financial metrics, charts, and reports.
The Virtual CFO assistant lets users ask questions such as:
- “Why did profitability decline?”
- “What is driving the change in working capital?”
- “What should I investigate next?”
Users can review uncertain account mappings before the pipeline continues. This was an important feature because a report is only useful if the underlying data is classified correctly.
How I built it
I used Python and Flask for the backend and React with TypeScript for the frontend. Celery and Redis handle background processing, while Docker packages the services for deployment.
The analysis runs through specialised agents responsible for extraction, account mapping, reconciliation, financial analysis, forecasting, and reporting. A dependency graph controls when each agent runs.
I kept financial calculations in code and used the language model to explain the results. For example, the current ratio is calculated from the underlying financial data:
$$ \text{Current Ratio} = \frac{\text{Current Assets}}{\text{Current Liabilities}} $$
The report then inserts stored metric values through placeholders, keeping the explanation connected to the calculated numbers.
I also added document retrieval for questions about financial notes and Tavily integration for queries that require external validation.
Challenges I faced
Getting different documents into a consistent structure was one of the hardest parts. Financial files contain extra headers, multiple sheets, inconsistent account names, and different table layouts. Reading a number is easier than correctly understanding what it represents.
Making the assistant work across different tool paths was another challenge. Some questions need only financial data; others need document retrieval or web validation. While debugging, I found an undefined-variable error that appeared when web validation was skipped or failed. Successful lookups had hidden it. I corrected the variable reference and added regression tests for each case.
Deployment also required attention. The frontend, API, background worker, and Redis needed to work together within limited resources.
What I learned
I learned that reliable financial AI starts well before the prompt. Data extraction, account mapping, reconciliation, and calculation all affect the quality of the final answer.
I also learned to test what happens when a tool fails or returns no results. A working demonstration can hide problems in less common paths.
The most satisfying part was connecting the report to the conversation. Instead of stopping at a chart or ratio, a user can ask what might explain the result and what evidence to examine next.
What’s next
I want to improve support for varied document layouts, make source references easier to inspect, and strengthen the assistant’s handling of incomplete data.
The next step is testing with more real-world financial documents and using that feedback to improve the workflow.
Built With
- celery
- css
- docker
- flask
- gunicorn
- html
- langchain
- langgraph
- nginx
- numpy
- pandas
- postgresql
- python
- react
- redis
- rest-api
- scikit-learn
- sqlalchemy
- sqlite
- tavily
- typescript
- vite

Log in or sign up for Devpost to join the conversation.