About FinSentinel
Inspiration
Financial markets generate enormous amounts of data every day, but identifying an unusual stock movement is only the first step. Understanding whether it reflects broader market activity, a sector-wide trend, unusual trading behaviour, or a potentially company-specific event is much more challenging.
This inspired us to build FinSentinel, an AI-powered financial early-warning and decision-intelligence platform that goes beyond simply flagging anomalies. Our goal was to help analysts investigate unusual market activity, understand the available evidence, and decide which events deserve closer attention.
What We Built
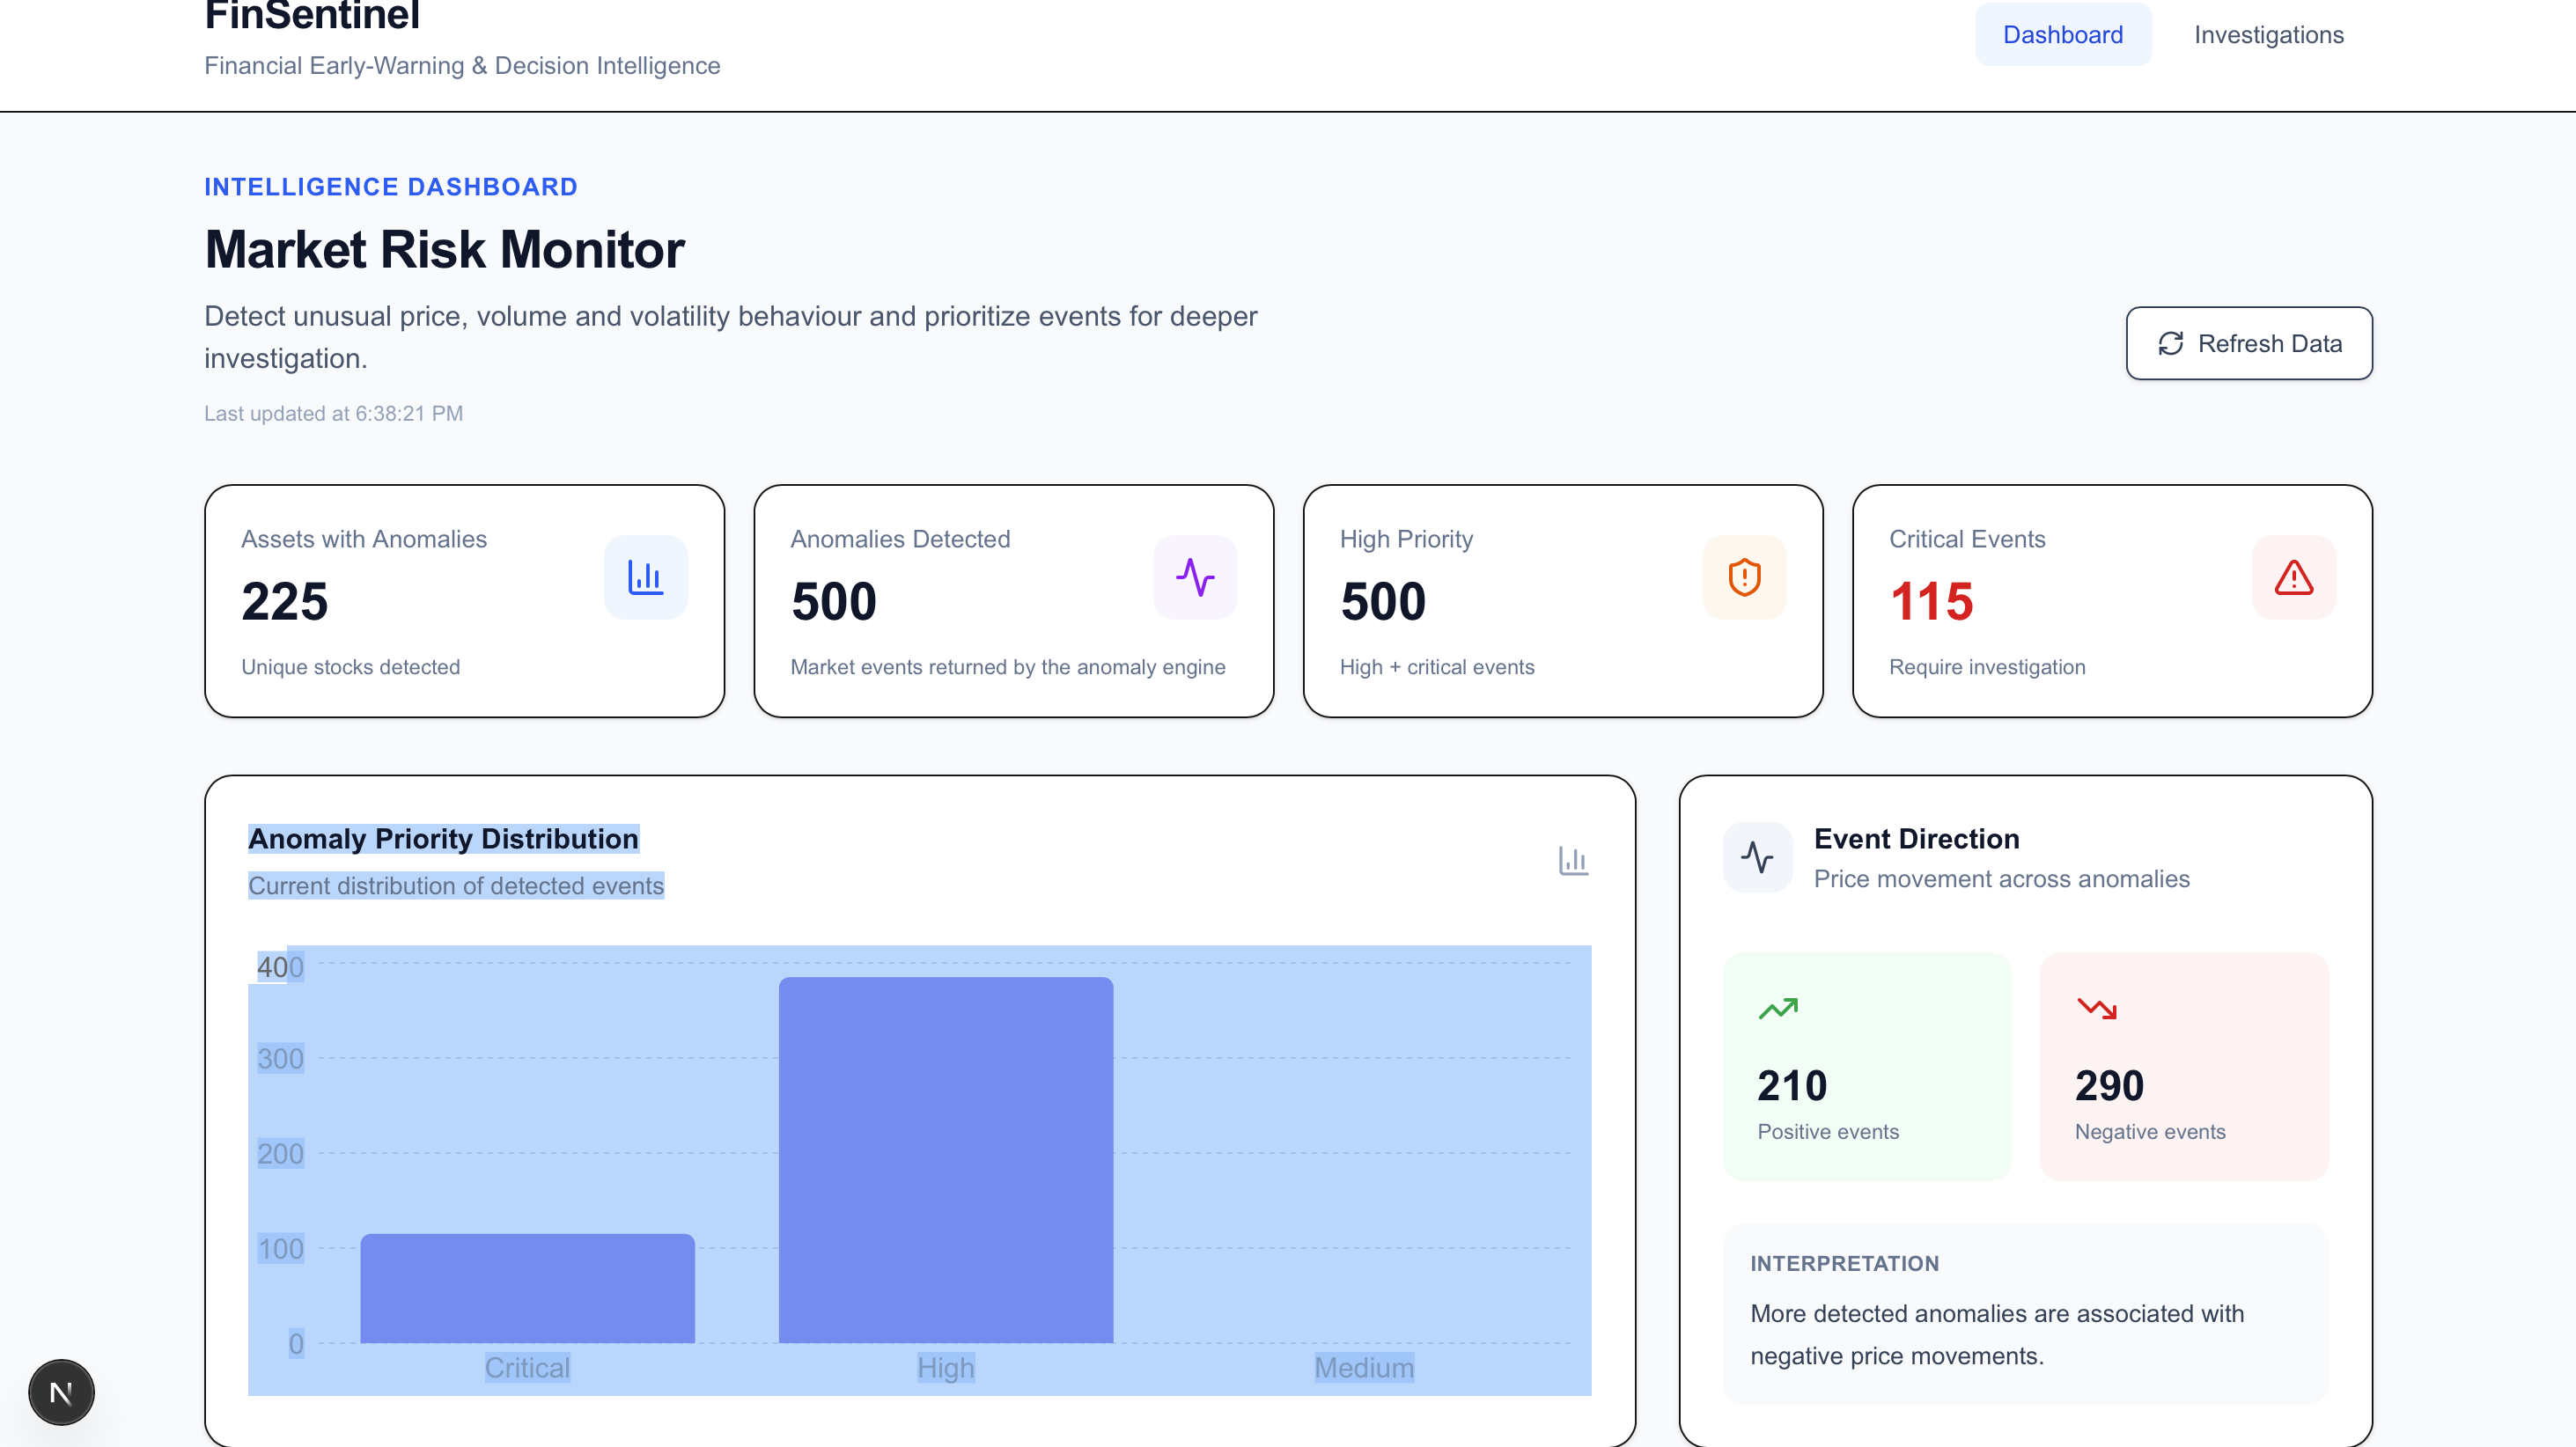
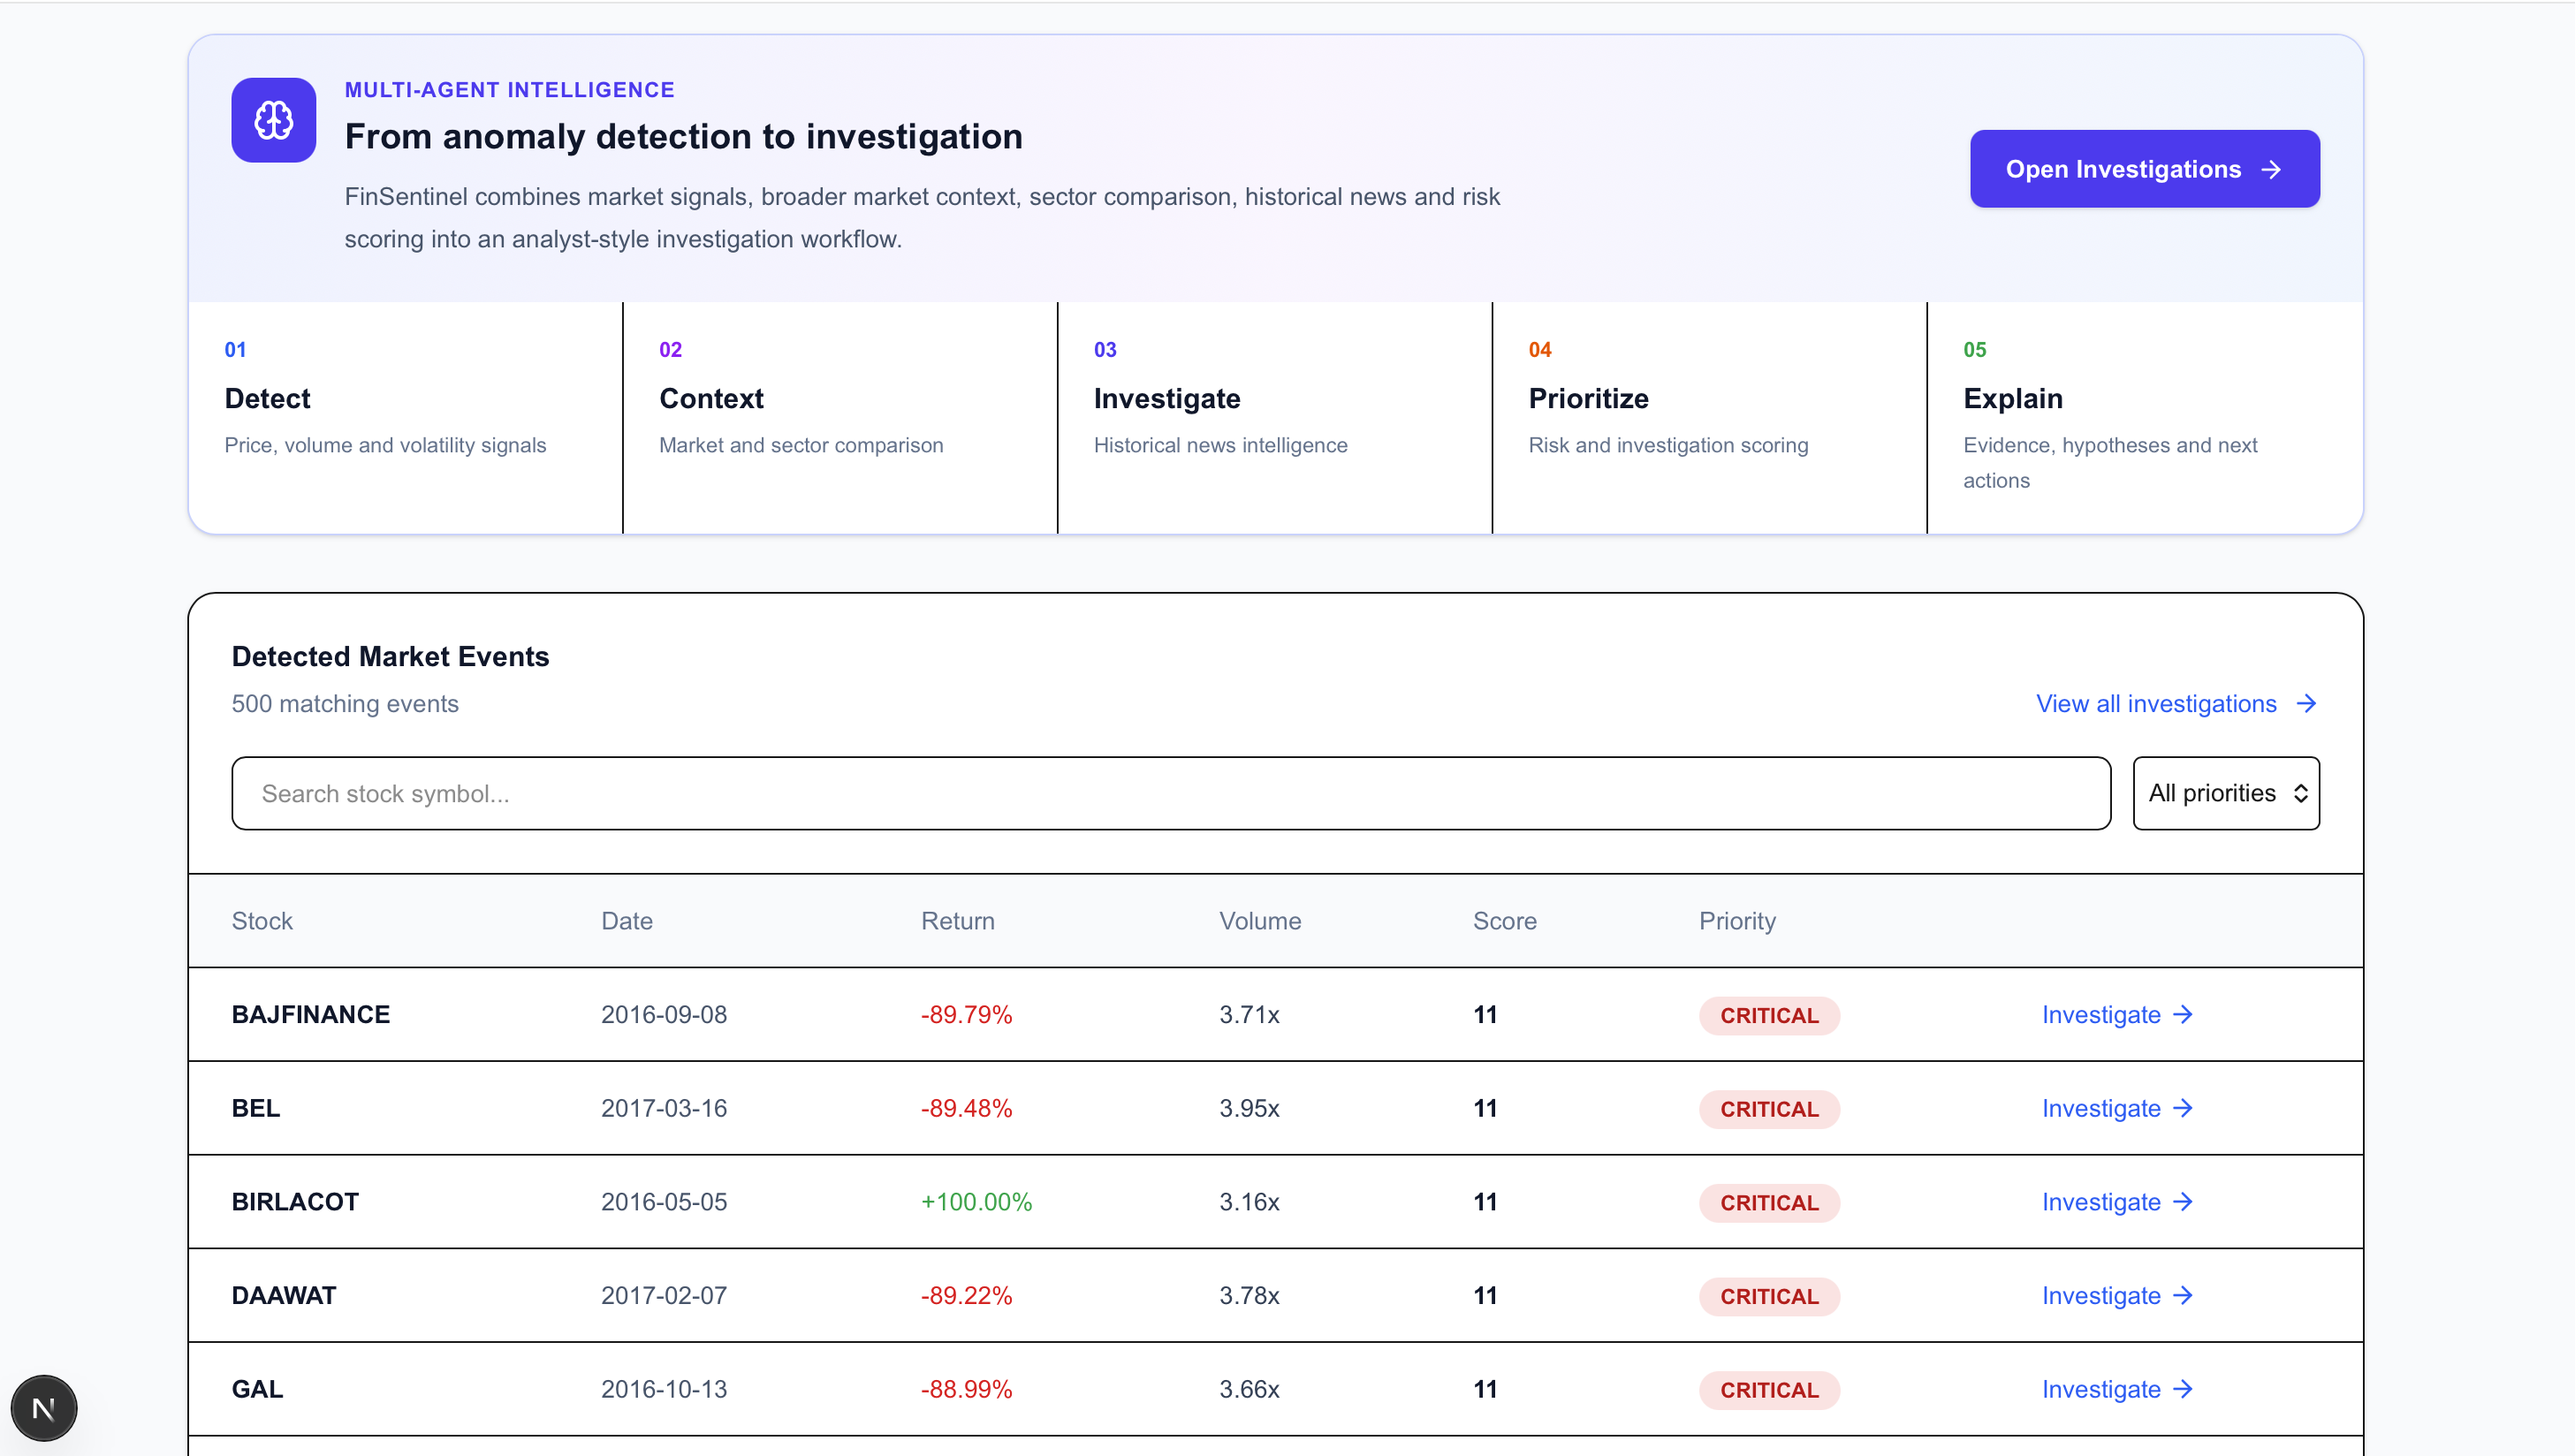
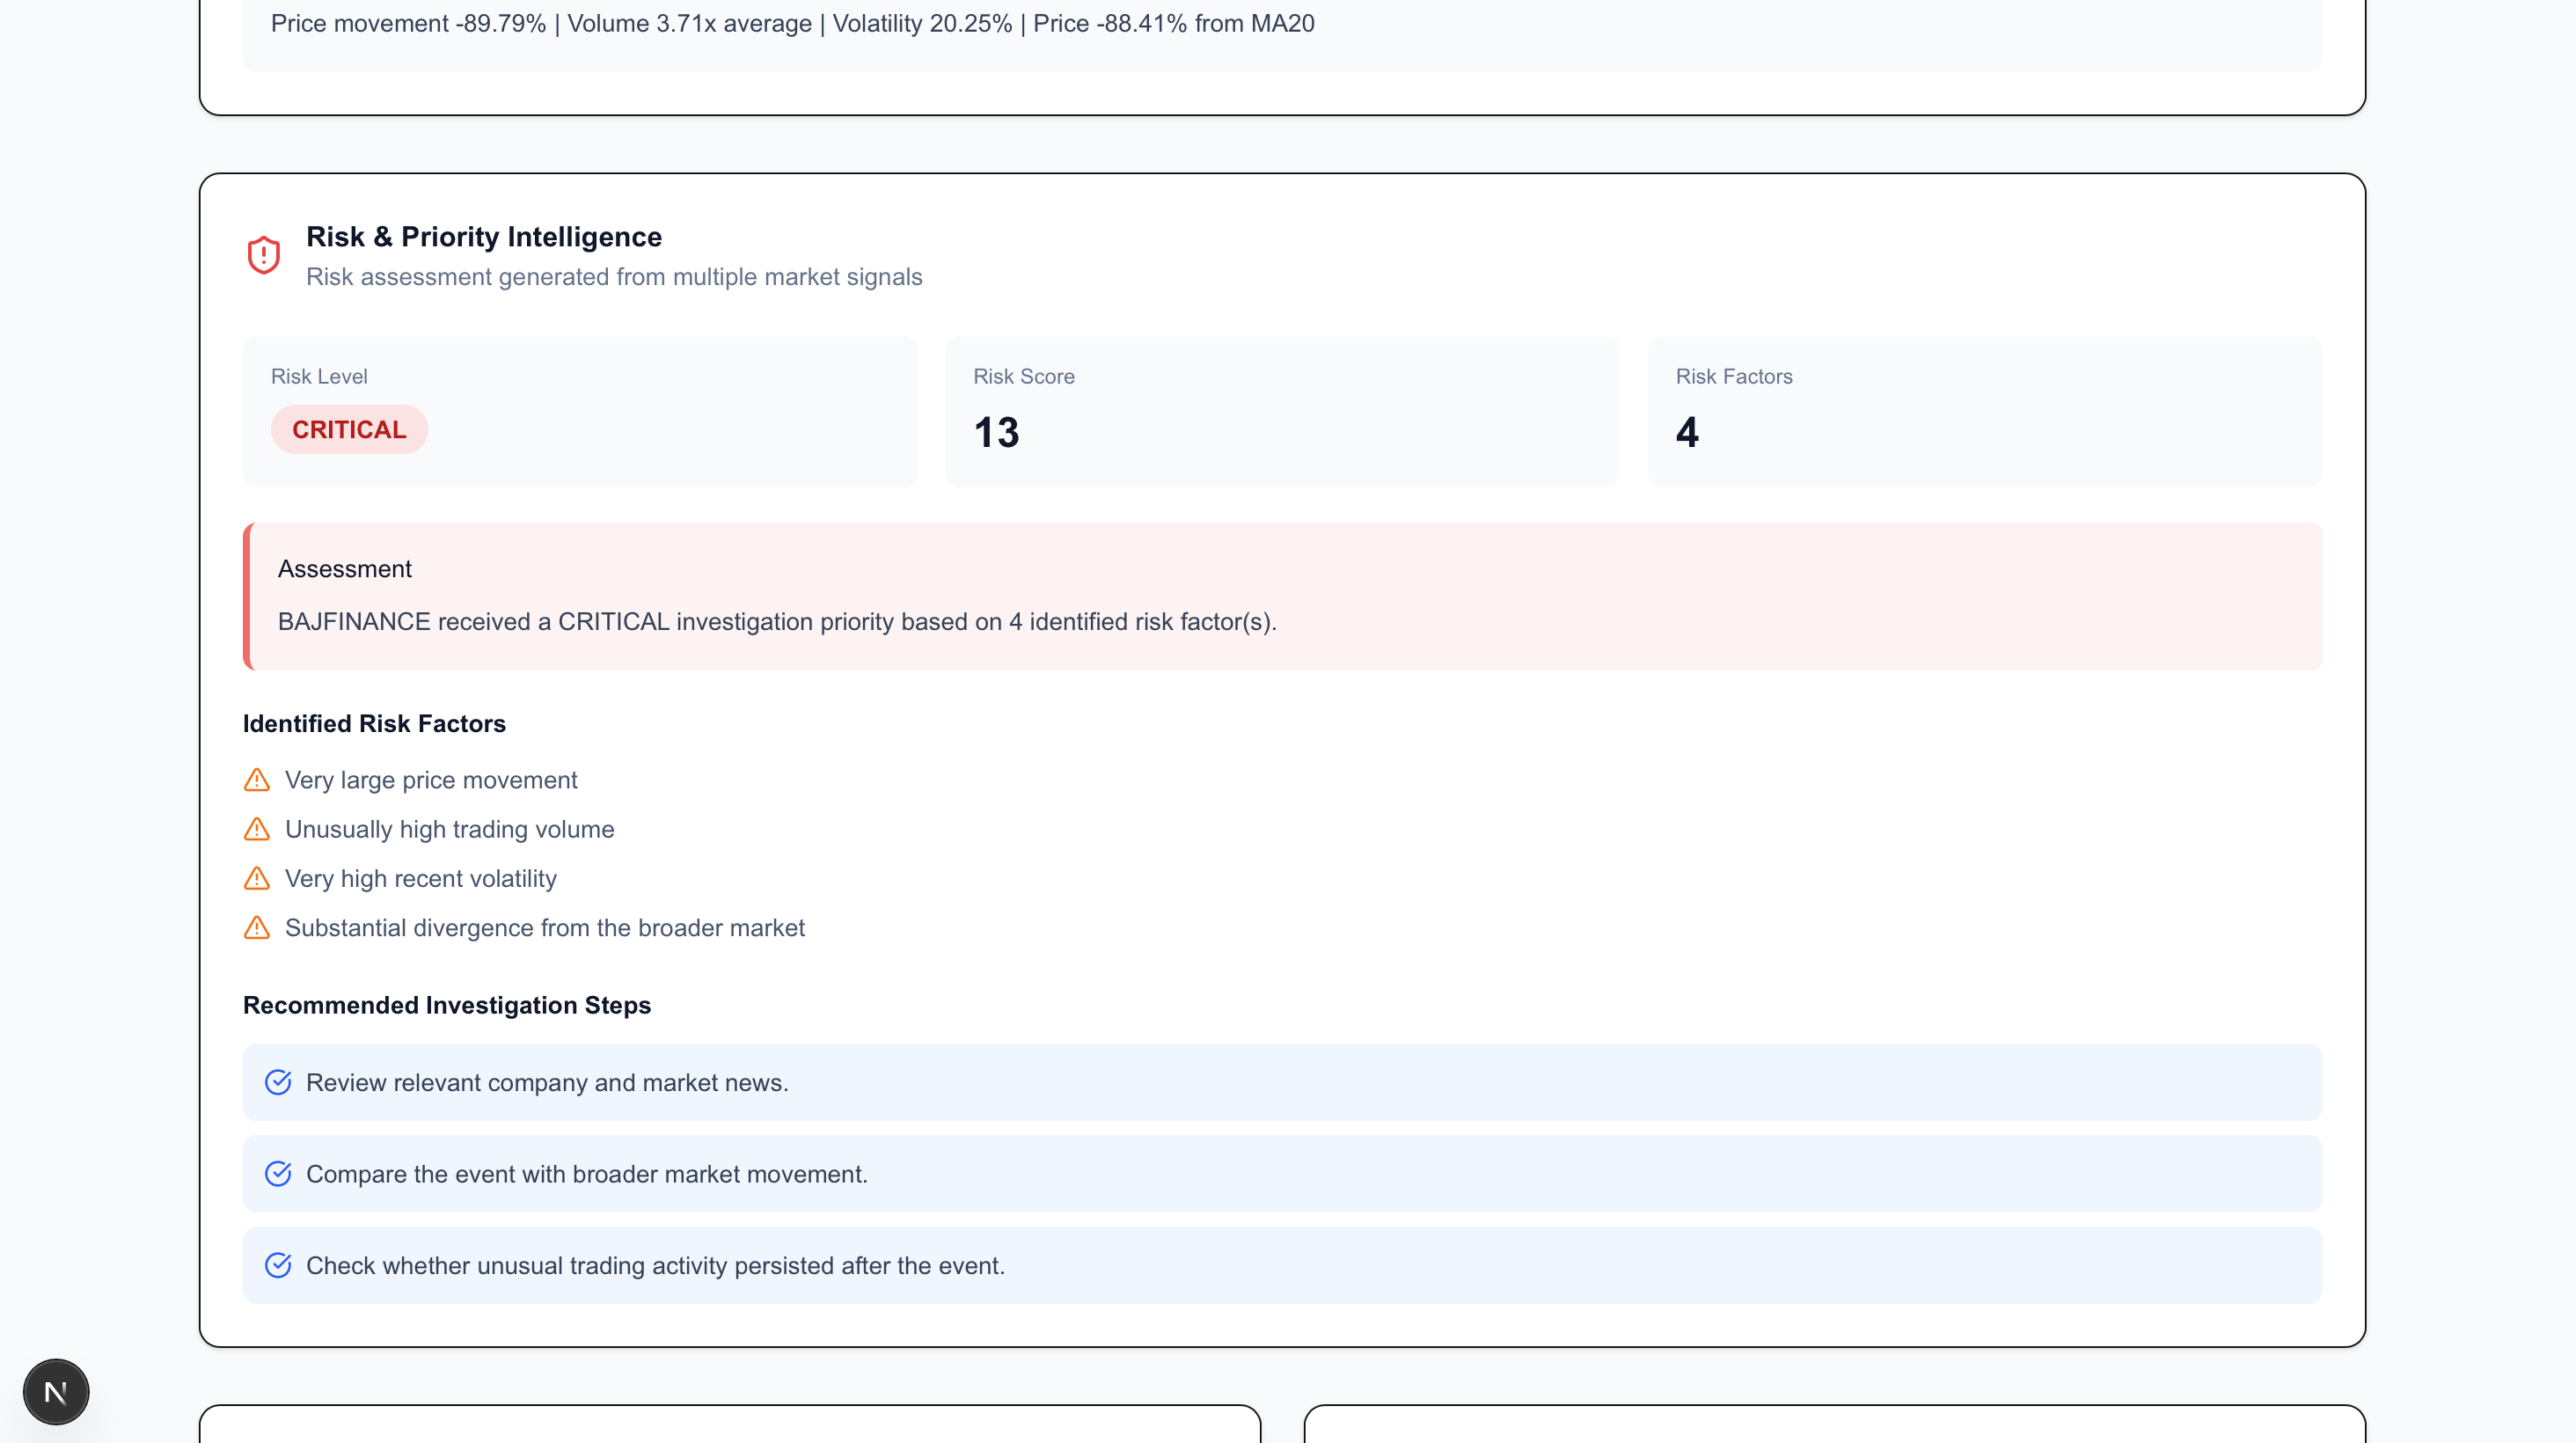
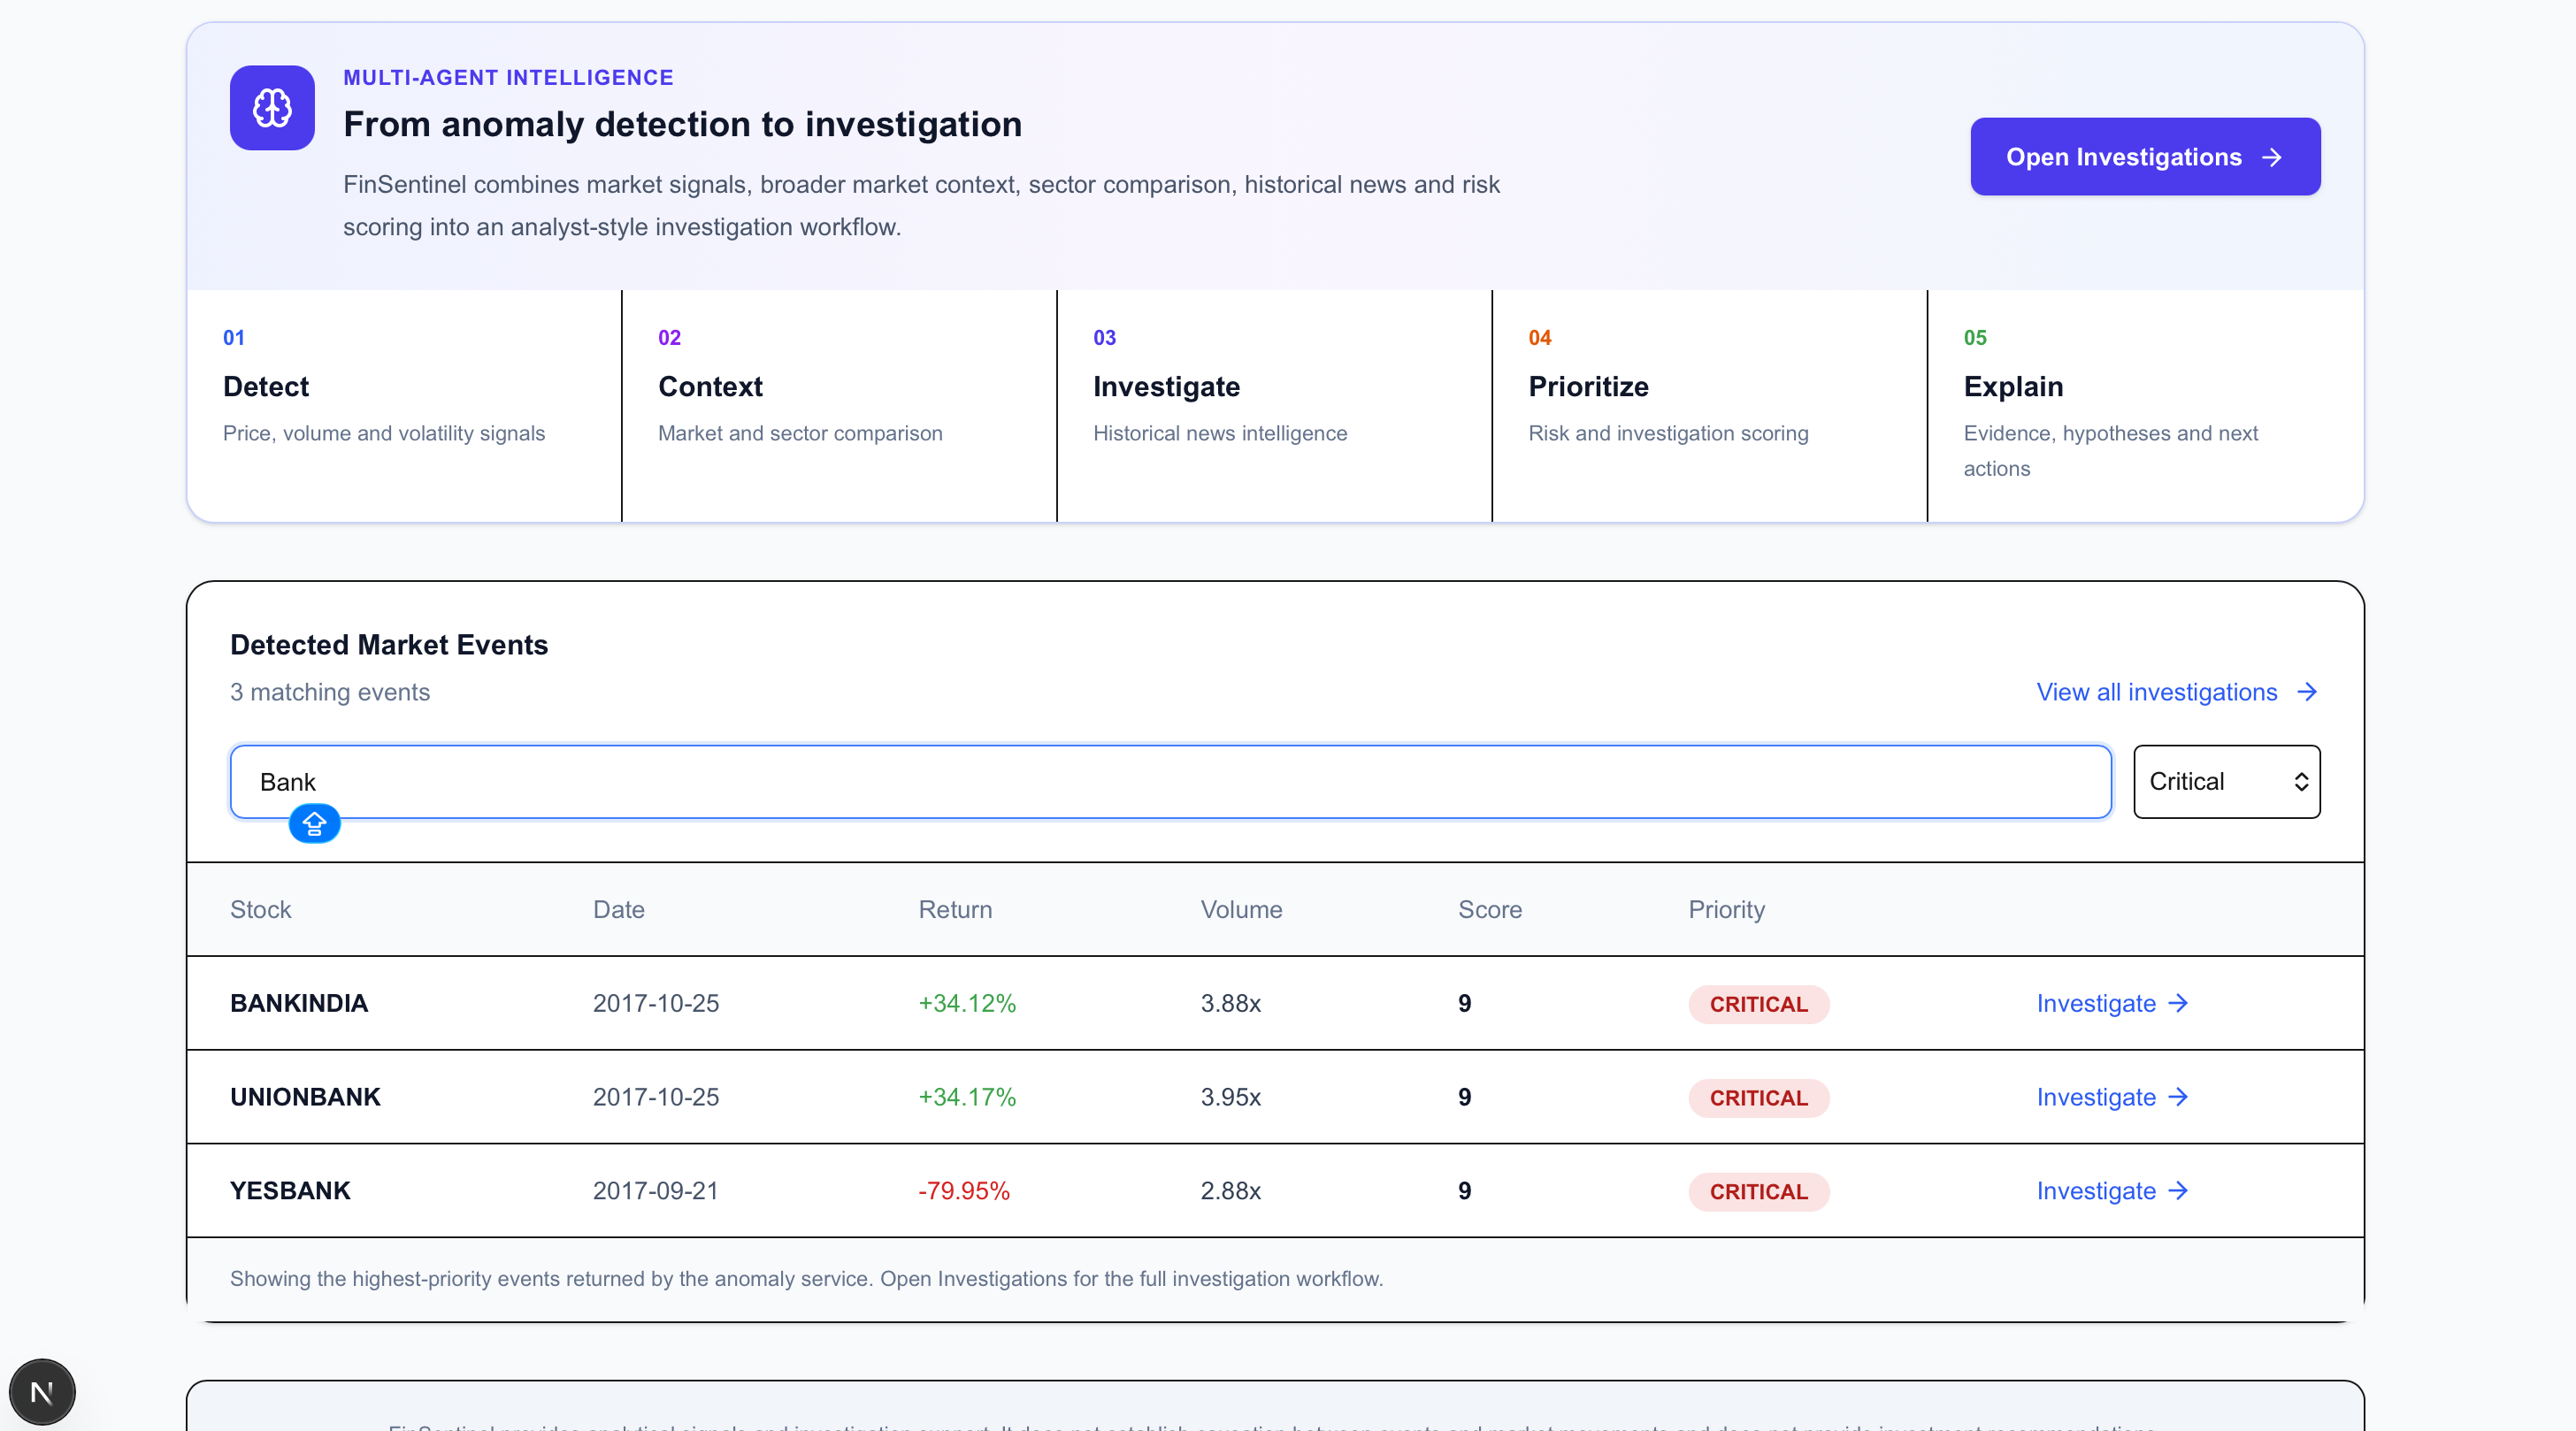
FinSentinel analyzes historical NSE stock market data to detect unusual price movements, trading-volume spikes, volatility changes, and deviations from moving averages. Each detected event receives an anomaly score and investigation priority.
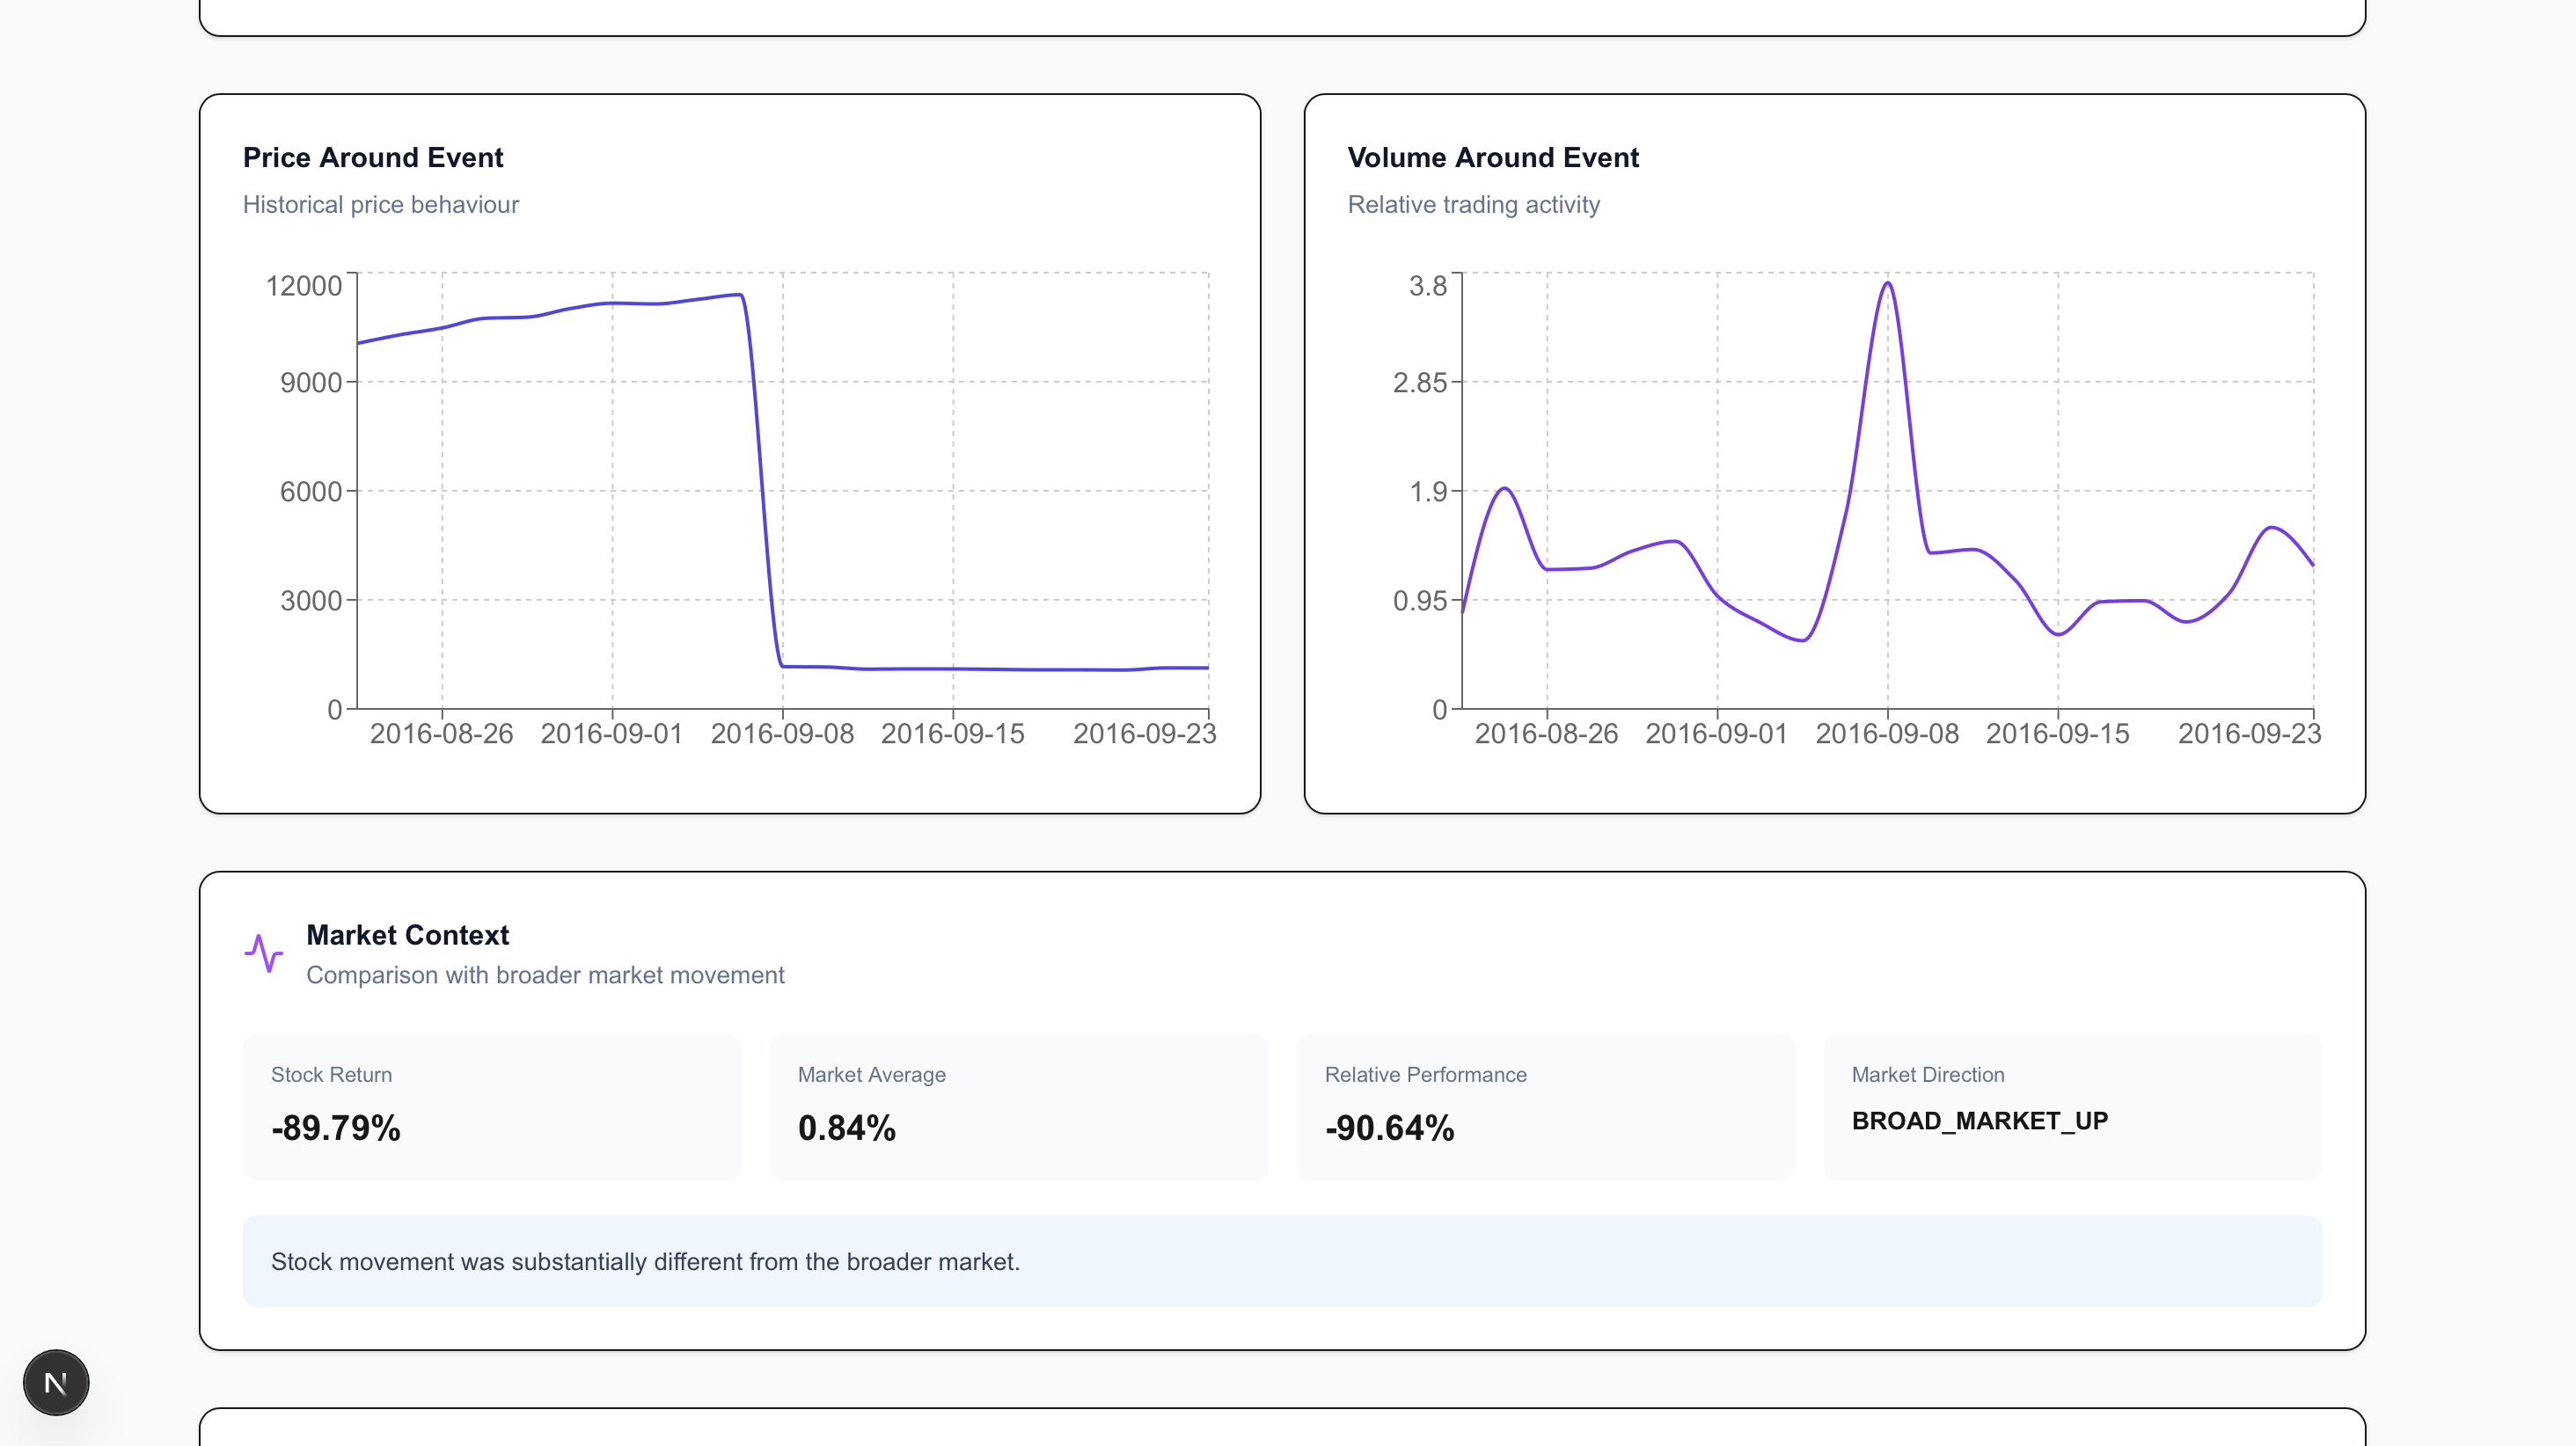
We built a multi-agent investigation workflow using Python and FastAPI. Specialized agents handle news intelligence, broader-market comparison, sector analysis, risk prioritization, and investigation summarization. A Next.js and TypeScript dashboard presents the results through interactive charts, KPI cards, investigation tables, and detailed event reports.
We also implemented Historical Event Outcome Analysis, which examines what actually happened one, five, and ten trading sessions after a detected anomaly. This is retrospective analysis, not a prediction of future stock prices.
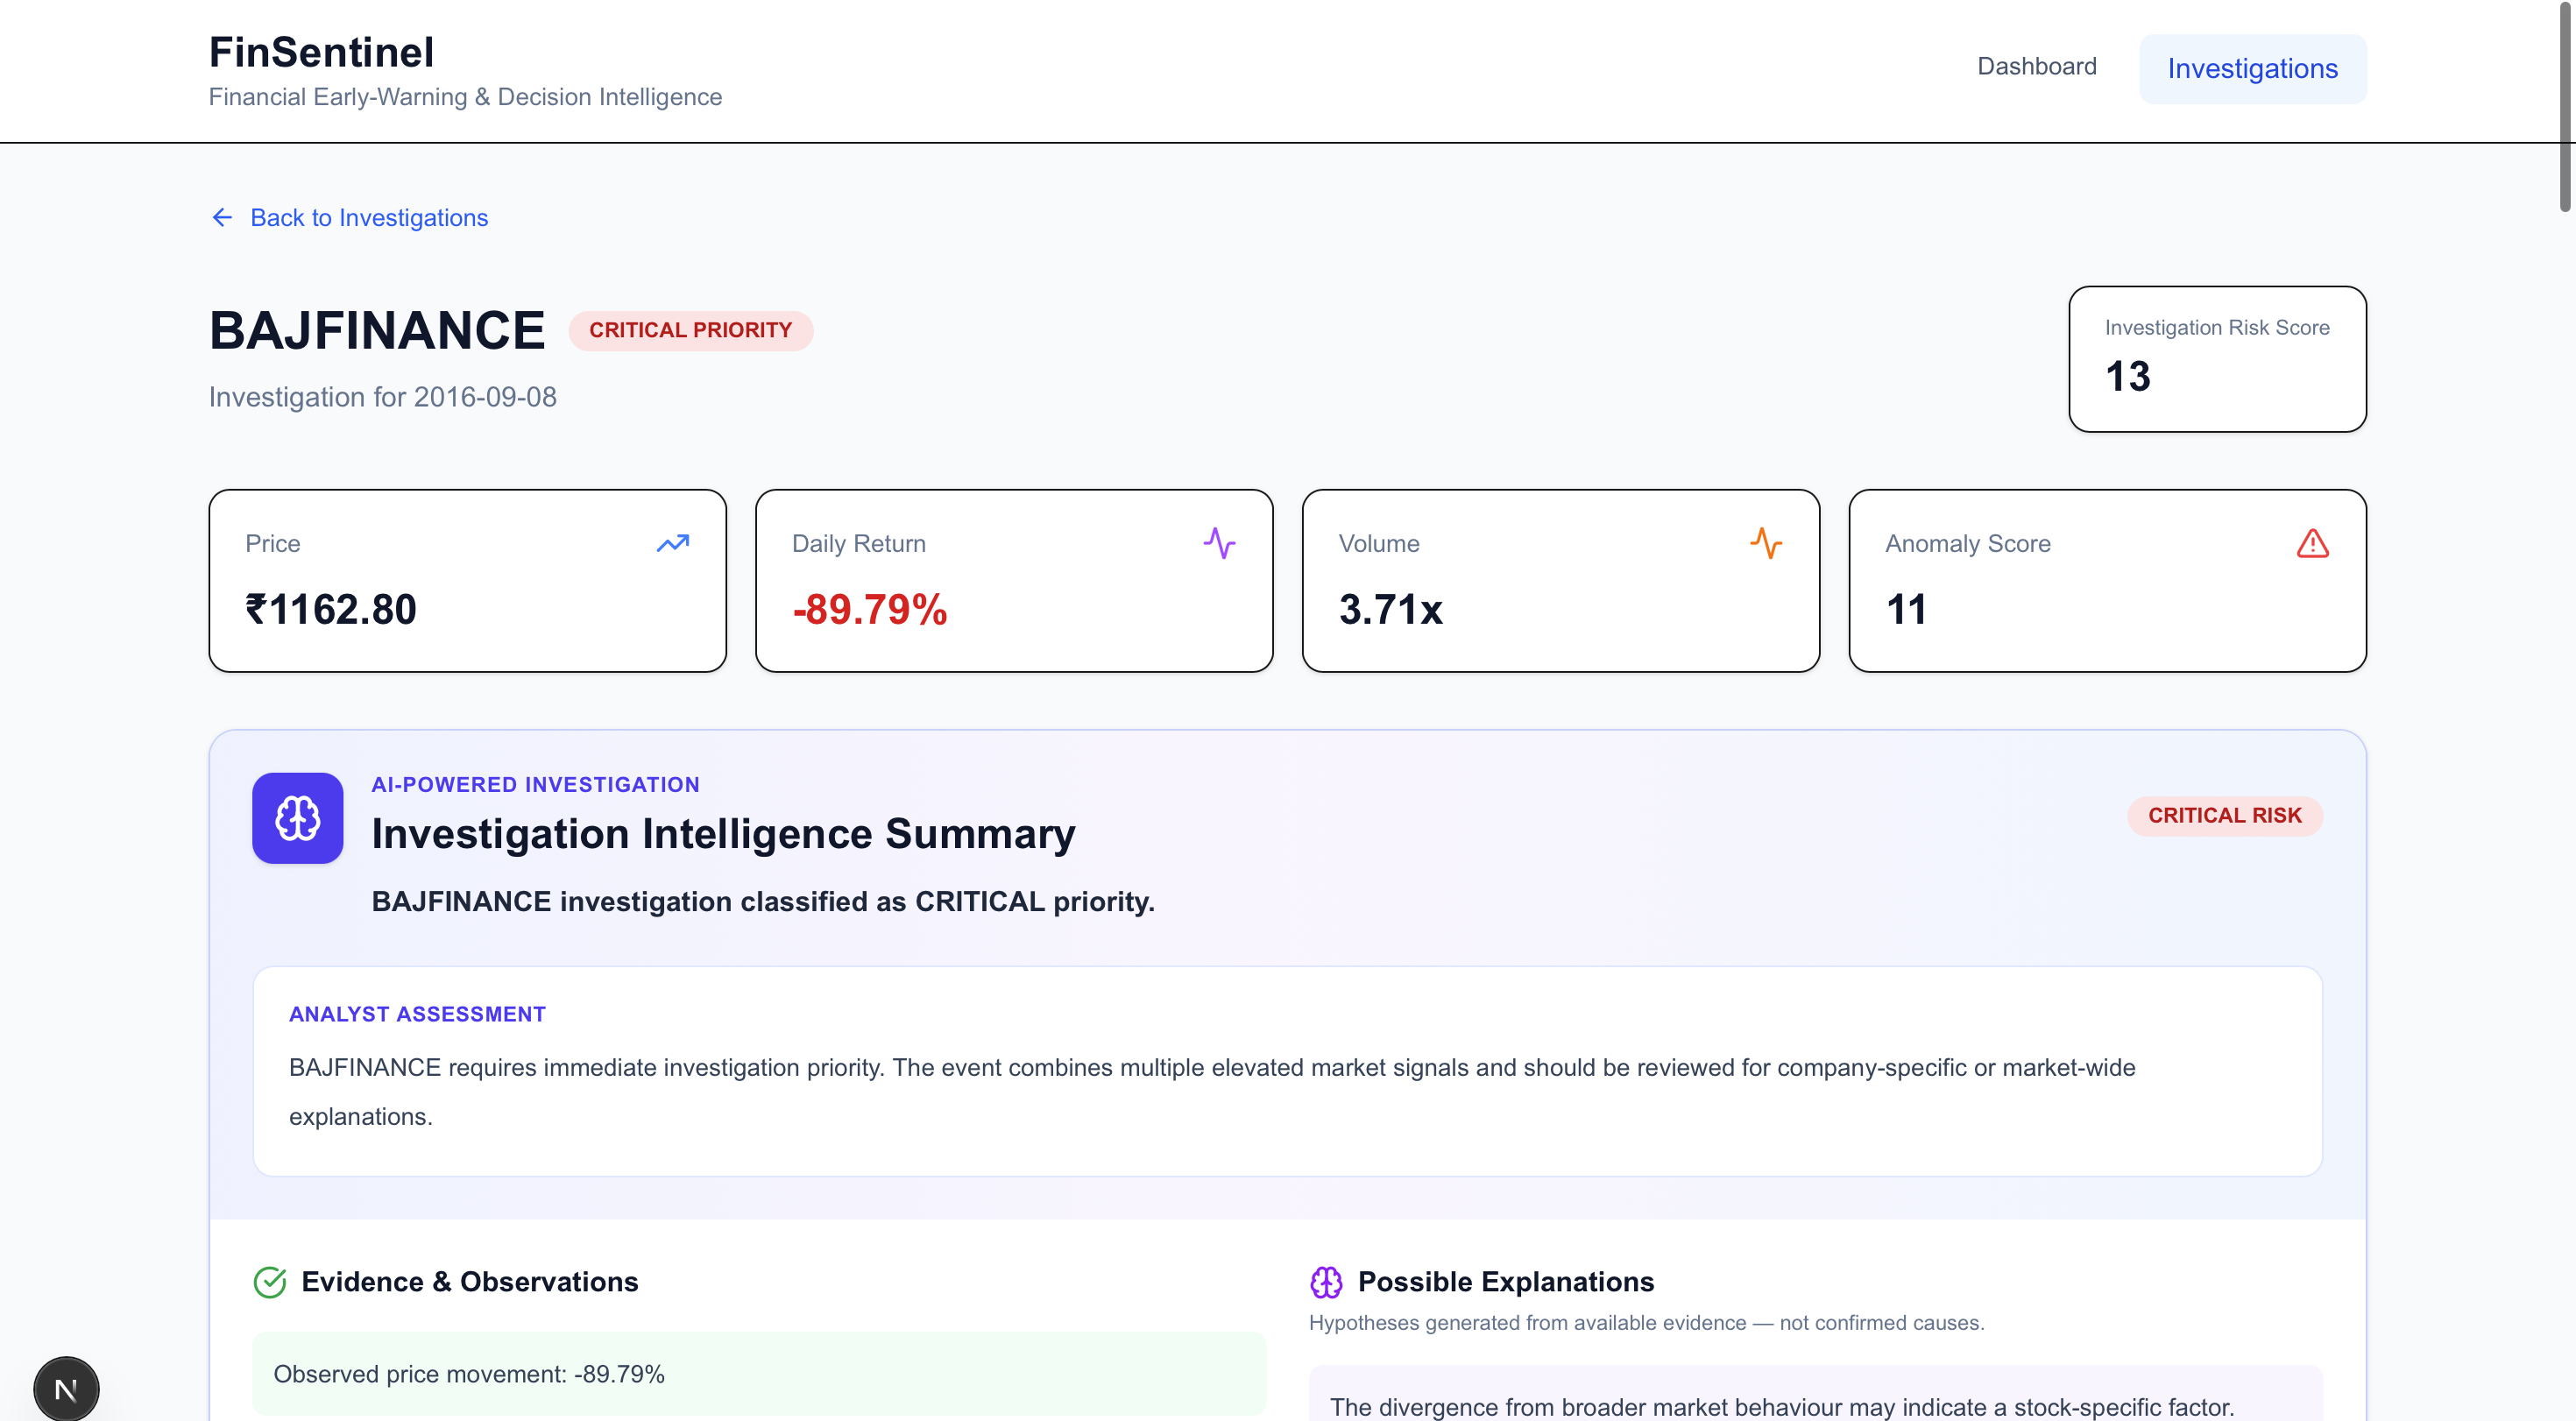
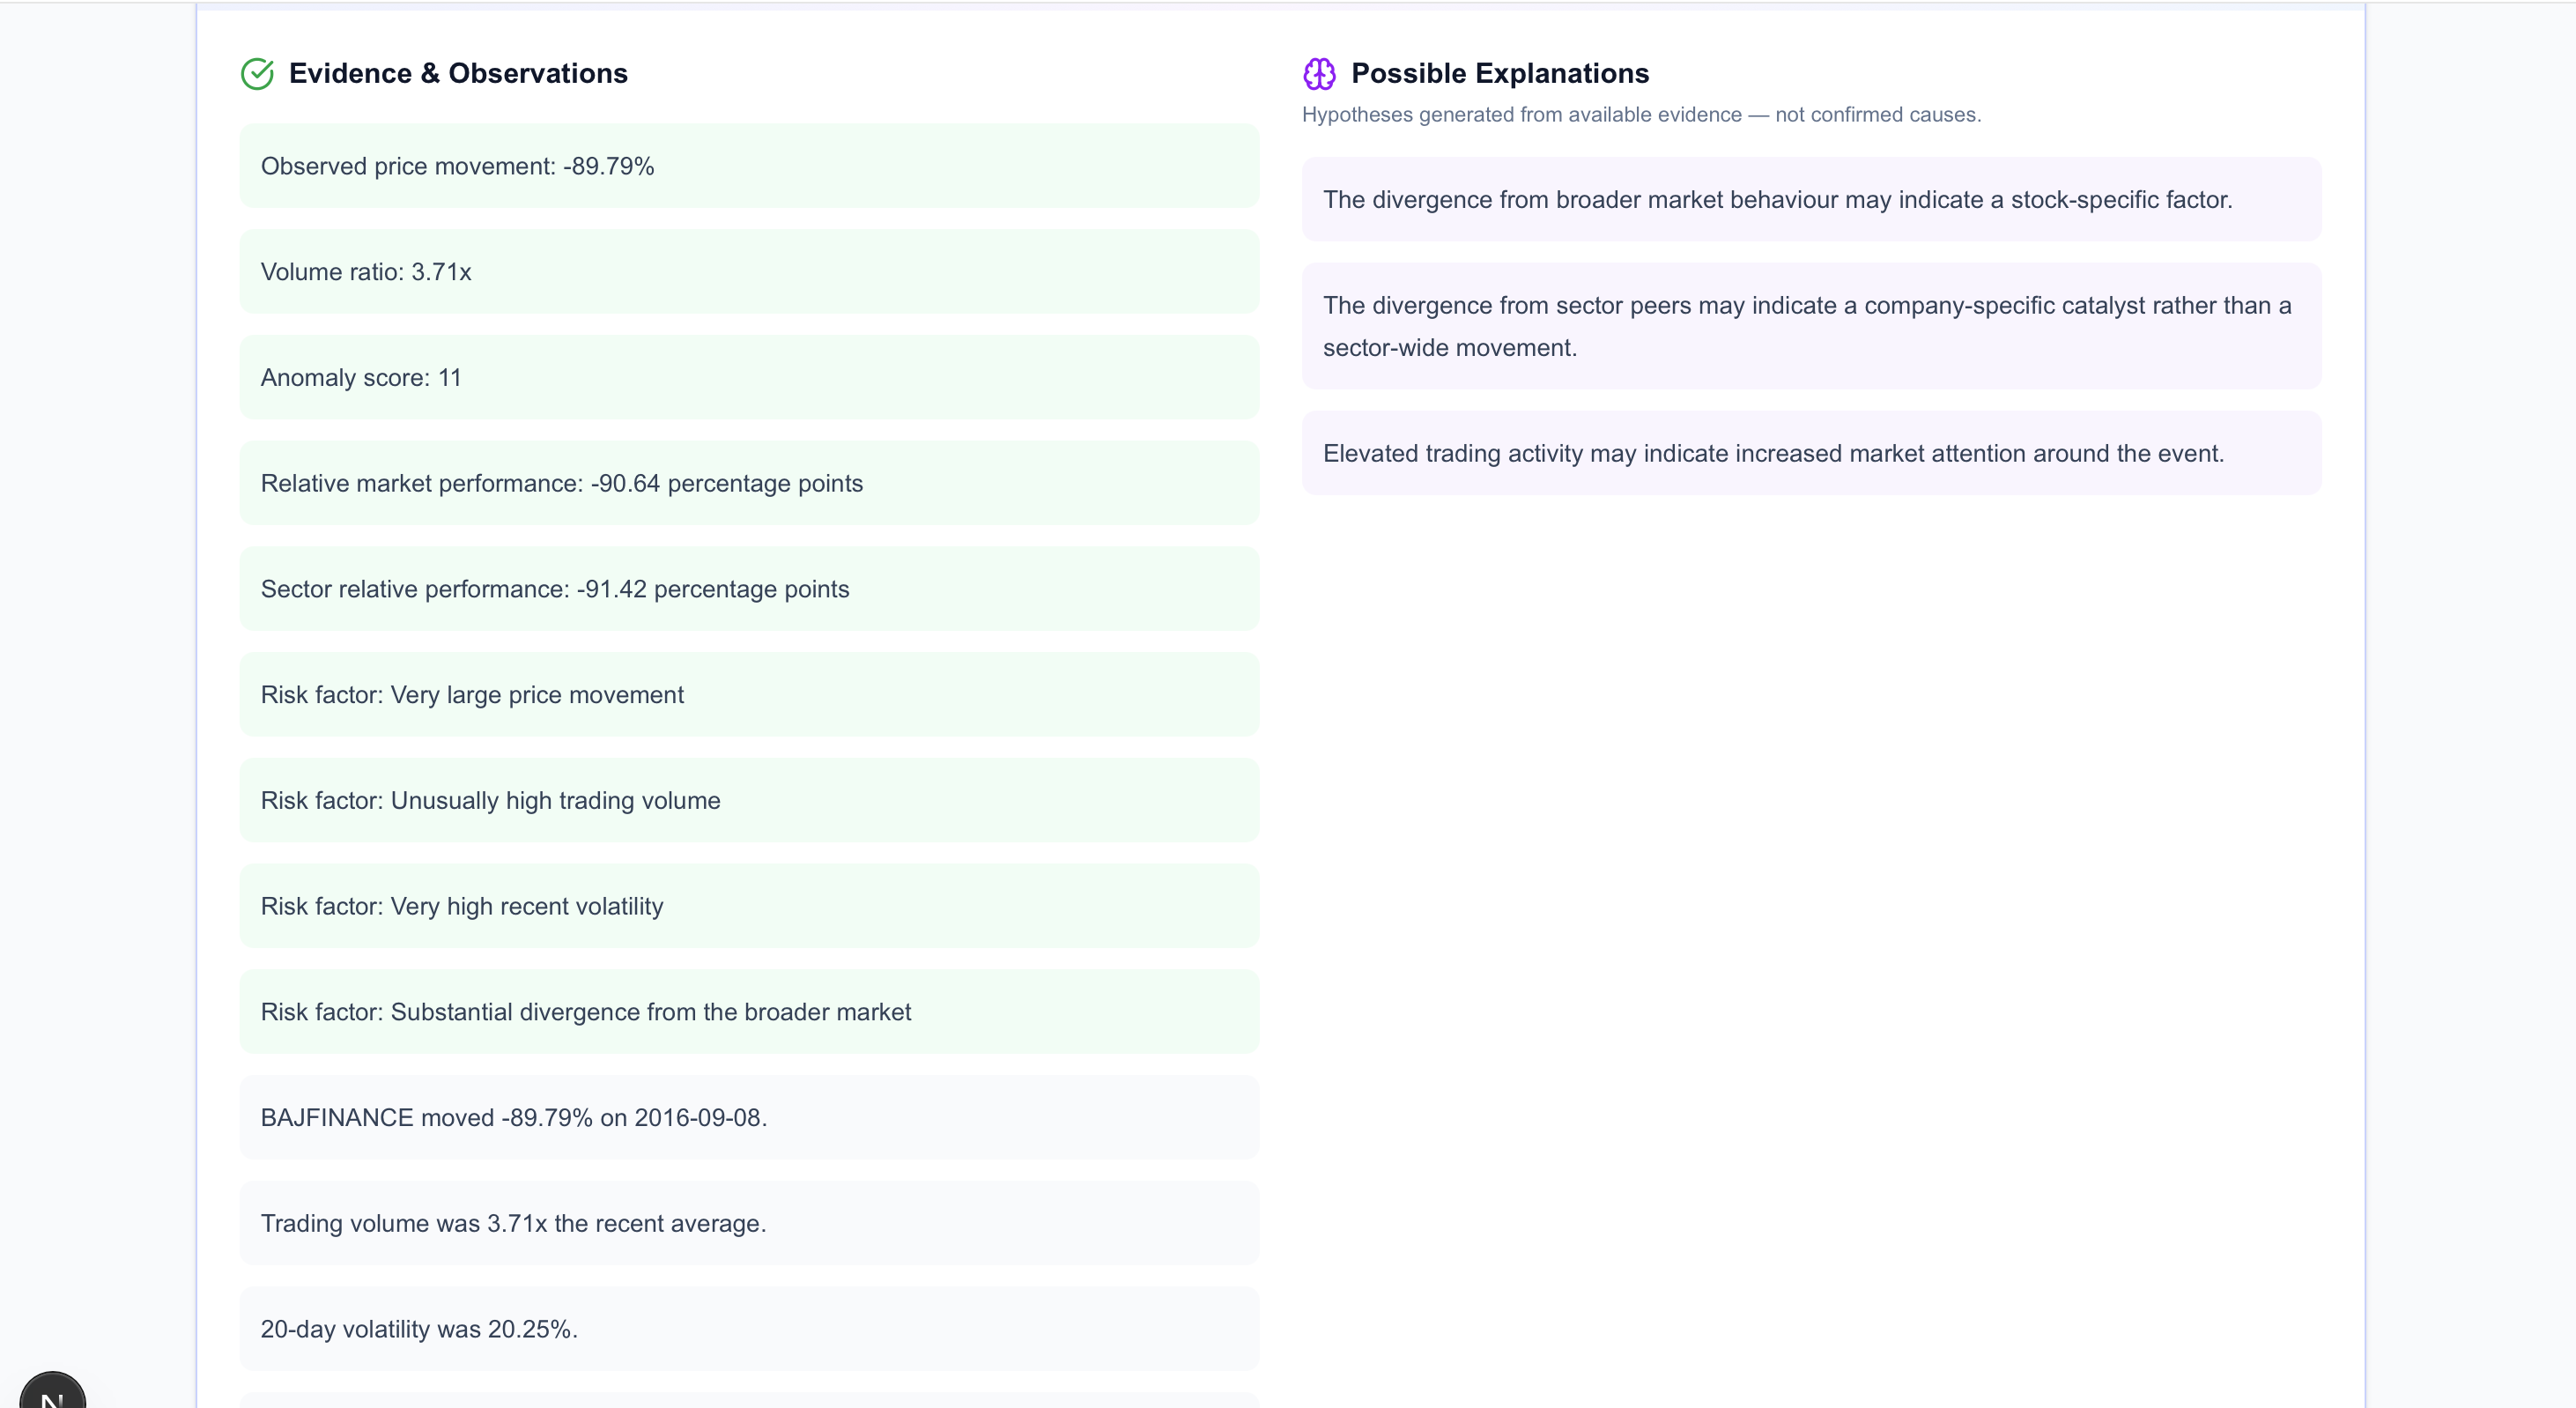
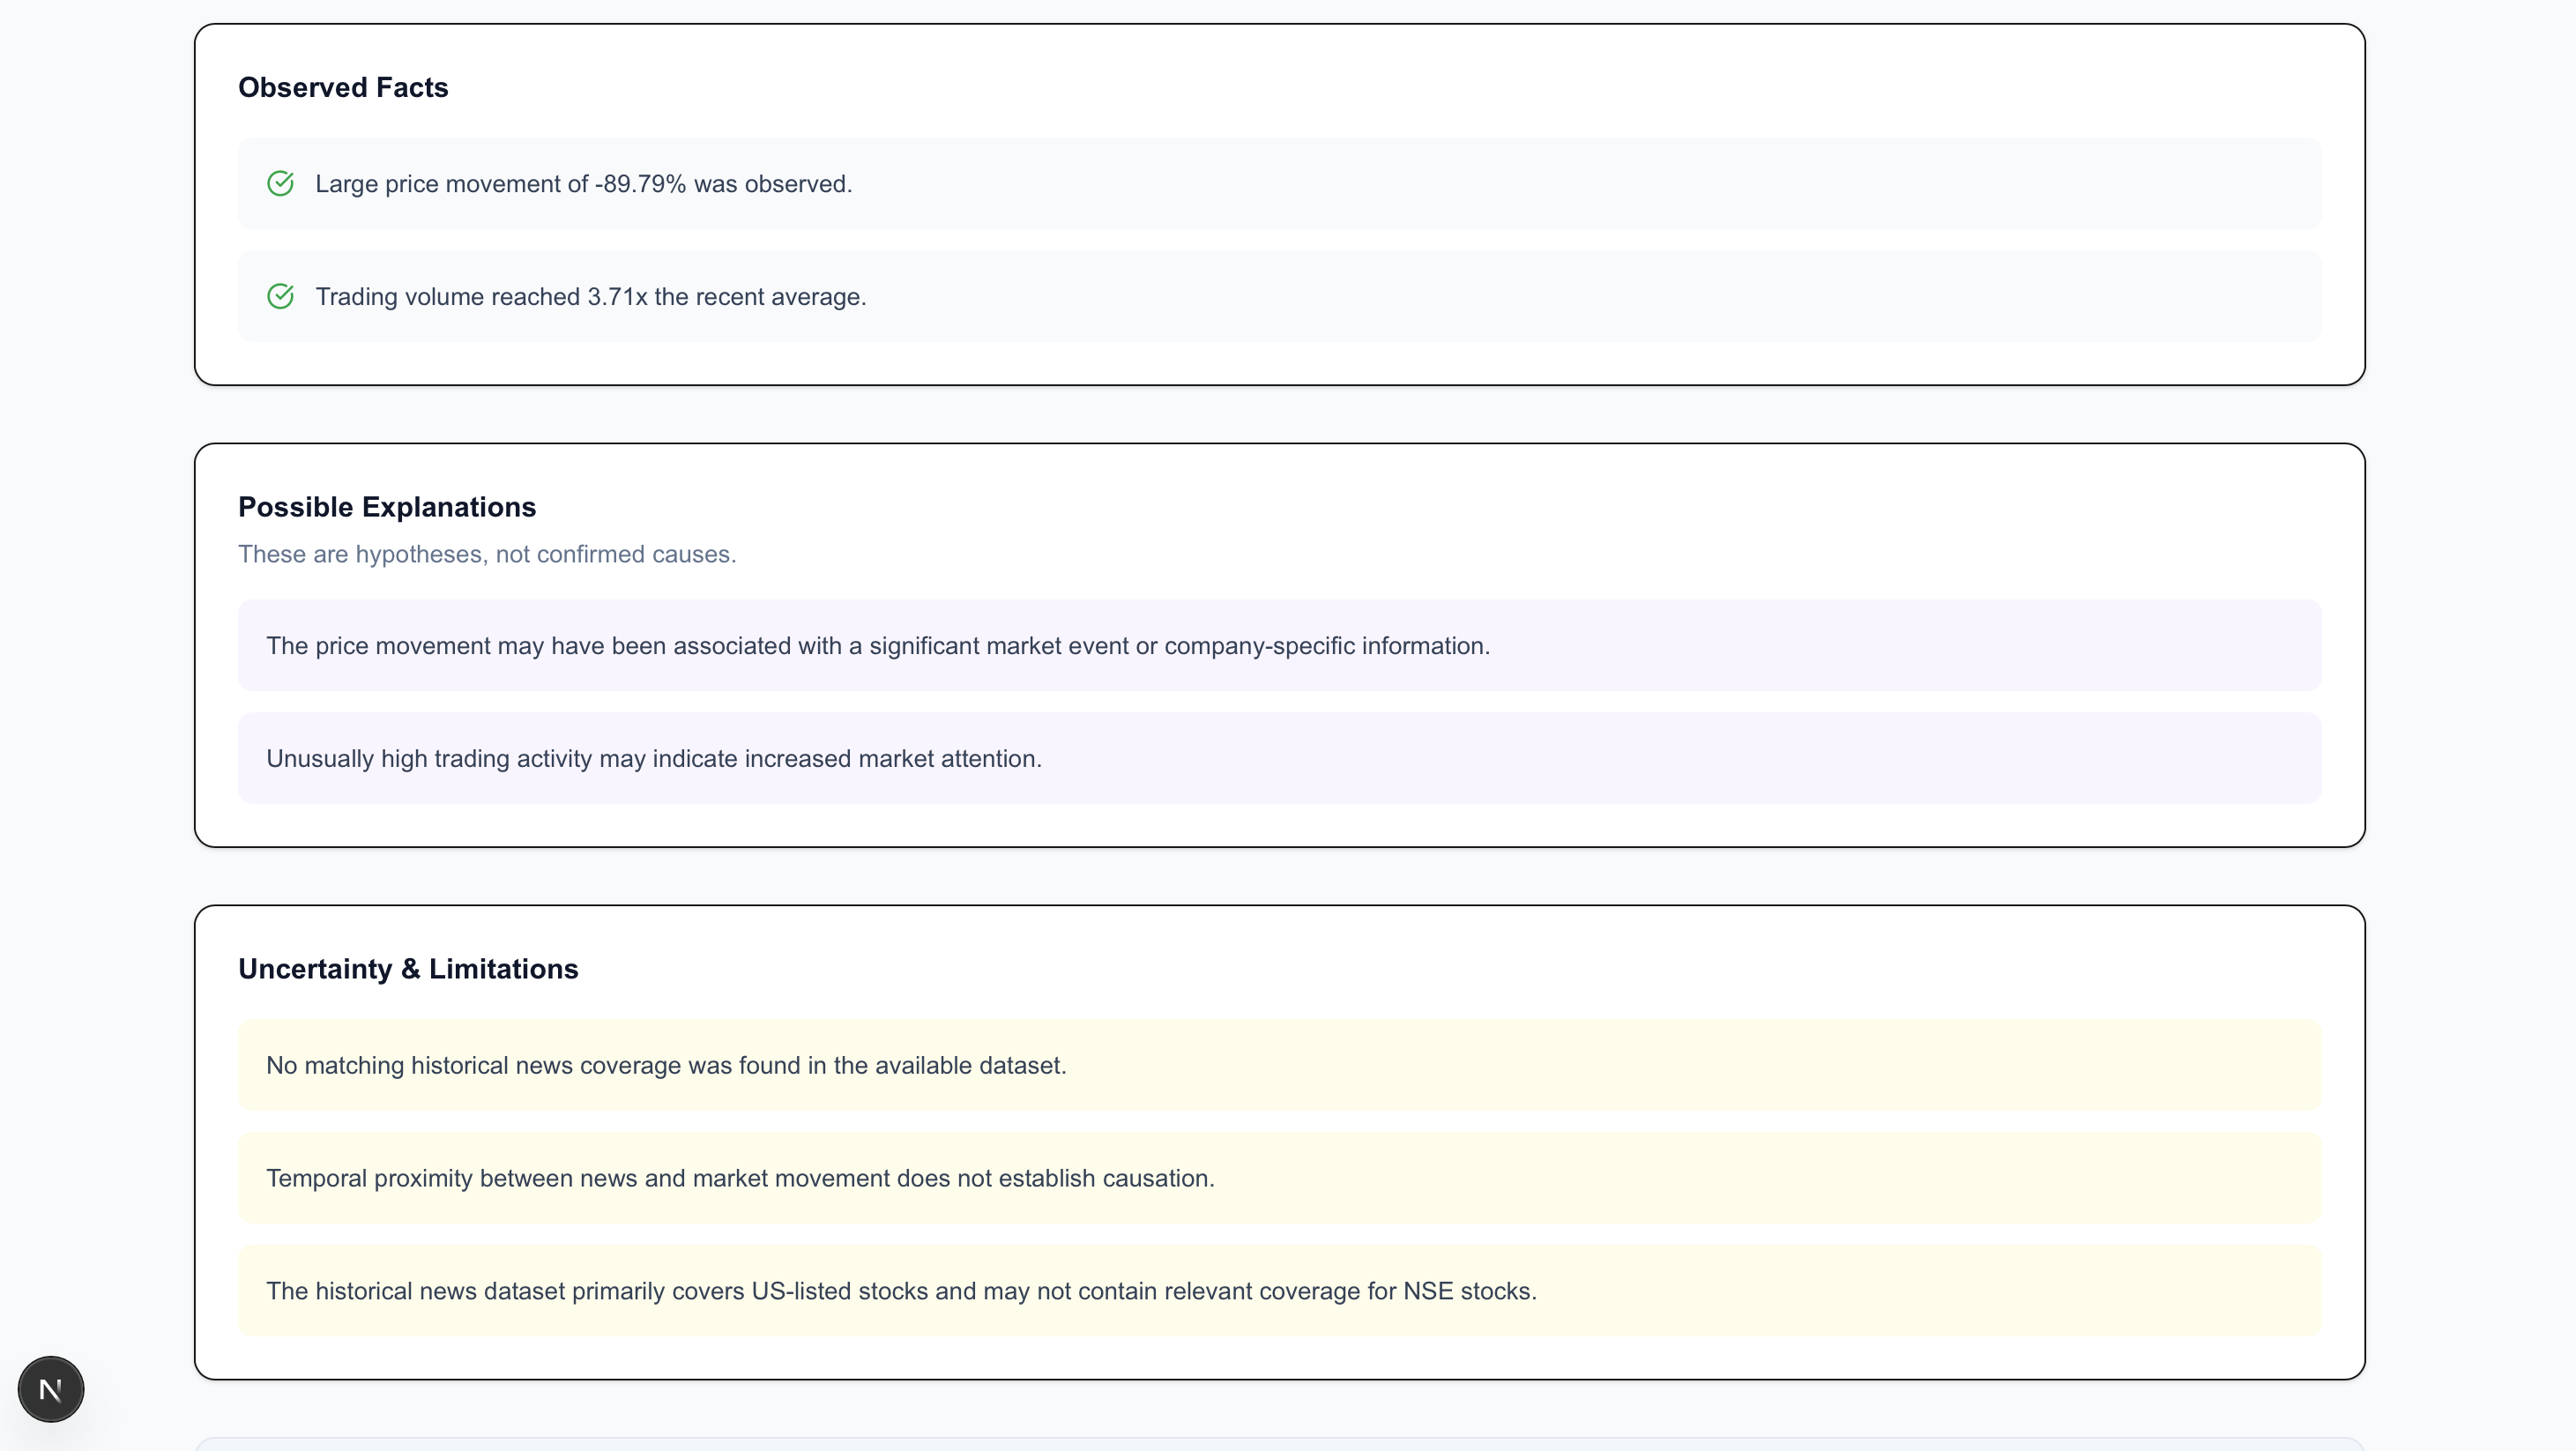
The final investigation report separates observed facts from possible explanations, highlights data limitations, and recommends practical next steps for further investigation.
How We Built It
Our backend uses Python, Pandas, and NumPy for data processing, financial feature engineering, and transparent rule-based anomaly detection. FastAPI connects the analysis modules to the frontend, while Next.js, TypeScript, Tailwind CSS, and Recharts power the interactive dashboard.
We used historical market data and a historical financial-news dataset to build and test the investigation workflow. The system combines measurable market signals with available news and market context rather than assuming that a nearby news headline caused a price movement.
Challenges We Faced
One major challenge was making the analysis reliable across a large historical dataset. We had to handle missing values, normalize stock symbols, calculate rolling financial indicators, and tune anomaly thresholds to identify meaningful events without relying on arbitrary assumptions.
Integrating the backend with the dashboard presented another challenge: API response structures and frontend state had to remain consistent for metrics to display correctly. We also encountered limitations when matching NSE stocks with historical news data that primarily covers US-listed companies. Rather than inventing missing evidence, FinSentinel reports when relevant coverage or sector comparisons are unavailable.
What We Learned
Building FinSentinel taught us that financial intelligence is not just about detecting patterns. It also requires context, transparent reasoning, careful data handling, and honest communication of uncertainty.
We learned how to integrate data processing, modular investigation agents, REST APIs, and an interactive frontend into one end-to-end application. Most importantly, we learned to distinguish correlation from causation and historical analysis from prediction.
FinSentinel's mission is simple: detect the anomaly, understand the risk, and give analysts clearer evidence for their next investigation.
Built With
- anomaly-detection
- data-visualization
- fastapi
- financial-analytics
- historical-market-data
- lucide-react
- multi-agent-systems
- news
- next.js
- nse
- numpy
- pandas
- python
- react
- recharts
- rest-api
- risk-analysis
- tailwind-css
- time-series-analysis
- typescript

Log in or sign up for Devpost to join the conversation.