Problem
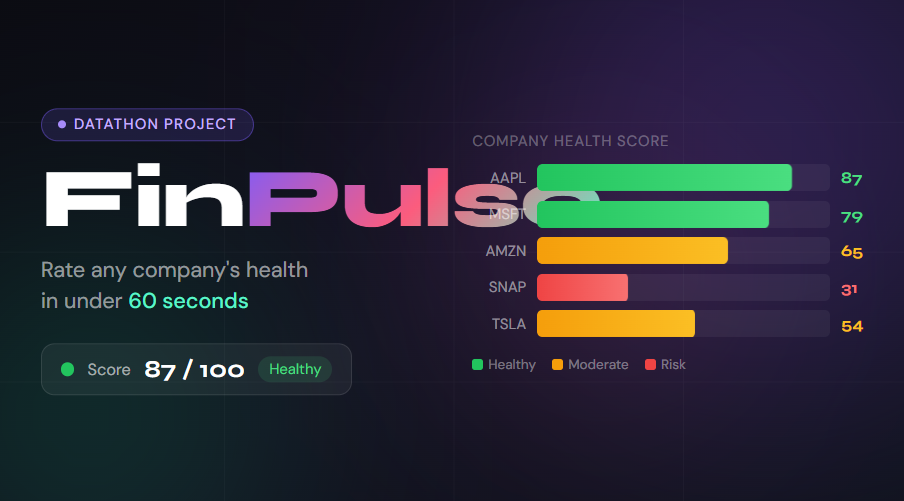
Every day, millions of students and retail investors make financial decisions without truly understanding a company's health. Reading balance sheets, income statements, and financial ratios requires expertise that most people simply don't have — leading to poor investment choices, missed opportunities, and unnecessary risk. There is no simple, unified way to quickly assess whether a company is financially strong or heading toward trouble. Existing tools are either too complex, too expensive, or designed only for professional analysts. FinPulse solves this by converting four key financial metrics into a single, easy-to-understand Health Score from 0 to 100 — making company analysis accessible to everyone, not just Wall Street.
Solution
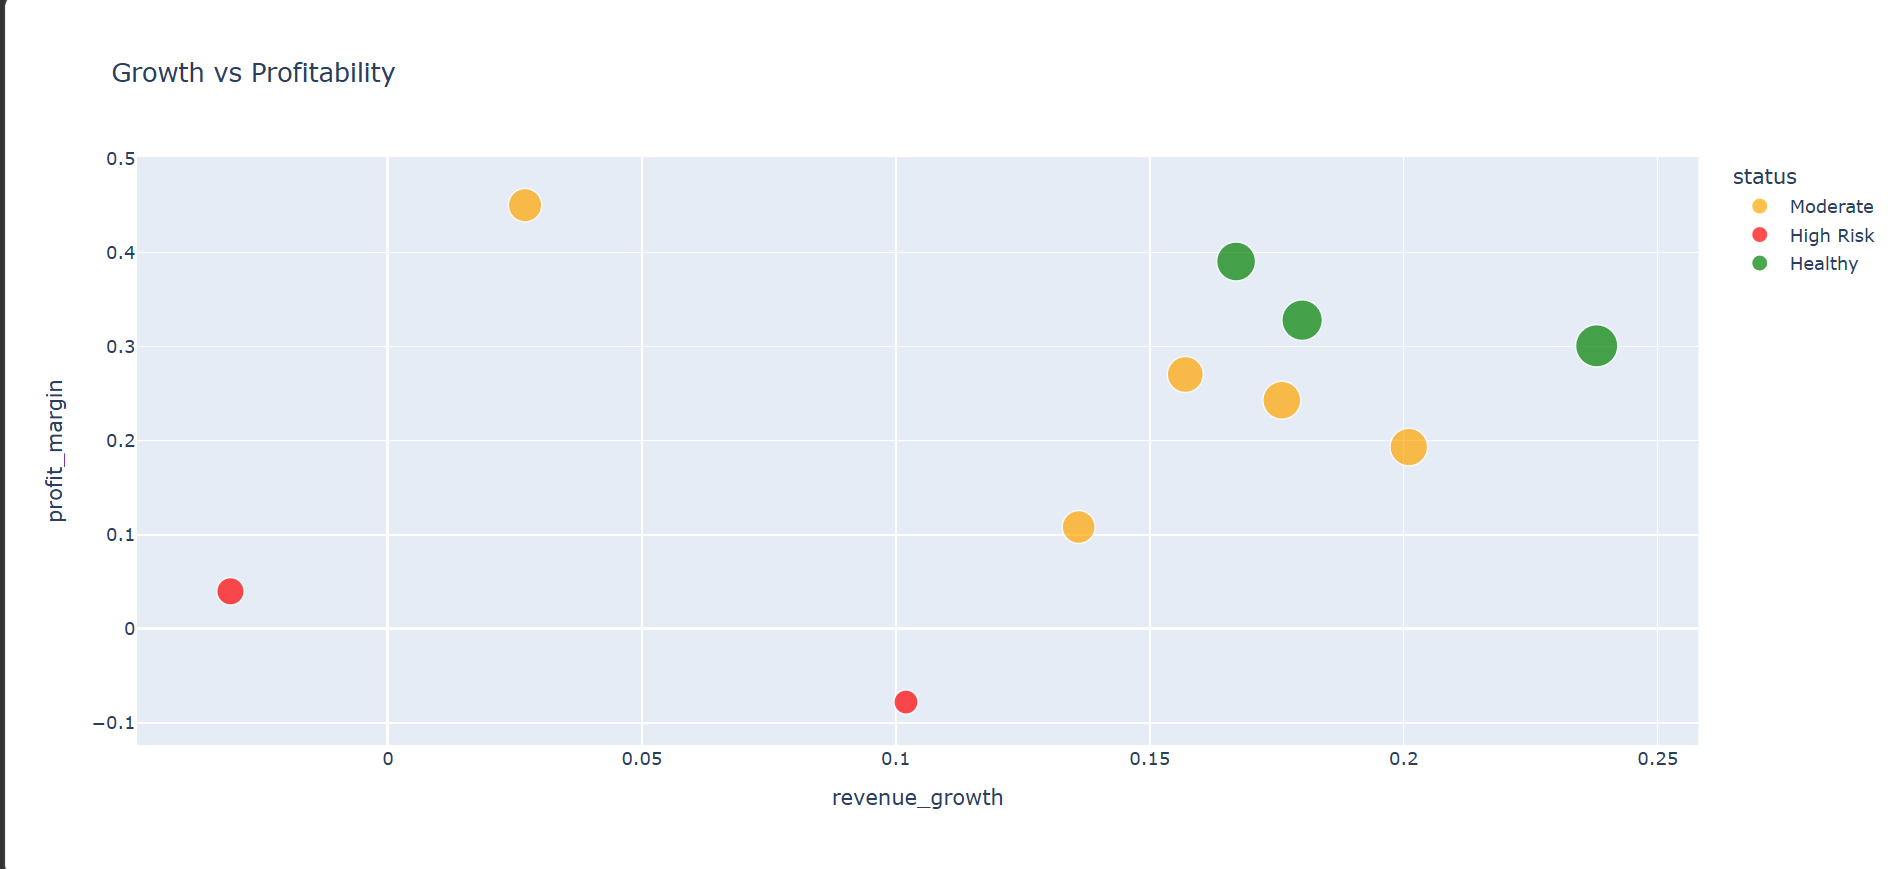
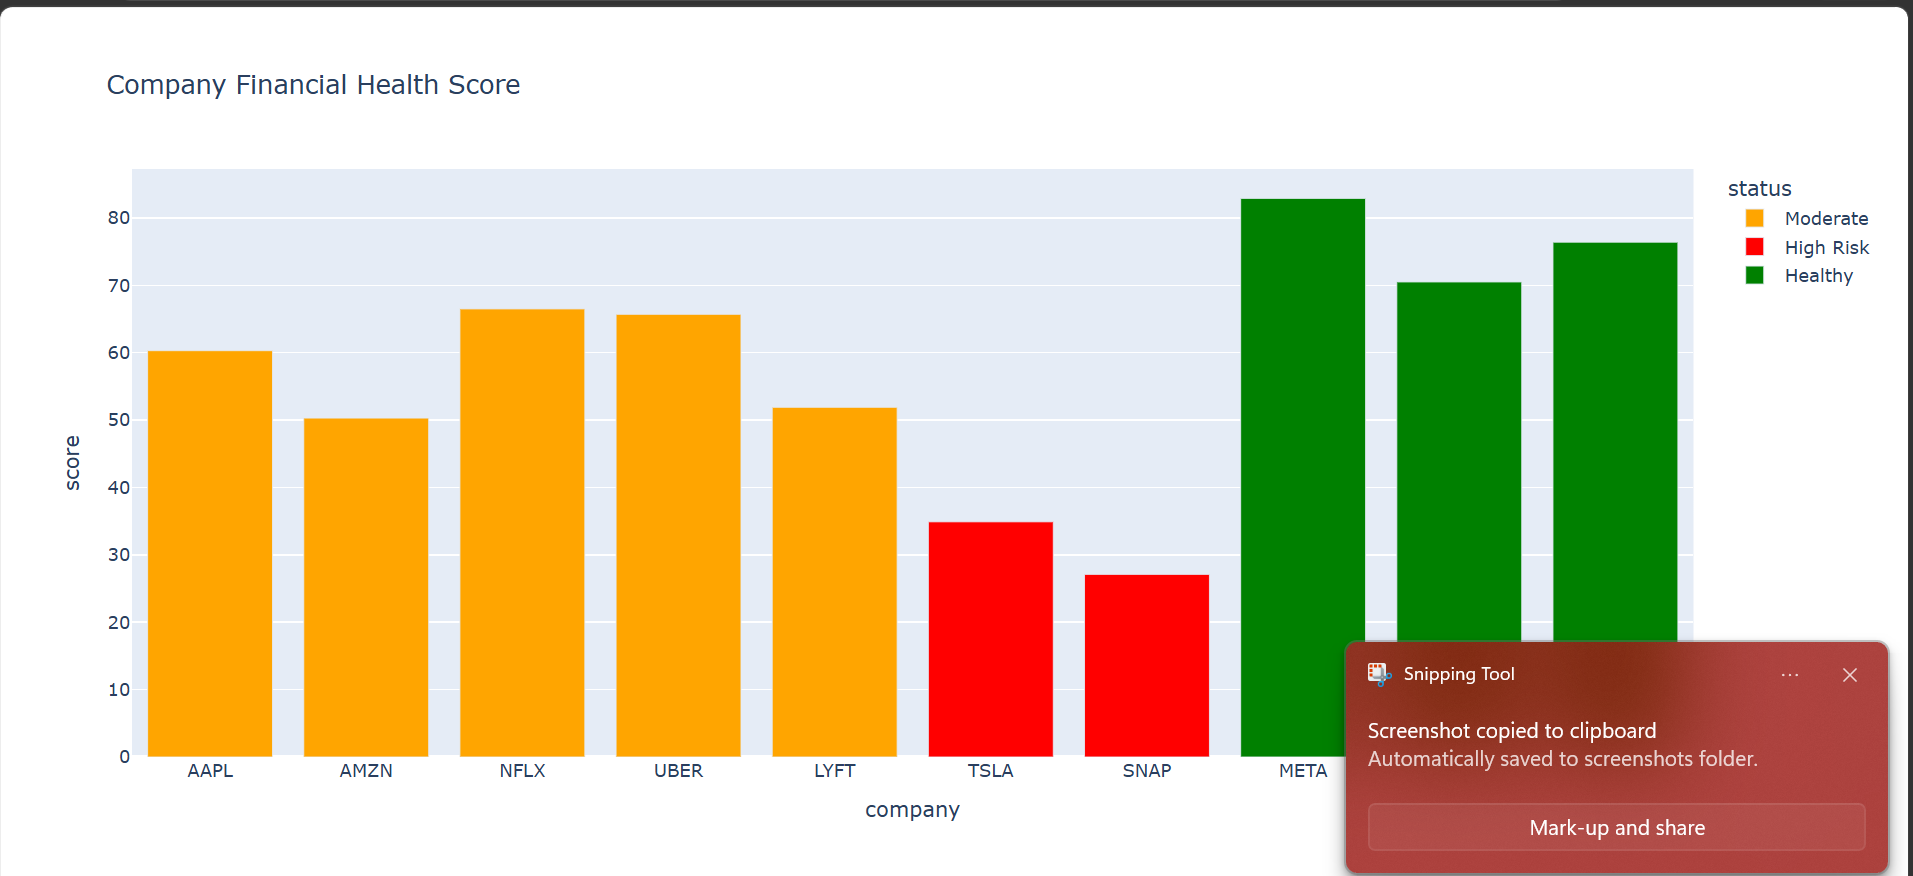
FinPulse is a Python-based financial health analyzer that fetches real-time company data and calculates a 0–100 Health Score using four key metrics — Profit Margin, Revenue Growth, Debt-to-Equity Ratio, and Current Ratio. Companies are automatically classified into three categories — Healthy 🟢, Moderate ⚠️, and High Risk 🔴 — and visualized through interactive charts, making financial analysis fast, simple, and accessible for everyone.
How it works
1) Fetches live financial data for any public company using Yahoo Finance API 2)Calculates a weighted Health Score across 4 critical financial metrics 3)Visualizes results as interactive color-coded charts for instant insight
How we build
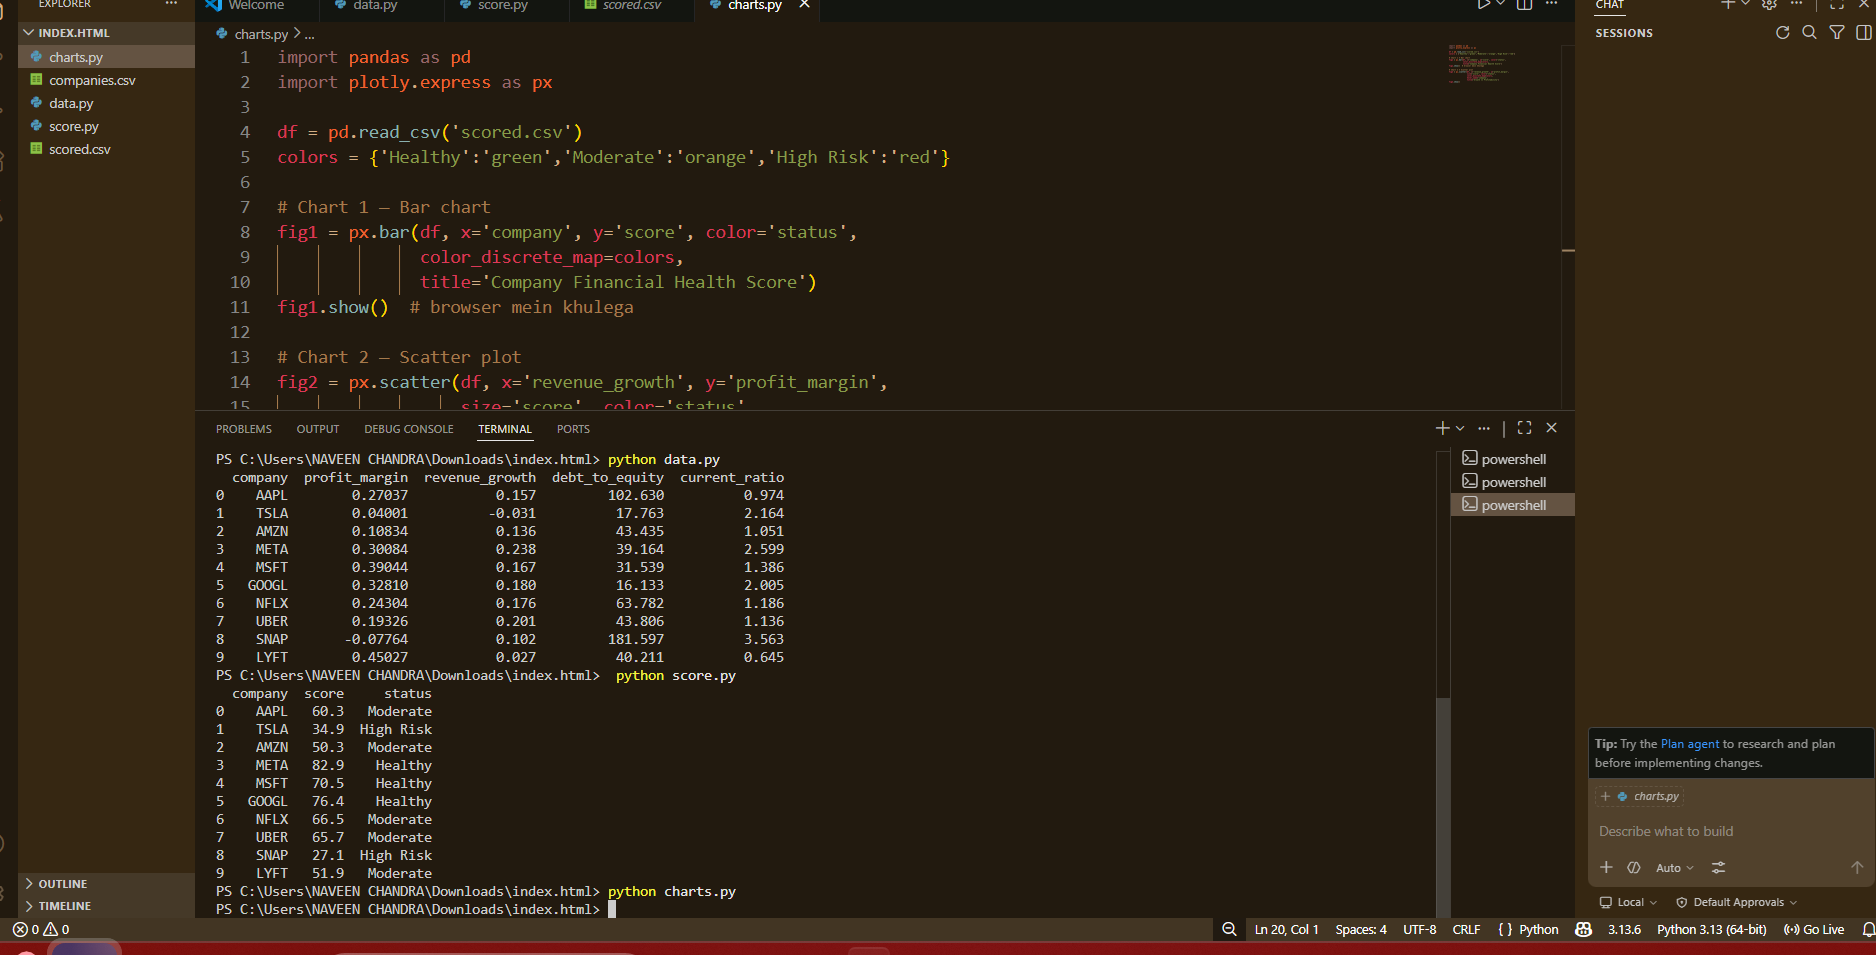
Python — core language yFinance API — fetched real-time financial data of 10 companies Pandas — data cleaning and score calculation Plotly — built interactive visual charts VS Code

Log in or sign up for Devpost to join the conversation.