Our group was immediately interested in working with financial data when we saw FINRA at the sponsor presentations during the opening ceremony. None of us had ever worked with financial data in a setting like this before, so we thought that it would be an interesting and challenging project for the four of us.
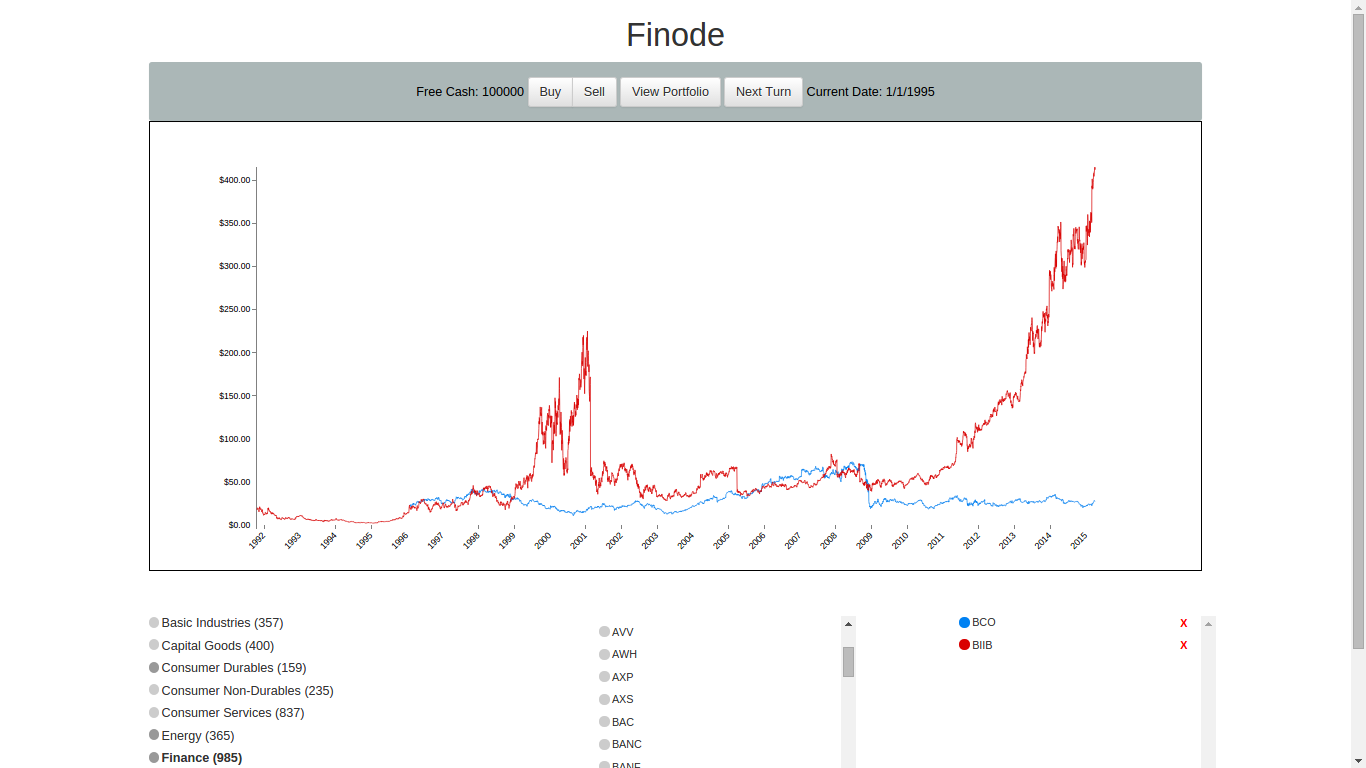
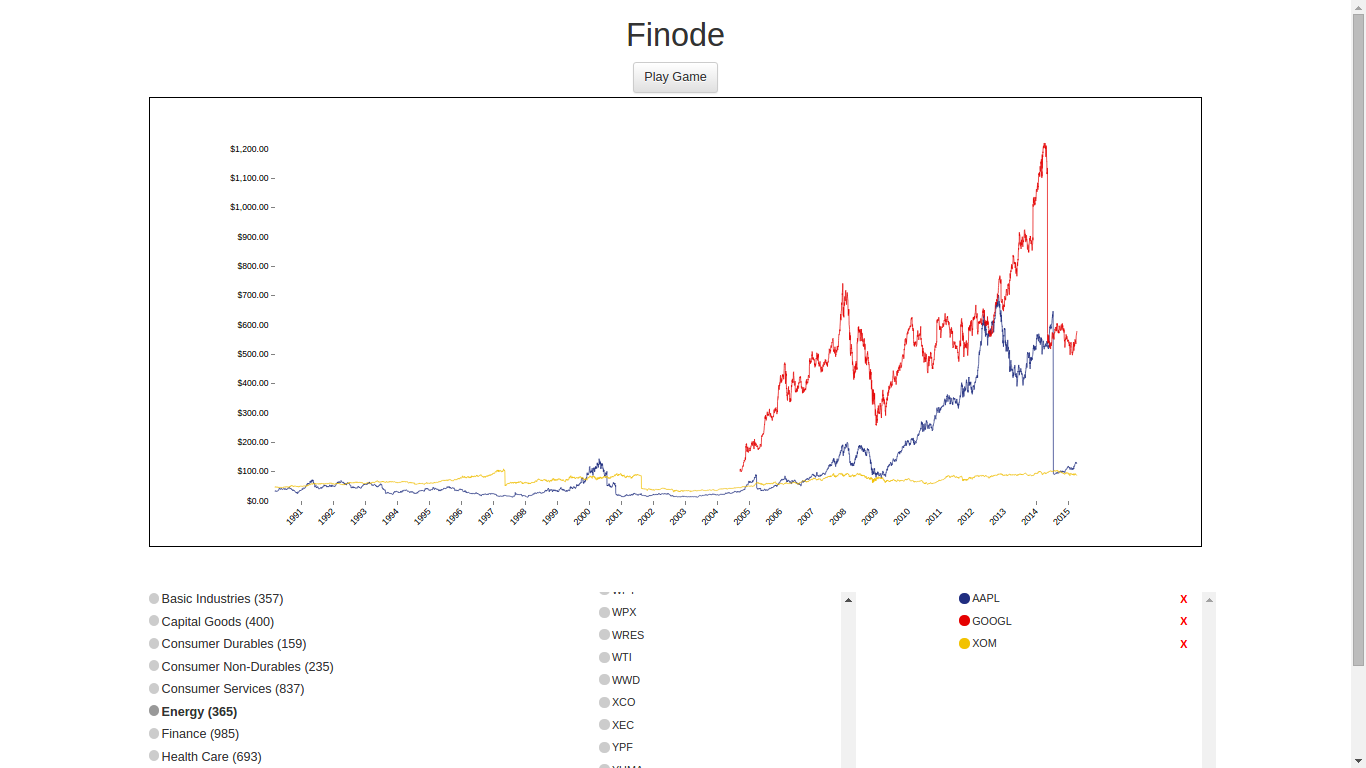
Finode is a webapp that acts as a visualization tool for stock trading data from the past twenty years which was provided by FINRA. In addition to the centerpiece visualization capabilities, Finode features a stock trading game, which allows the player to select a sector of the economy to trade in and take them through time starting in approximately 1995, allowing them to buy, sell, and hold stocks as they please.
Finode was built primarily using Flask, D3.js, and MySQL, along with other front-end technologies.
One of the largest issues our team face while developing Finode was the sheer amount of data provided by FINRA. None of us had ever worked with a dataset this large before, so it was a new challenge to interpret. In addition to this, D3.js has quite a steep learning curve, so it was a challenge to properly utilize this technology in such a short period of of time.
As a team we are both proud of the effort we put into this project as well as the quality of the result. Since most of us had never worked on a project like this, we all put our full effort into this project, and in the end we produced a produced
While working on Finode, we primarily learned more about managing and interpreting large sums of data using technologies like MySQL, we explored data visualization technologies, specifically D3.js, and furthered our front-end development skills.
Next steps for Finode could include support for financial data from other institutions/different applications, expansion of the webapp to support more advanced gameplay, and possibly even trading bots designed to buy and sell stocks for the highest net gain.

Log in or sign up for Devpost to join the conversation.