Inspiration
"Beyond the Feed" made us think about technology beyond a screen. Algorithms decide what we see online. We wanted computer vision doing something useful in the physical world instead.
Parking was the obvious target. Lots already have capacity. They already have cameras. What nobody has is an answer to the only question a driver actually asks, which is where the free space is. So people circle, the lot jams, everyone arrives late. The hardware to fix this is already bolted to the light poles. Nobody reads it.
What it does
FindMySpot turns one fixed camera into a live map of a parking lot.
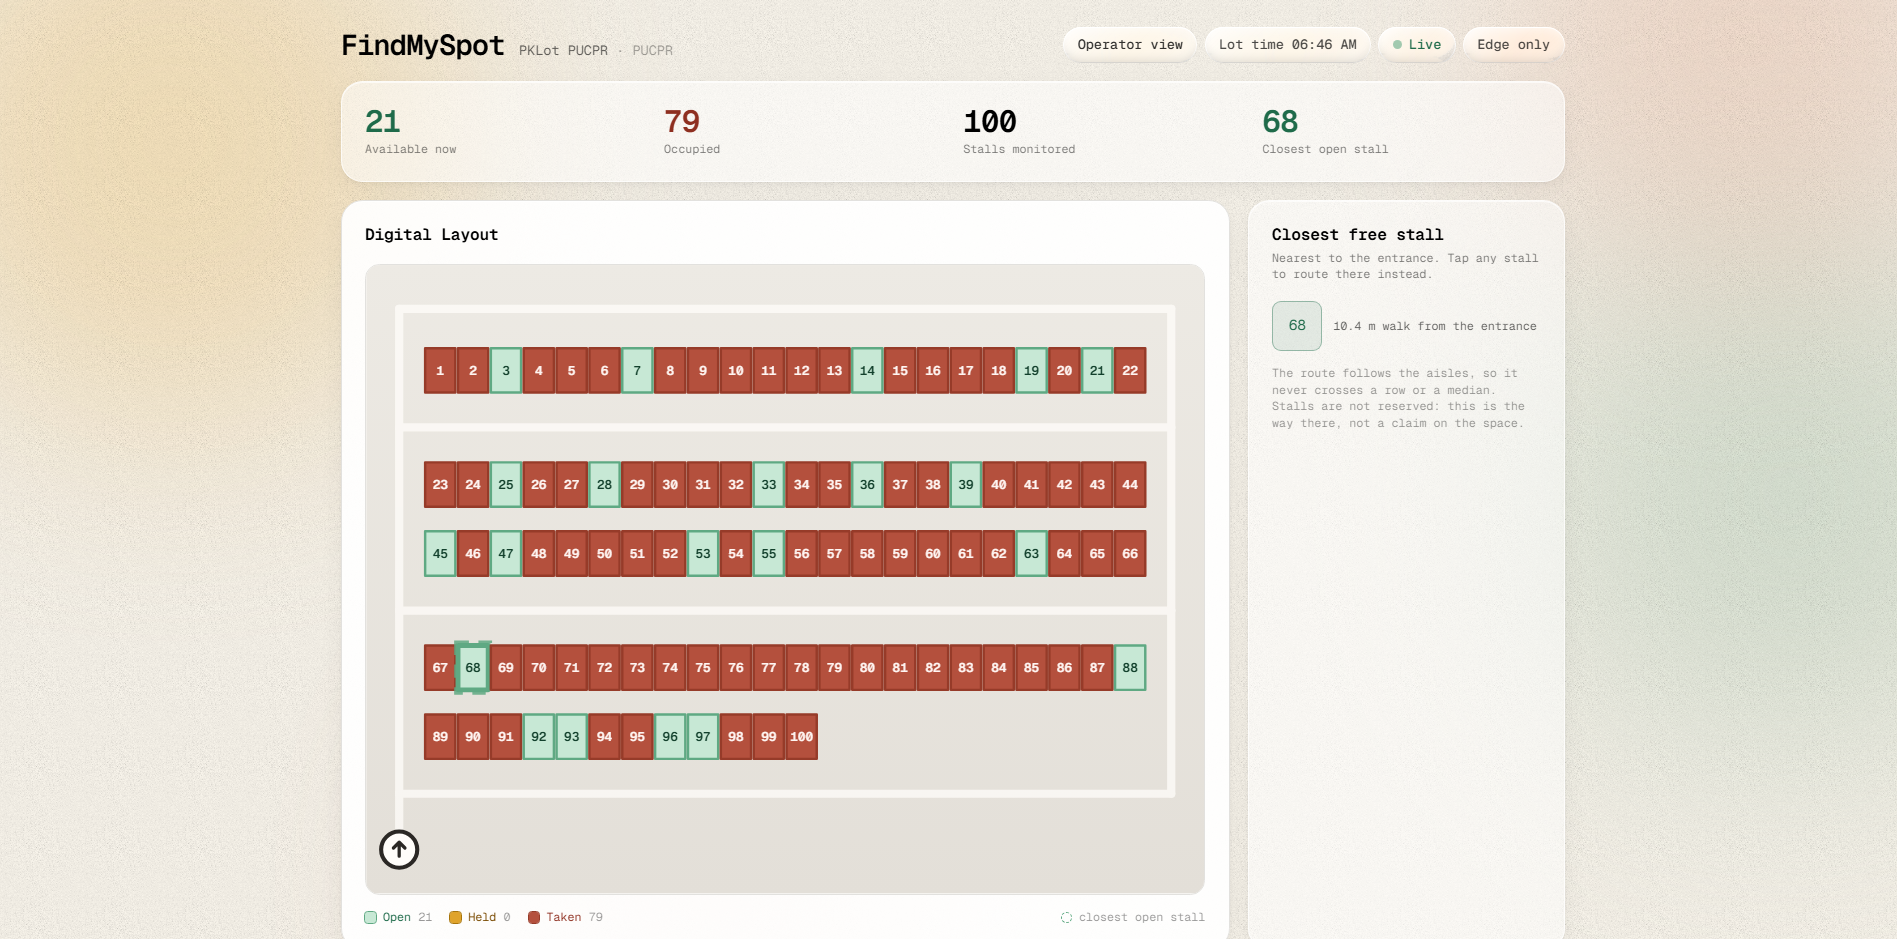
A driver gets a top-down map of every stall. Green is open, red is taken, and it updates as the lot changes. Click a free stall and it draws the route there along the lot's real driving lanes.
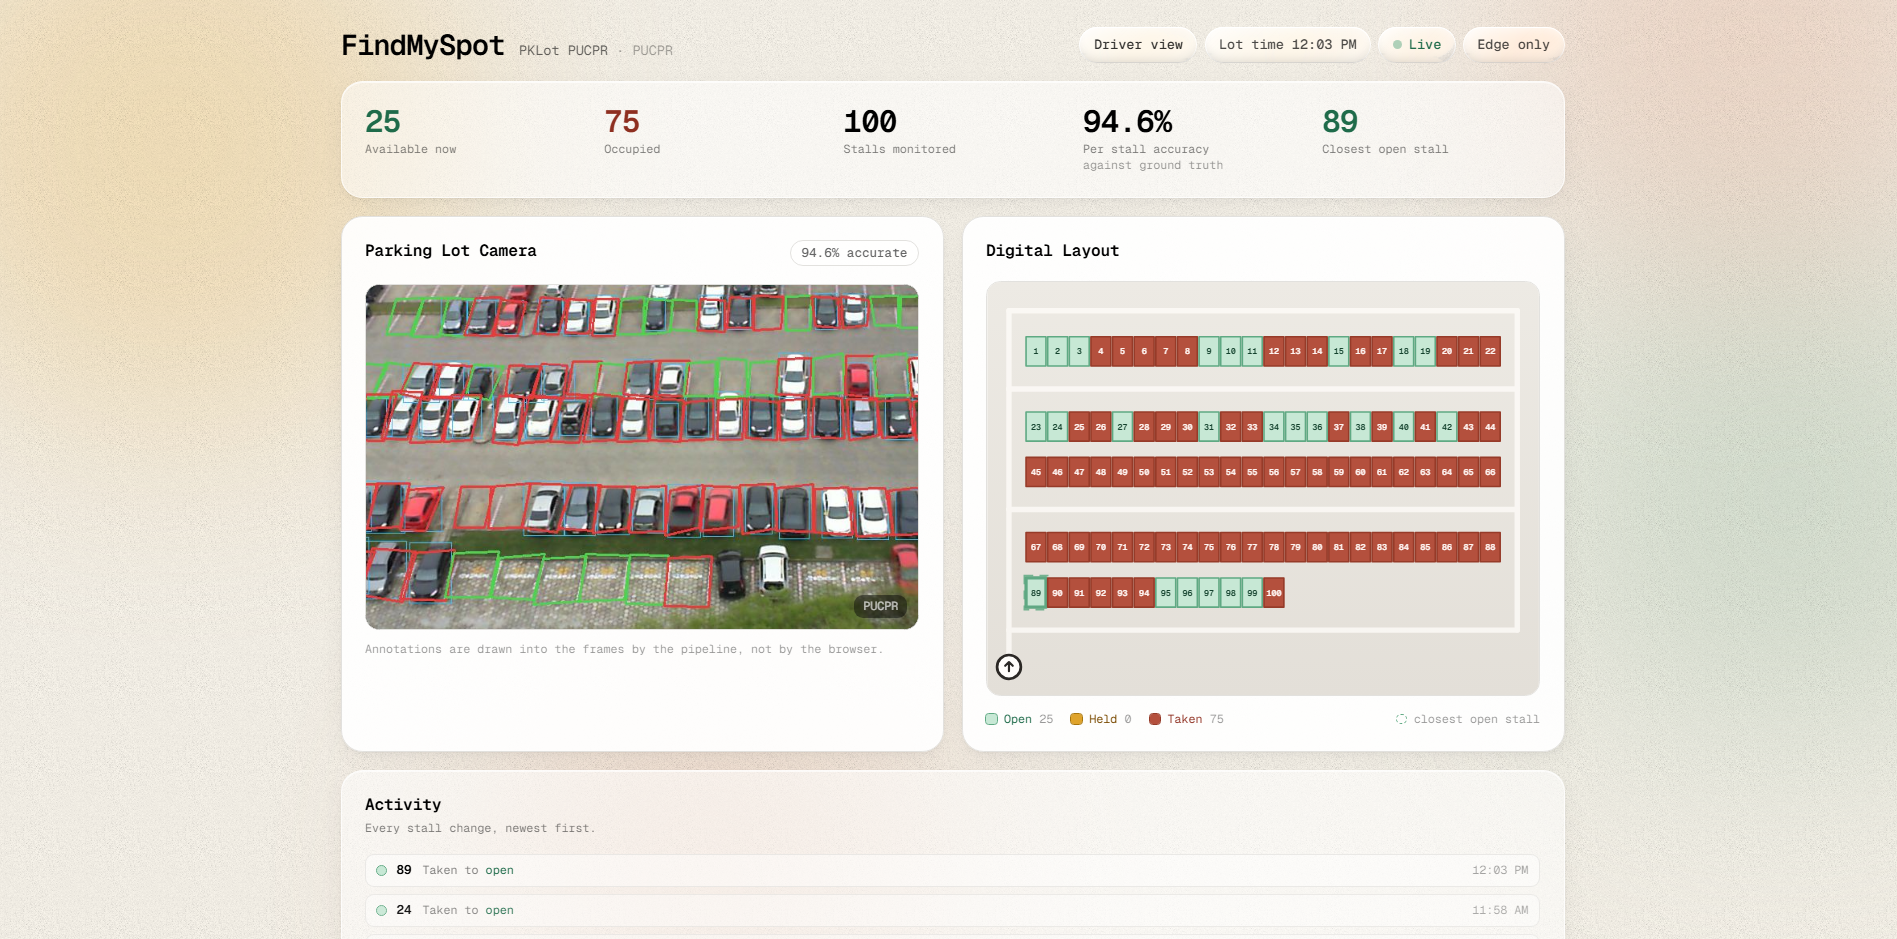
An operator gets something different: the camera feed with detections and stall outlines drawn on it, a live accuracy readout, and the usage history the lot never had before. Occupancy over time, when it peaks, how fast stalls turn over.
Those are two separate views on purpose. The driver view carries no camera feed at all. Streaming footage of a car park to every user would contradict the thing this whole product rests on, which is that only occupancy state ever leaves the machine doing the processing. No faces, no plates, nothing kept. The footage exists so an operator can check the detector is behaving. That is the only reason it exists.
How we built it
One Python process handles replay, inference, state, the API, the MJPEG stream and the WebSocket. No microservices. No queue.
Detection is COCO-pretrained YOLO11m at 1920px, with no training and no fine-tuning. For occupancy we intersect each detection box with each annotated stall polygon, call the stall taken when a box covers at least 35% of it, then debounce across consecutive frames so nothing flickers.
The map comes from the lot's real row structure, normalised so every stall draws the same size and rows stack evenly. Routing runs over a lane graph built from the gaps between rows. We tell grass from tarmac by sampling the actual frame.
Storage is TimescaleDB, one row per state change and never one per frame. A continuous aggregate buckets those into the occupancy curve the analytics panel draws.
The frontend is React, TypeScript, Vite and Tailwind. The map is hand-drawn SVG, with no chart library and no map library.
The demo runs on PKLot, an academic benchmark of fixed-camera parking footage that ships per-space polygons and occupied or vacant ground truth. That was deliberate. It means the accuracy number in the UI is measured against ground truth instead of asserted.
Challenges we ran into
The occupancy test we designed was wrong, and measuring is what caught it. The original plan took the bottom centre of each detection box and checked whether that point fell inside the stall polygon. It scored 74.9%. PKLot's stalls are angled and YOLO returns axis-aligned boxes, so the bottom centre of a diagonally parked car lands outside its own stall, usually out in the aisle. Some stalls were wrong in 30 frames out of 30. Not occlusion. Not a missed detection. Just a point landing a few pixels outside a rotated quad, every single time. Polygon overlap took it to 97.9% with zero false positives.
Small cars broke the small model. Our demo camera fits 100 stalls into one 1280x720 frame, so every car is tiny. A smaller detector at 1280px collapsed to 63%. YOLO11m at 1920px fixed it.
Transitions are not levels. The database stores state changes, so the continuous aggregate could tell us how many stalls filled and emptied in each bucket, but not how full the lot actually was. Those are different quantities. One is the derivative of the other. We ended up recording the occupancy level directly rather than trying to integrate the deltas back into a curve.
We also had to build in parallel on two machines. We froze a JSON schema first and worked against a mock of it, so the frontend never needed the vision pipeline running at all. Both halves met at the end and fit.
Accomplishments that we're proud of
The accuracy is measured, broken down by weather, and reported straight.
On the 100-stall camera in the demo we get 97.1% per-stall accuracy, with four false positives across 1,138 free stalls. A false positive is the expensive mistake here, because it sends a driver to a space that is already occupied. That is what we tuned against, rather than the headline number.
On a second, closer camera we measured by weather across 107 frames and 2,984 decisions. 97.7% in sun. 98.7% in cloud. 98.4% in rain, with three false positives in total. Rain scores slightly better than sun. Our best guess is that overcast light removes the hard shadows that blur a car's edge against the tarmac.
We are also happy with what we did not claim. PKLot has no night footage, so we say nothing about night.
What we learned
Measure the thing you already decided. The biggest single improvement in this project, 74.9% up to 97.9%, came from testing a design decision we had already written down as settled and finding it was the wrong shape for the data.
What's next for FindMySpot
Overlapping camera zones, so a view blocked by a van gets covered by another camera.
Automatic stall discovery, which removes the one-time setup a new camera needs today.
A real lot. The footage here is PKLot, filmed in Brazil, not the campus lot we would actually point this at. That was a time constraint, and we would rather say so than let anyone assume otherwise.
Tracks
[MLH] Best Use of Tiger Data
[MLH] Best Use of Vultr
Built With
- docker
- fastapi
- numpy
- opencv
- postgresql
- python
- react
- render
- tailwindcss
- tigercloud
- timescaledb
- typescript
- ultralytics
- uvicorn
- vercel
- vite
- vultr
- websockets
- yolo


Log in or sign up for Devpost to join the conversation.