-
-
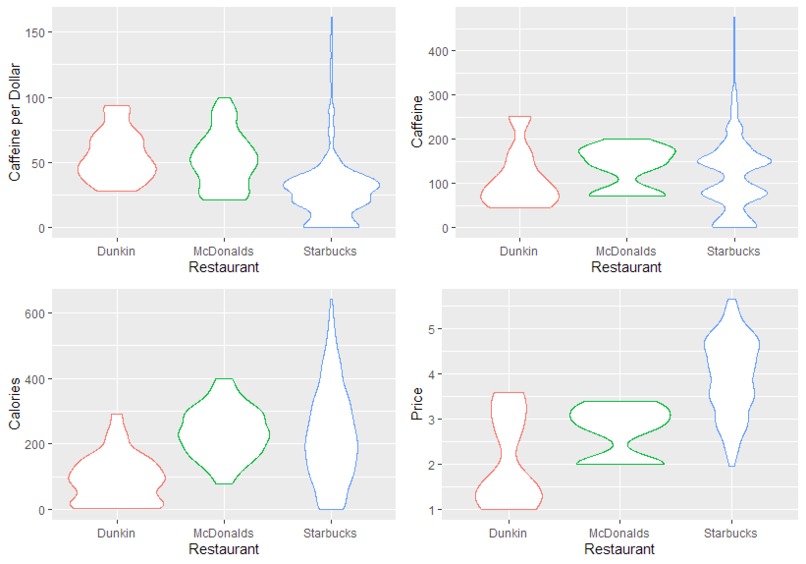
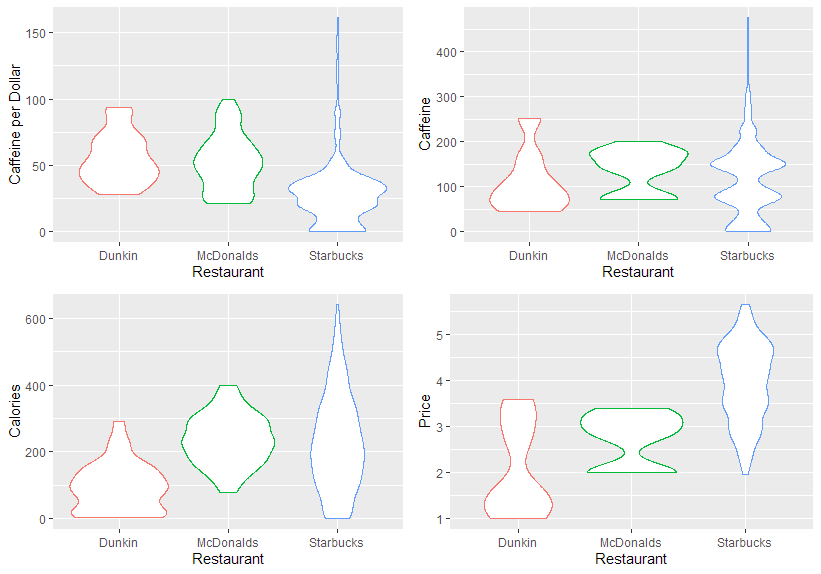
ggplot2 grid comparing different restaurants on the important figures
Inspiration
Working on a Hackathon project is tiring work, especially if you plan to go the distance and work the full 24 hours. Energy drinks are great, but we prefer a good ol' fashion 'cup of joe'. And unless we want to bring an Espresso machine to Kyle Field, ordering out from a coffee shop is the way to go. But between McDonald's McCafe offerings, Starbucks and Dunkin' Donuts, there are over a thousand possible standard coffee orders (normal price, no extras). How is a person to choose? We wanted to build an app that would help people from every industry (because we all need coffee) solve the very real world problem of where to get the right cup.
What it does
We've compiled key nutritional, caffeine and price data from across a variety of web sources to construct a list of every normal drink from the three major coffee serving establishments, and an R Shiny application to pick a drink to order from the list based on the user's desires. Our final dataset (downloadable on our GitHub repository under complete_data/restaurants.csv) has 892 unique drinks (rows) across the 3 restaurants, and 18 features (columns) per drink. The closest we could find that anyone had done before is only the Starbucks nutritional data (no price/caffeine/other stores) on Kaggle.
How we built it
We started with (and spent the majority of time on) data collection, cleaning, and aggregation. Data was scraped from:
https://www.caffeineinformer.com/mccafe-coffee-caffeine-content https://www.caffeineinformer.com/complete-guide-to-dunkin-donuts-caffeine-content https://www.dunkindonuts.com/content/dam/dd/pdf/nutrition.pdf https://globalassets.starbucks.com/assets/94fbcc2ab1e24359850fa1870fc988bc.pdf https://www.fastfoodmenuprices.com/starbucks-prices/ https://www.fastfoodmenuprices.com/dunkin-donuts-prices/ https://www.fastfoodmenuprices.com/mcdonalds-prices/
using the rvest package in R for HTML and Excel for PDFs. All prices are based on College Station, TX, because that's where you want to get coffee from of course! This data was then cleaned and aggregated in a variety of R scripts. From here the data was used to build the app in R Shiny to select drinks according to the input preferences on the front end.
Challenges we ran into
Since we had to draw from so many sources to get all the features we wanted, getting everything in a compatible format was a much larger timesink than expected. Also, getting data out of the PDFs was not trivial due to some formatting peculiarities with how they were created. After all the time spent getting the data together, creating what we thought would be the most challenging part (the R Shiny app) was time consuming, but relatively straightforward.
Accomplishments that we're proud of
None of us had ever used web scraping tools in R before, but were able to pick up on them quite quickly. The app delivers on the desired functionality of picking the proper coffee. The solution could easily be generalized to any other region now that the automation is in place to acquire the data. Furthermore, there are many interesting conclusions beyond picking coffee that can be drawn by comparing similar drinks from between establishments or augmenting the existing data with popularity/seasonality data.
What we learned
We learned about web scraping in R, how to get data out of messy PDFs, and most importantly, where to get the perfect coffee to stay awake for the rest of the event (probably not McDonalds!) Specifically, we found that Starbucks usually has expensive and relatively high calorie drinks, but their brewed coffee is both cost effective and packs a punch. McDonalds has a decent Caffeine/dollar ratio for most drinks (similar to Dunkin') but plateaus at a meager 200mg and has a high calorie count compared to the other options. Dunkin' had many cheap and low calorie drinks, but still caps our on caffeine at only around 250 mg. So, which one to choose? Check out our Shiny app to get a personalized recommendation!
What's next for Finding Java in R
With more time, the data could be augmented with popularity data (though this would require potentially expensive surveying as the APIs for all 3 establishments are not open), more establishments (with the caveat of less generalizable results due to other chains not being widespread), and live updates of seasonal offerings (so long as the format of the information is unchanged and is consistent across all the many websites required to compile the requisite information). We could also go in and manually add in the missing data points that no website had ourself (if the information is public), though it would be tedious.
Built With
- r
- tidyverse


Log in or sign up for Devpost to join the conversation.