-
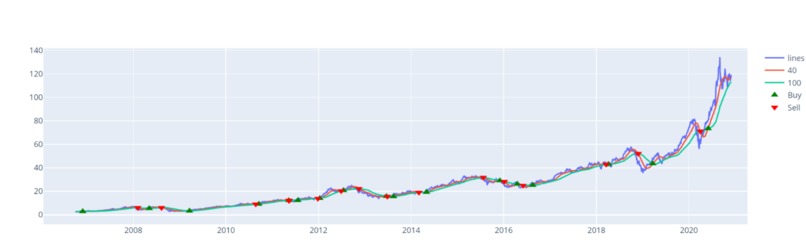
Moving average crossover
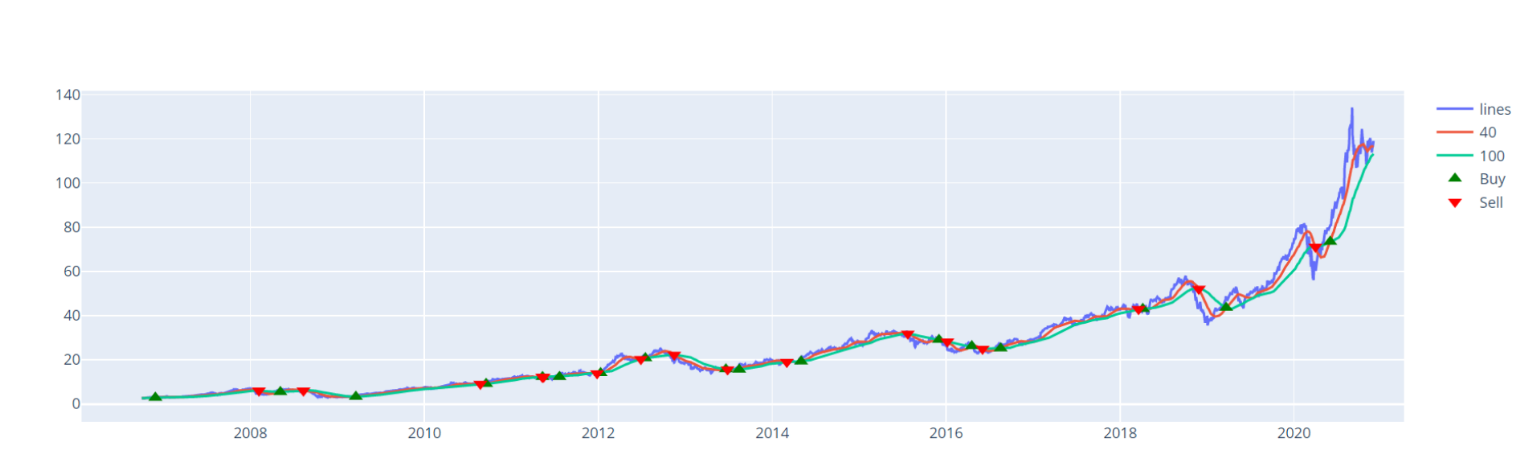
Data_and_Finance
👋 Hi! Data Analysis applications in finance like Time series analysis and Trading Strategies.
⭐ Star this repo for the support.
✌ Why this Repository?
The project uses especially makes the use of Django web framework, Python programming language, AJAX for the asynchronous rendering of the plots on the webpage, and Plotly for generating the graphs. The data is generated for this project is from using yfinance. You can use your own APIs if you want to get the stock data. The analysis plots that the dashboard can generate are Candlestick plots, bar plots, scatter plots, area plots of the stock data. Also, the dashboard displays the volatility in returns, cumulative returns, and moving average plots calculated on the provided input as a number of days to calculate the rolling mean.
The MAC tab in the project stands for Moving Average Crossover which is a simple algorithmic trading strategy and generates the Buy and Sell signals for the stock data provided. The user has to provide inputs of a short_window and a long_window, also with the stock ticker symbol, the start date, and the end date of the stock data you need. The Buy and Sell signal is visualized with a plot with markers along with a line plot of the Close price of the stock and moving averages of short_window and long_window respectively.

Log in or sign up for Devpost to join the conversation.