-
-
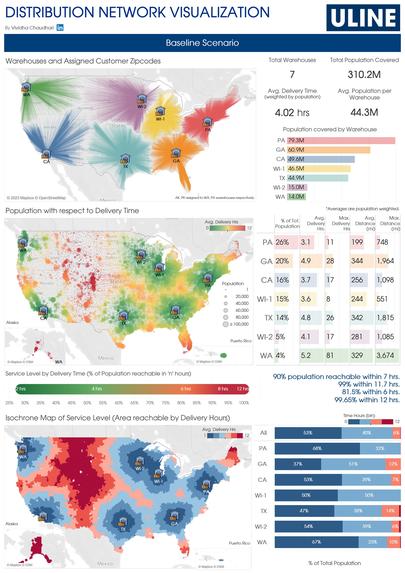
Baseline Scenario
-
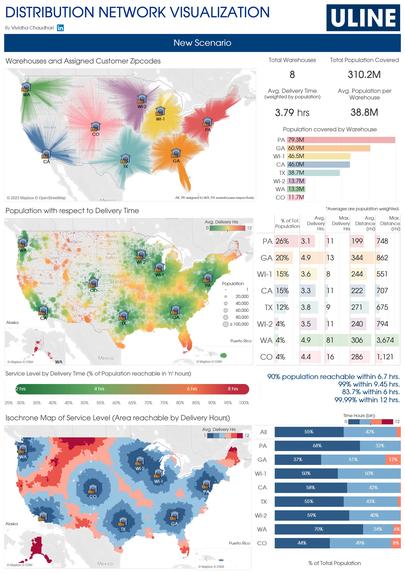
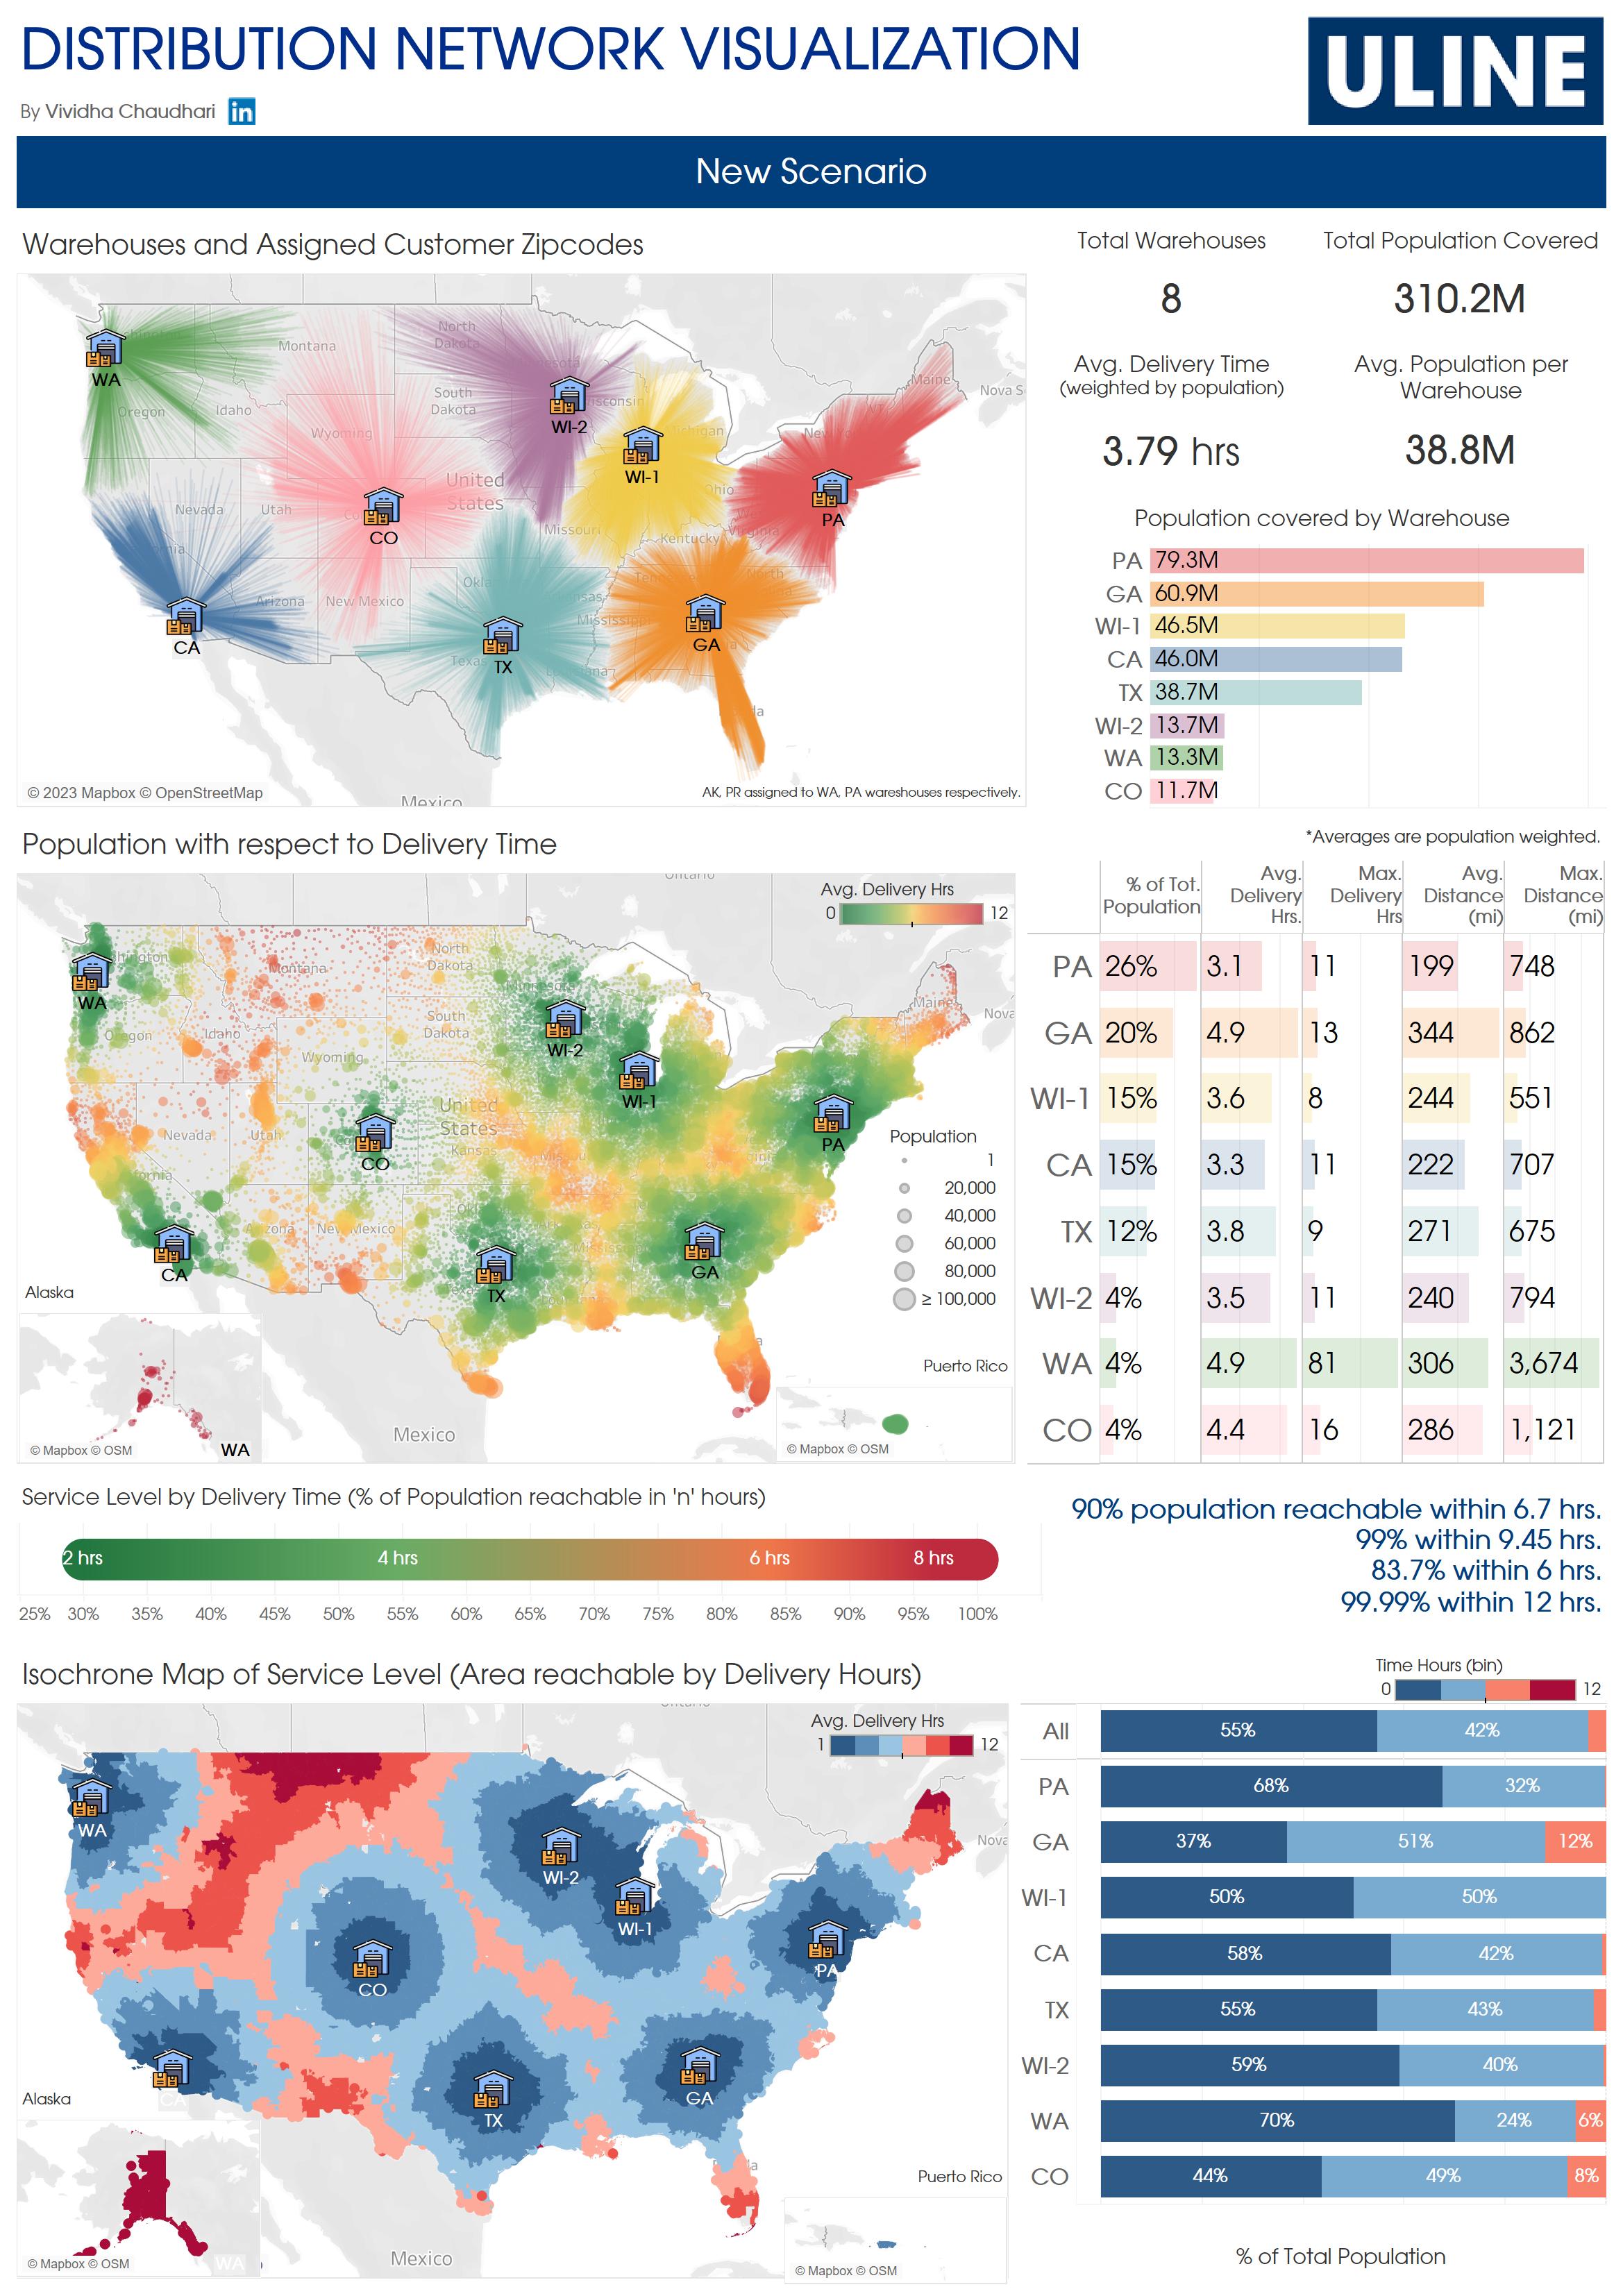
New Scenario
-
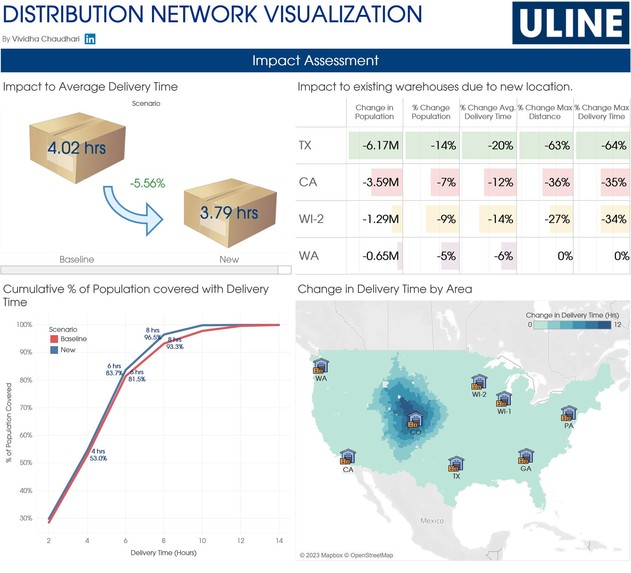
Impact Assessment

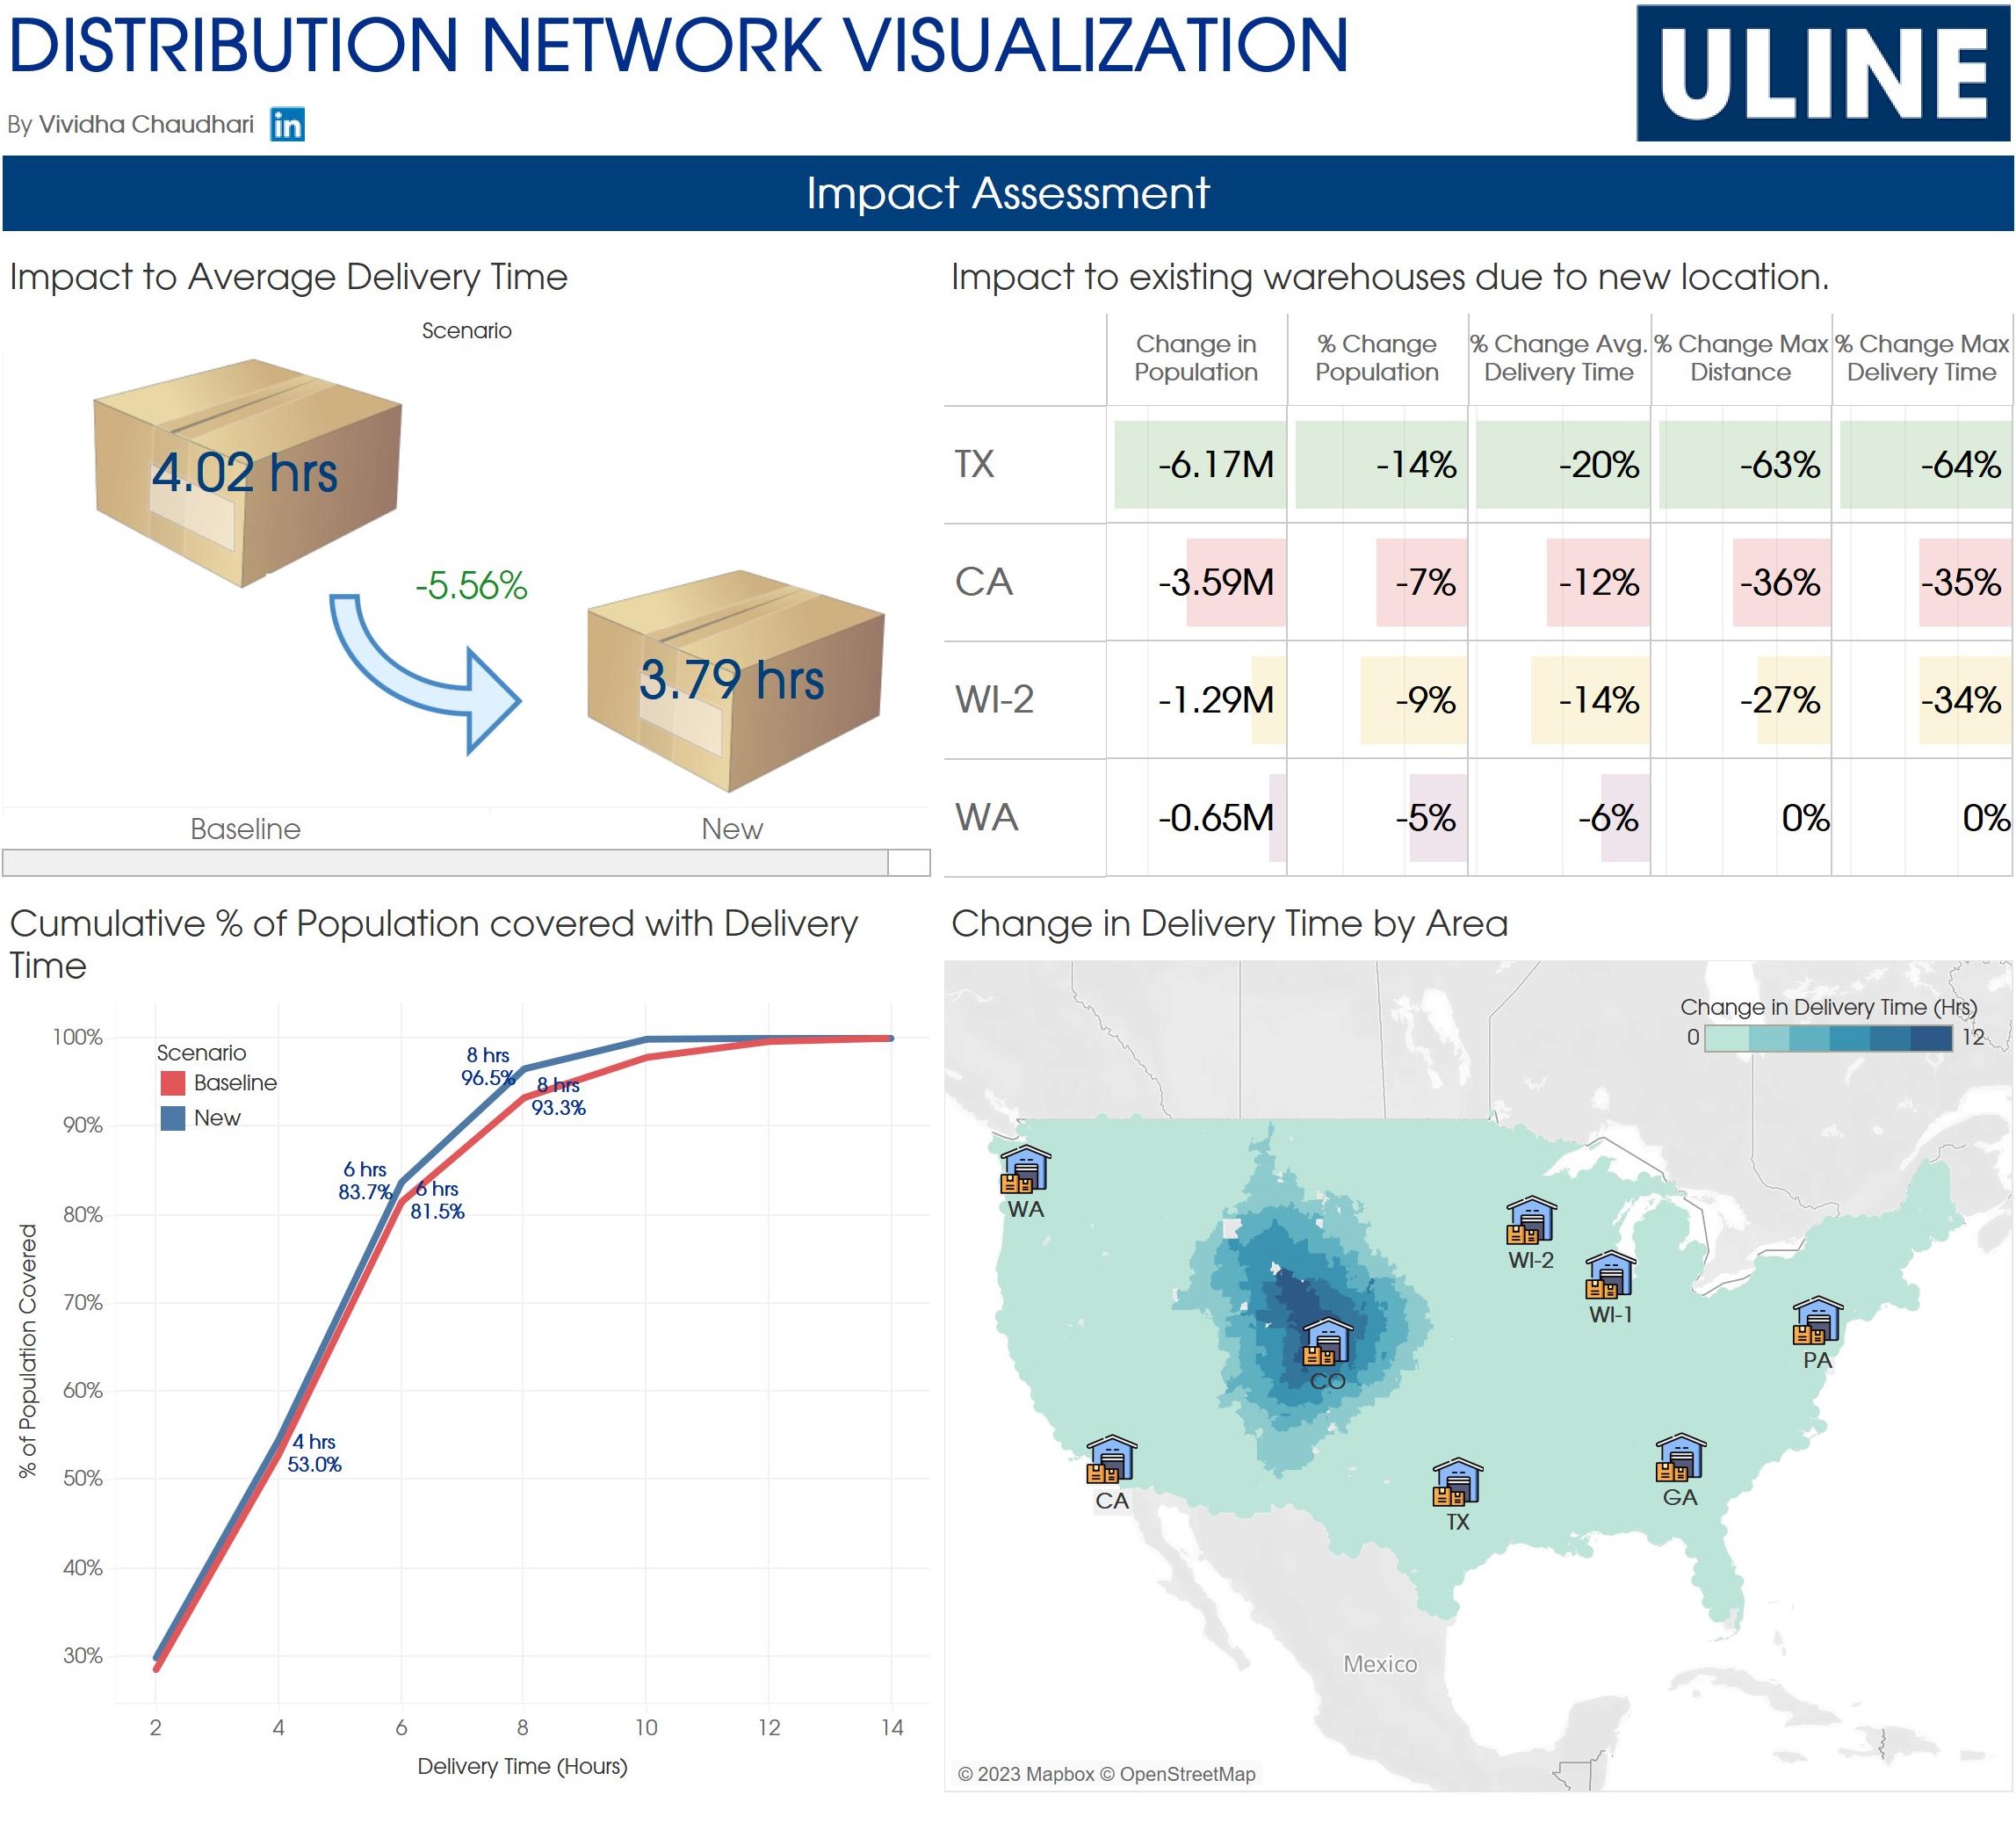
Inspiration
Opportunity to work on actual industry problem. Additionally, showcasing visualization and problem solving skills.
What it does
Visualizes current and new proposed network.
How we built it
I mainly used Python (with Github copilot) to find solution to the problem and Tableau to visualize it. Gurobi software's facility location problem tutorial helped me learn how to find the next best location.
Challenges we ran into
Input data needed some cleaning as it had some invalid values (e.g. TO_ZIP had text value as "zip code"). Calculating actual driving distance from New candidate locations to customer locations was a challenge as I did not find an easy tool/service that could be used. Ultimately, I settled on using Geodesic distance and applied a factor as estimated using linear regression to estimate actual driving distance.
Accomplishments that we're proud of
Learned new algorithms and use Python libraries like Gurobi. I was able apply linear regression technique on input data to estimate a factor to calculate travel time from distance for new candidate locations to customer locations.
What we learned
Lot of new capabilites of Python and Tableau. GitHub copilot made it very easy to code in Python. Visualizing the data pretty much gave away/narrowed down the area for next best location.
What's next for Distribution Network Visualization
Excited for future hackathons.

Log in or sign up for Devpost to join the conversation.