Inspiration
The financial world is often complex and intimidating for individuals without a finance background. Many struggle to interpret key metrics, stock trends, and company valuation data. Inspired by this challenge, FinBridge was created to bridge the gap between overwhelming financial data and actionable insights. It aims to empower non-experts to analyze, predict, and understand financial health effectively.
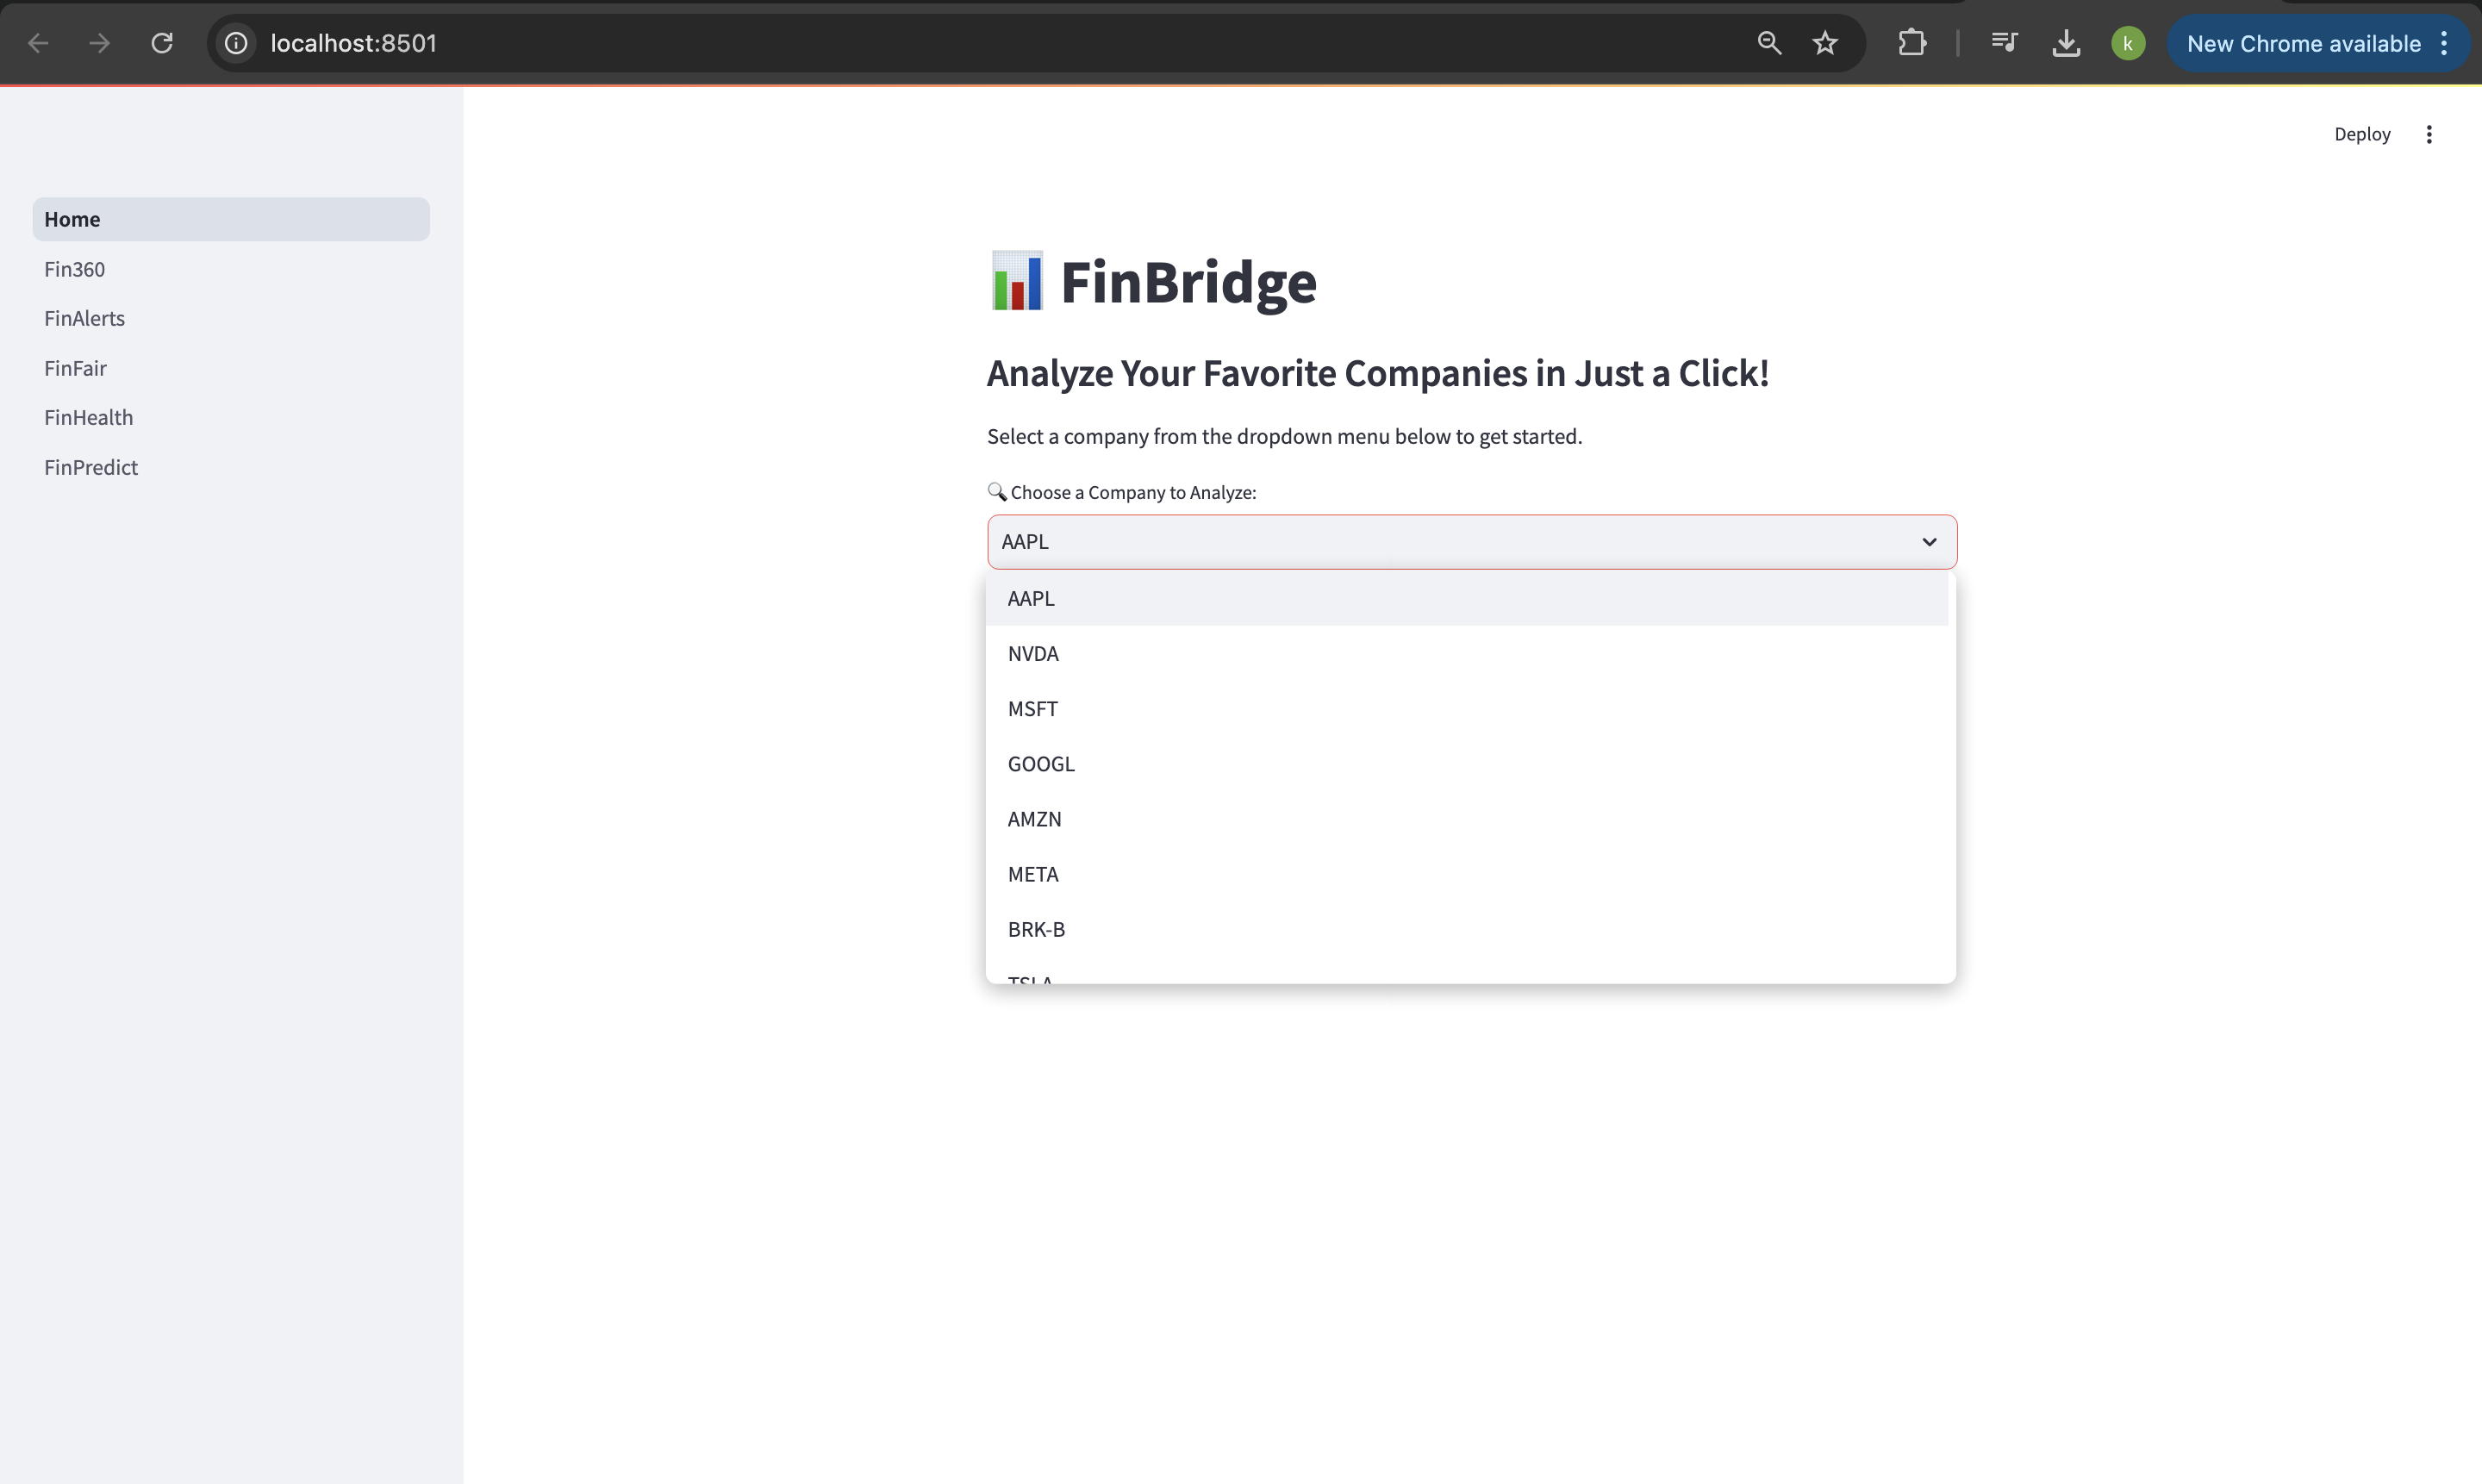
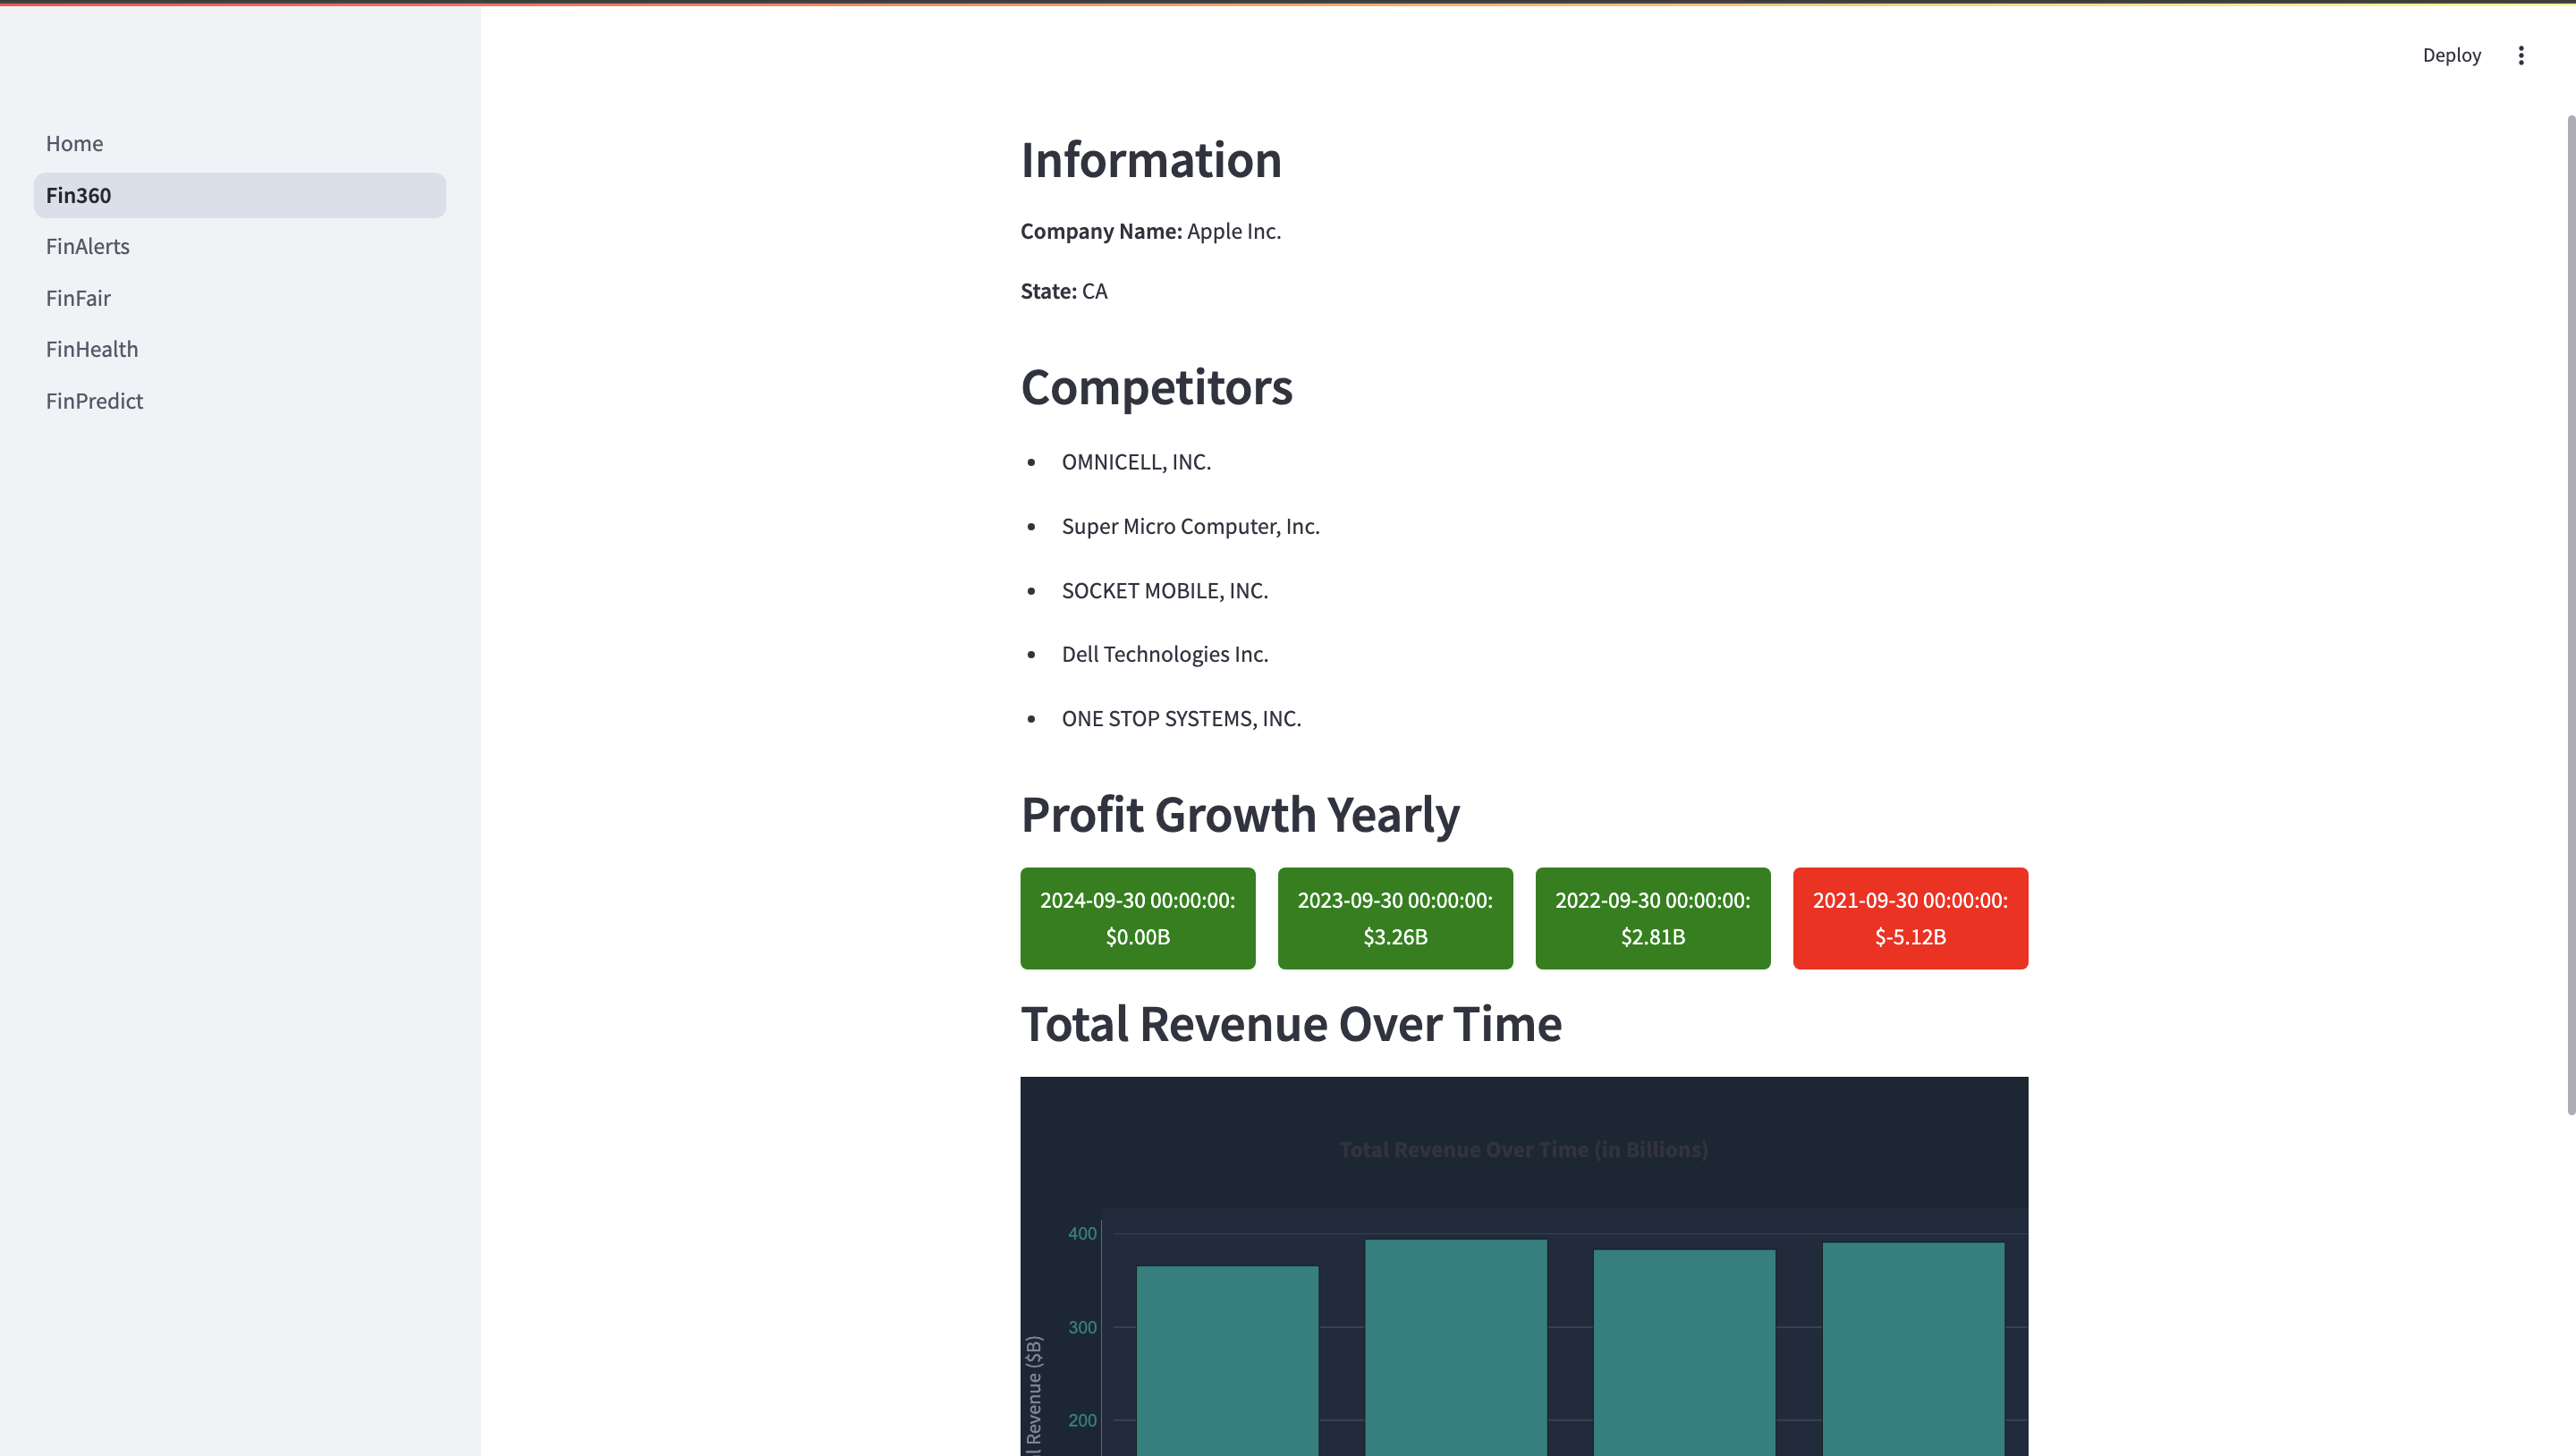
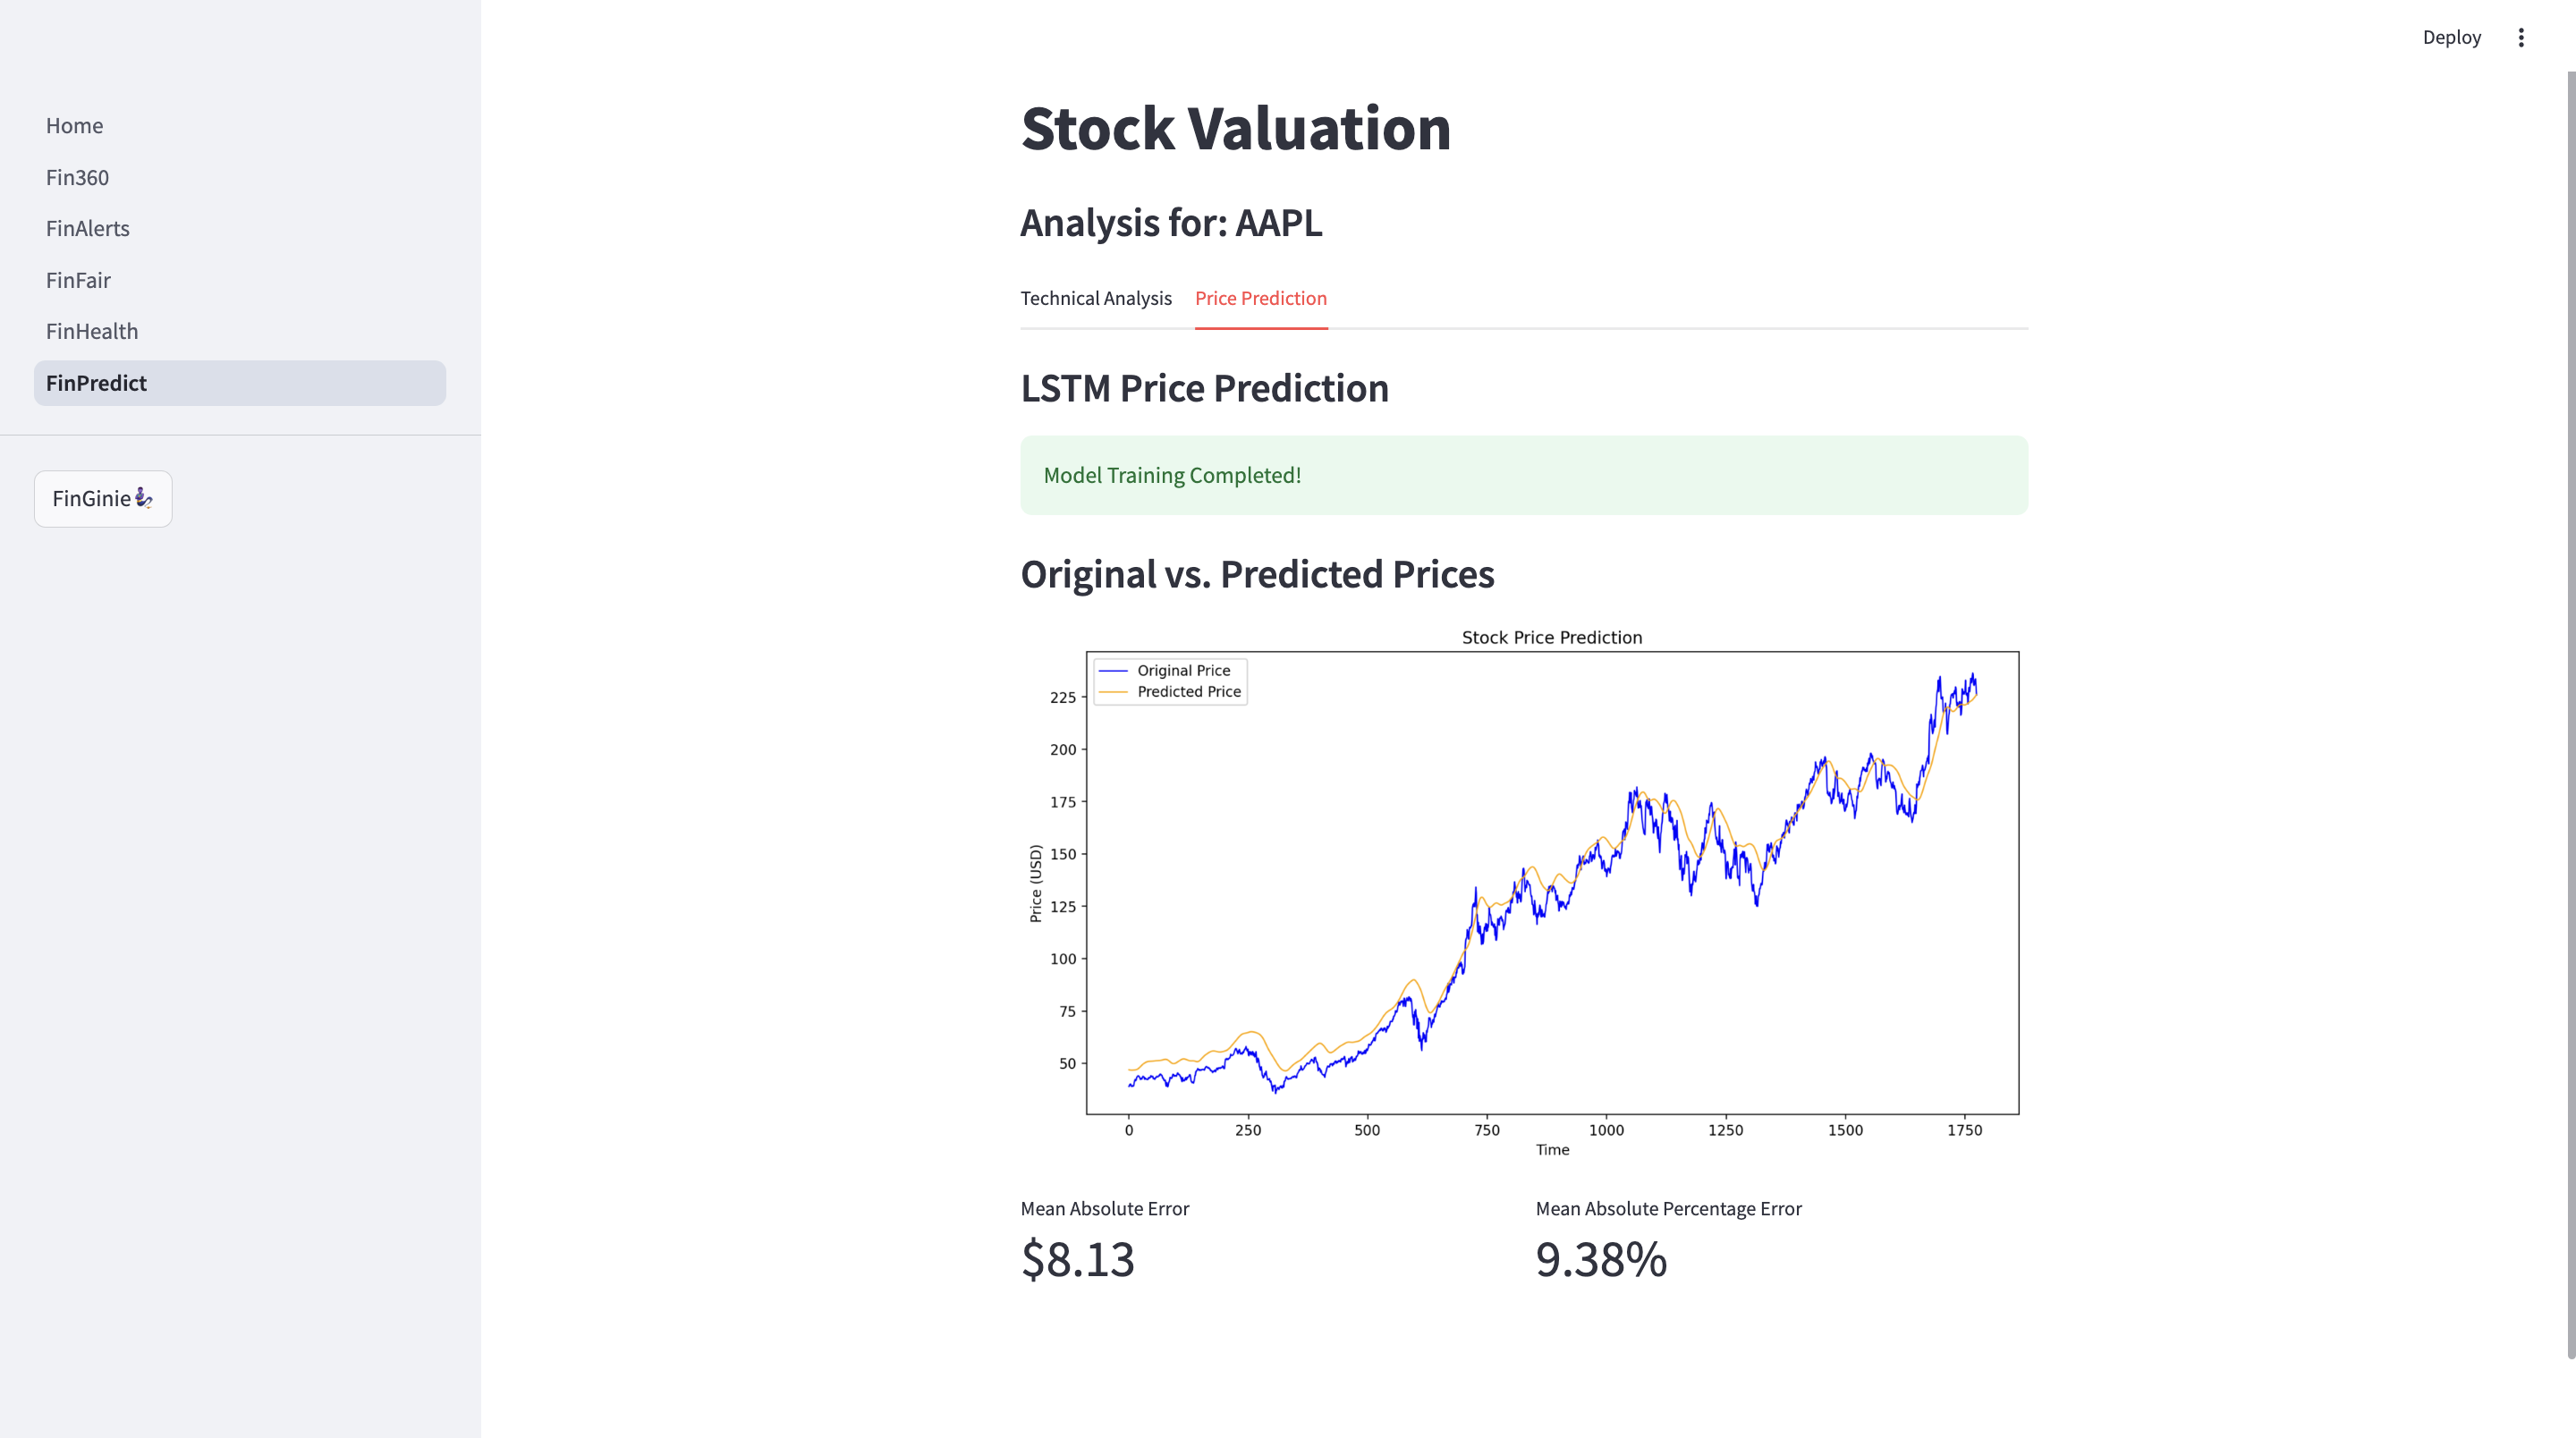
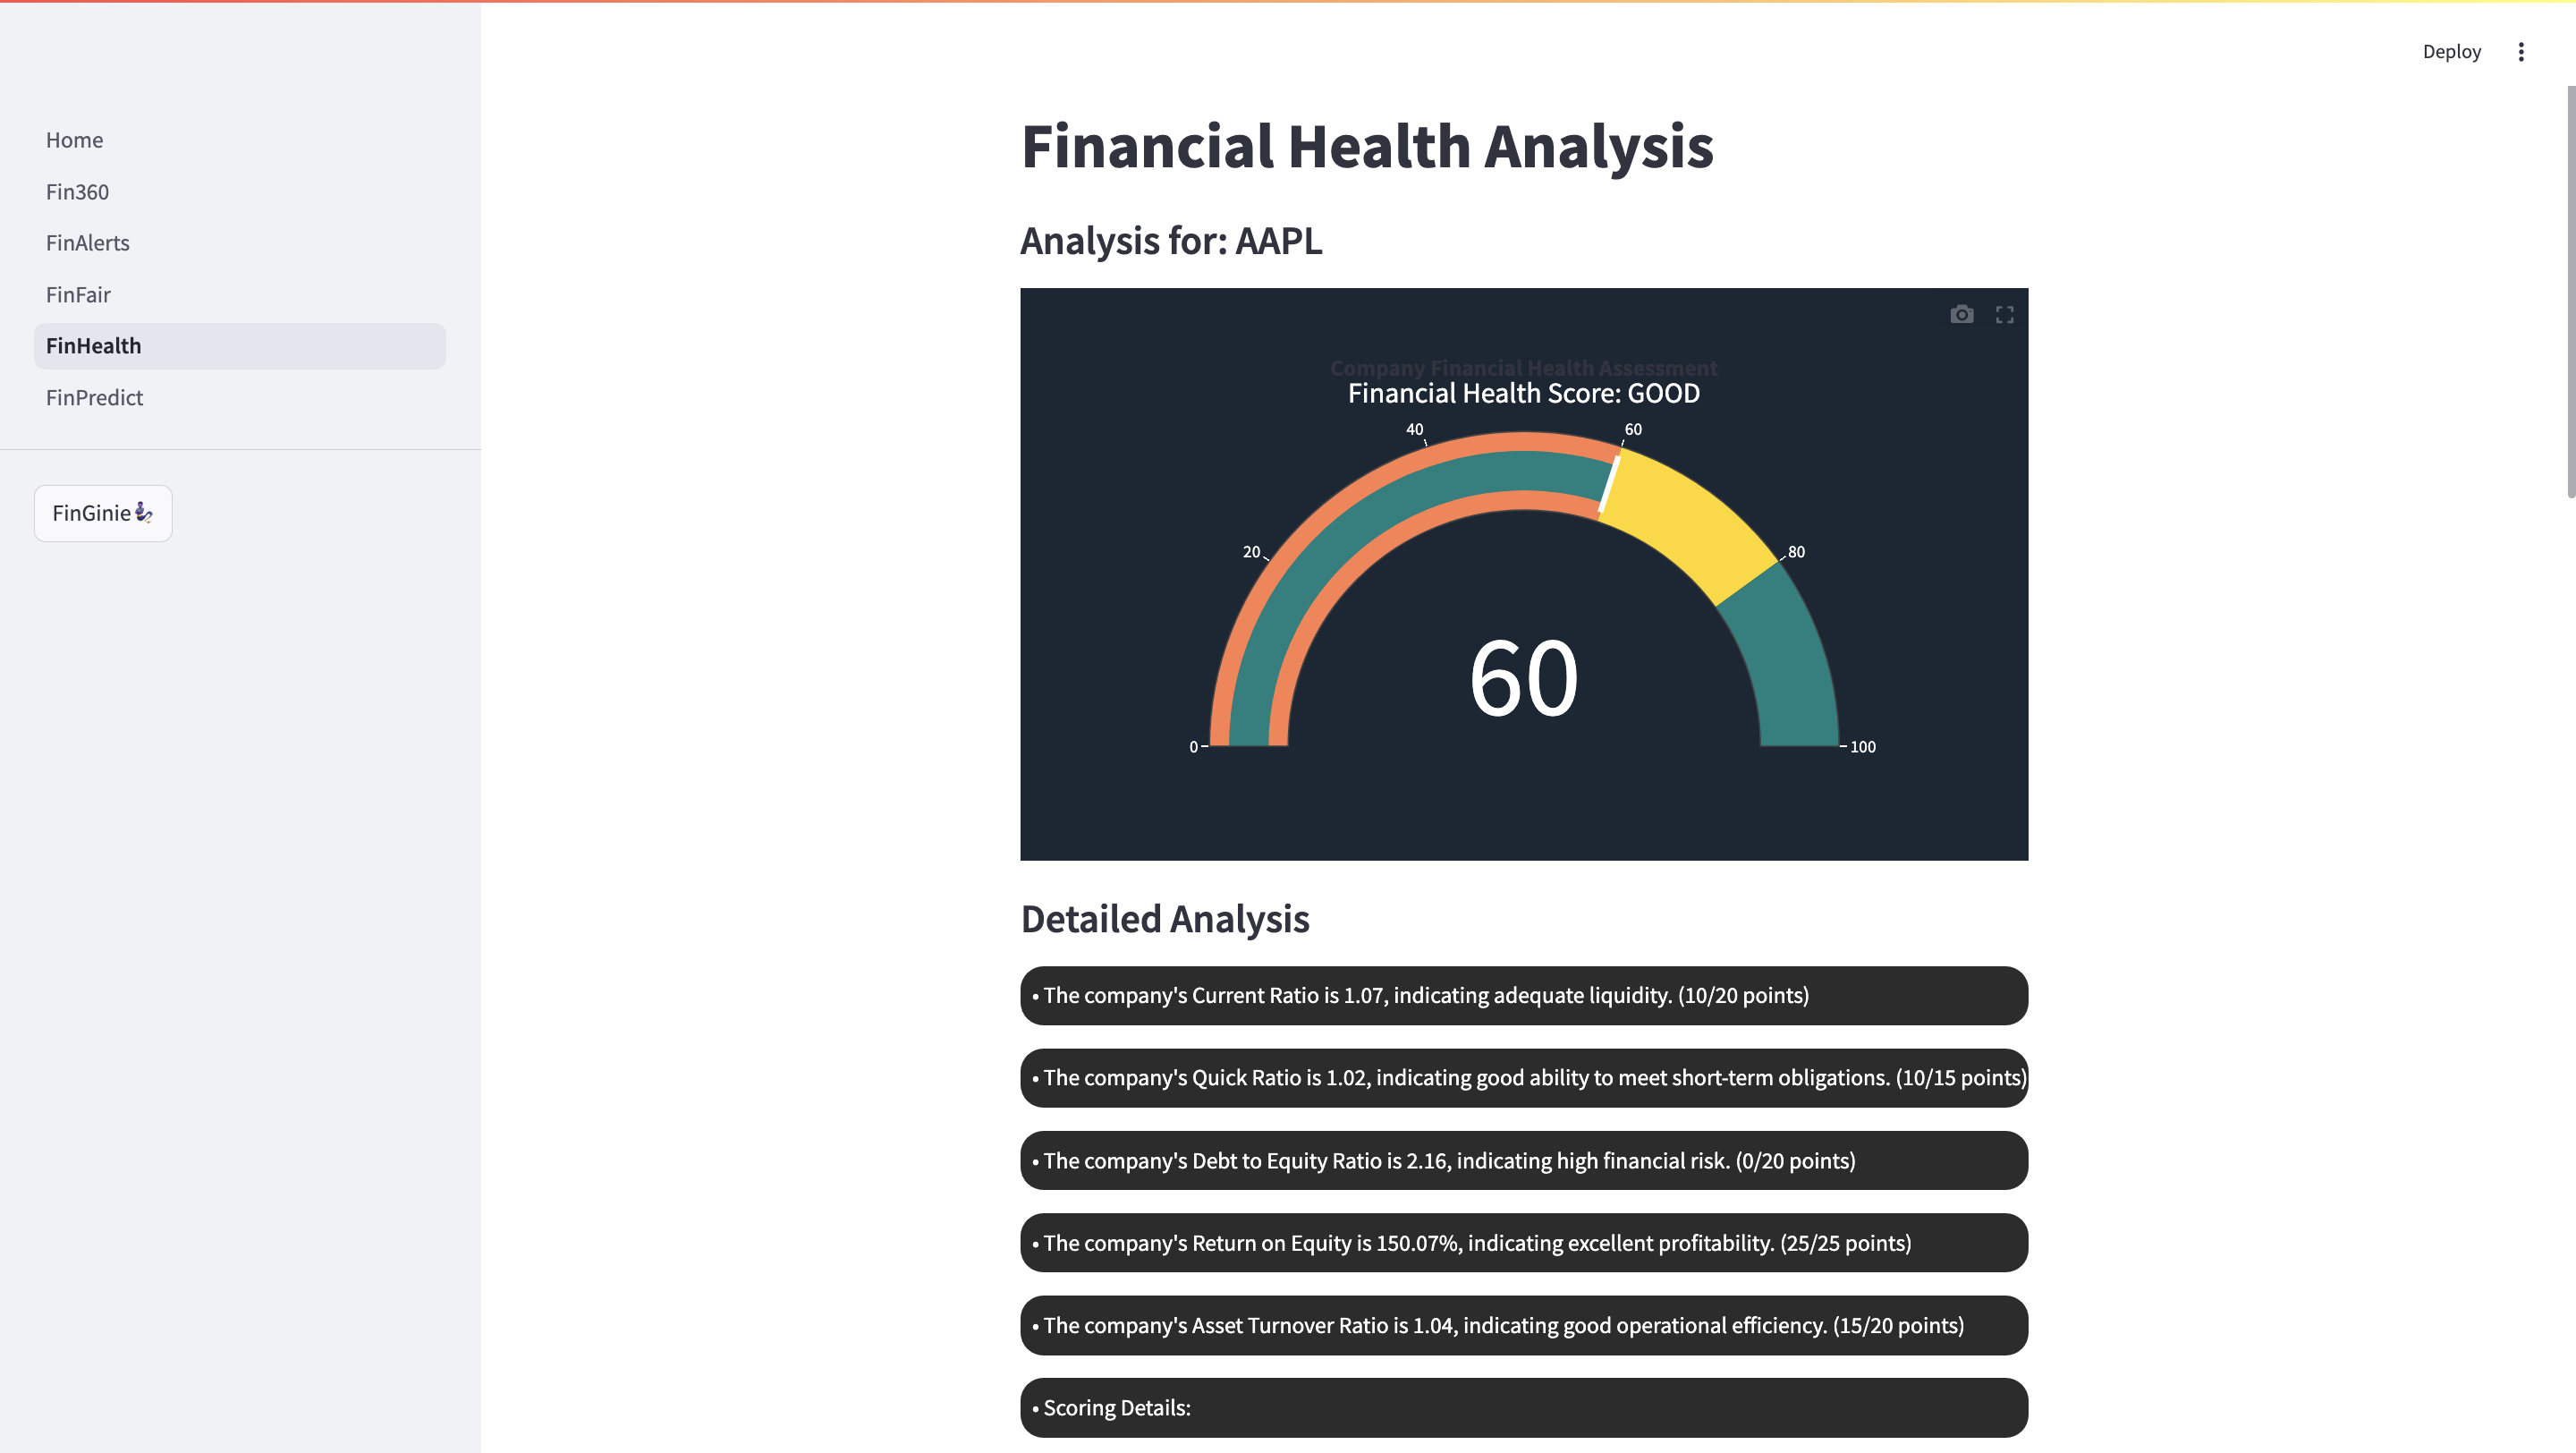
What it does
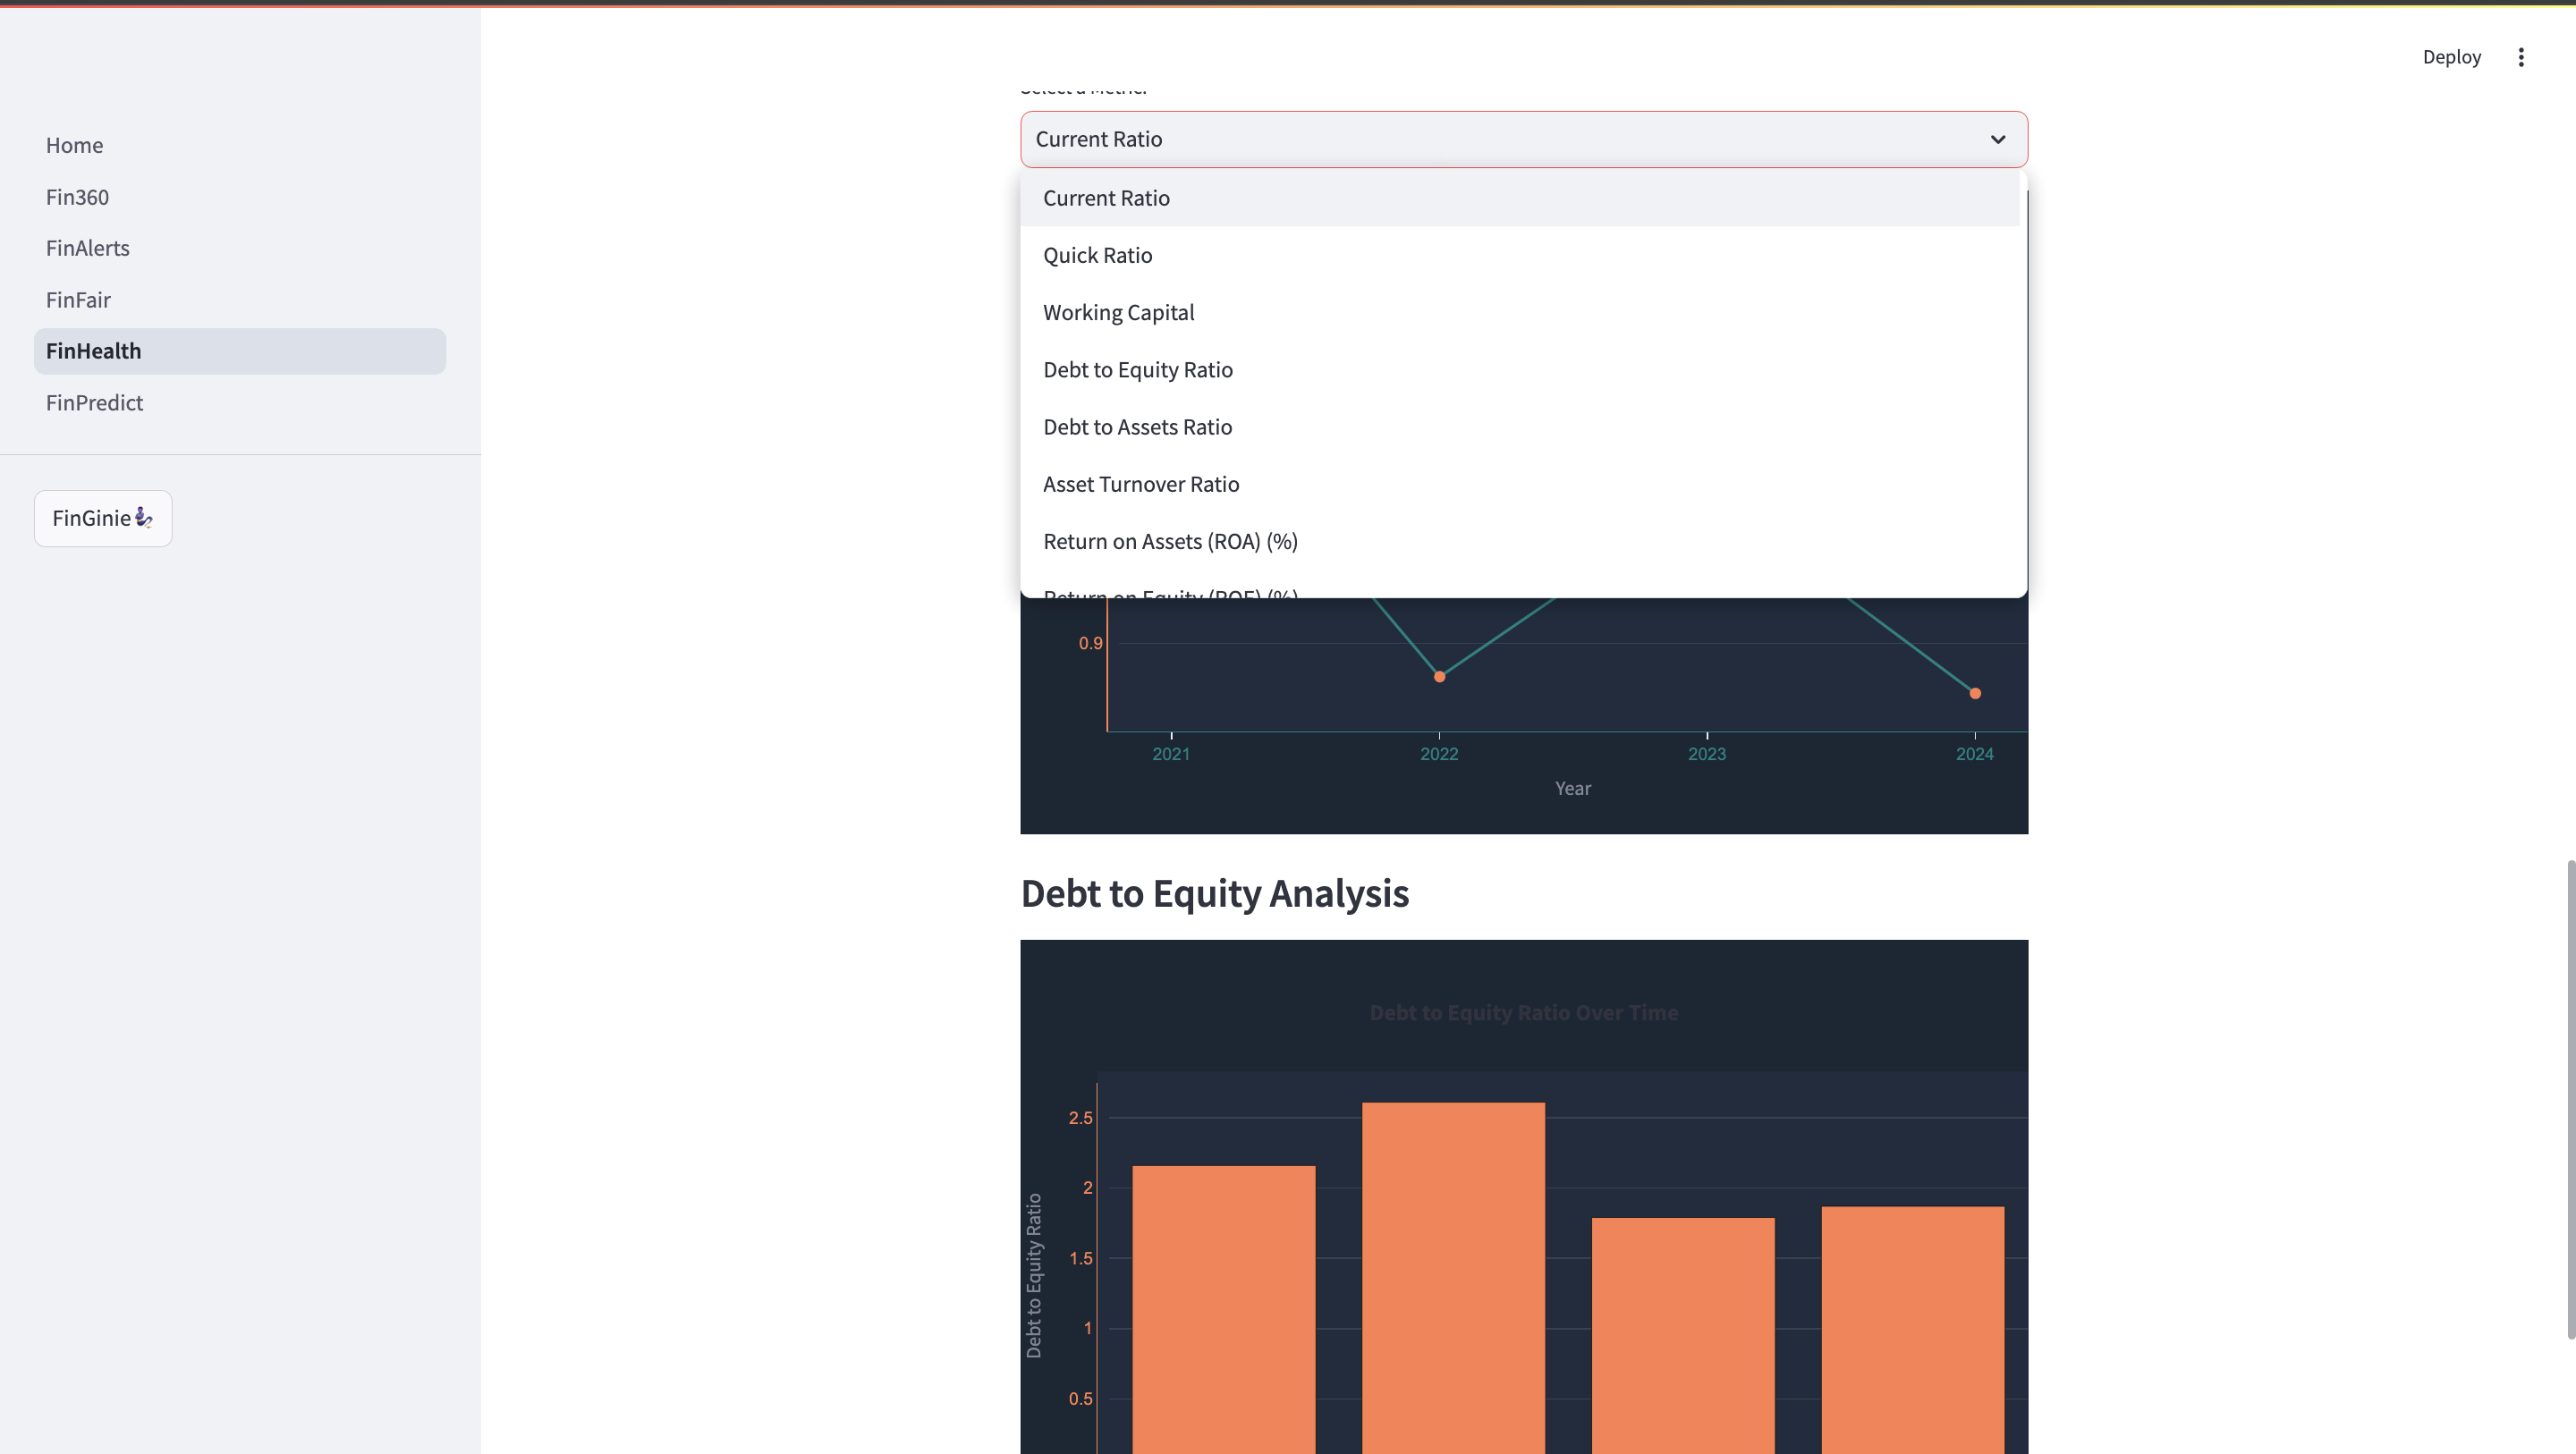
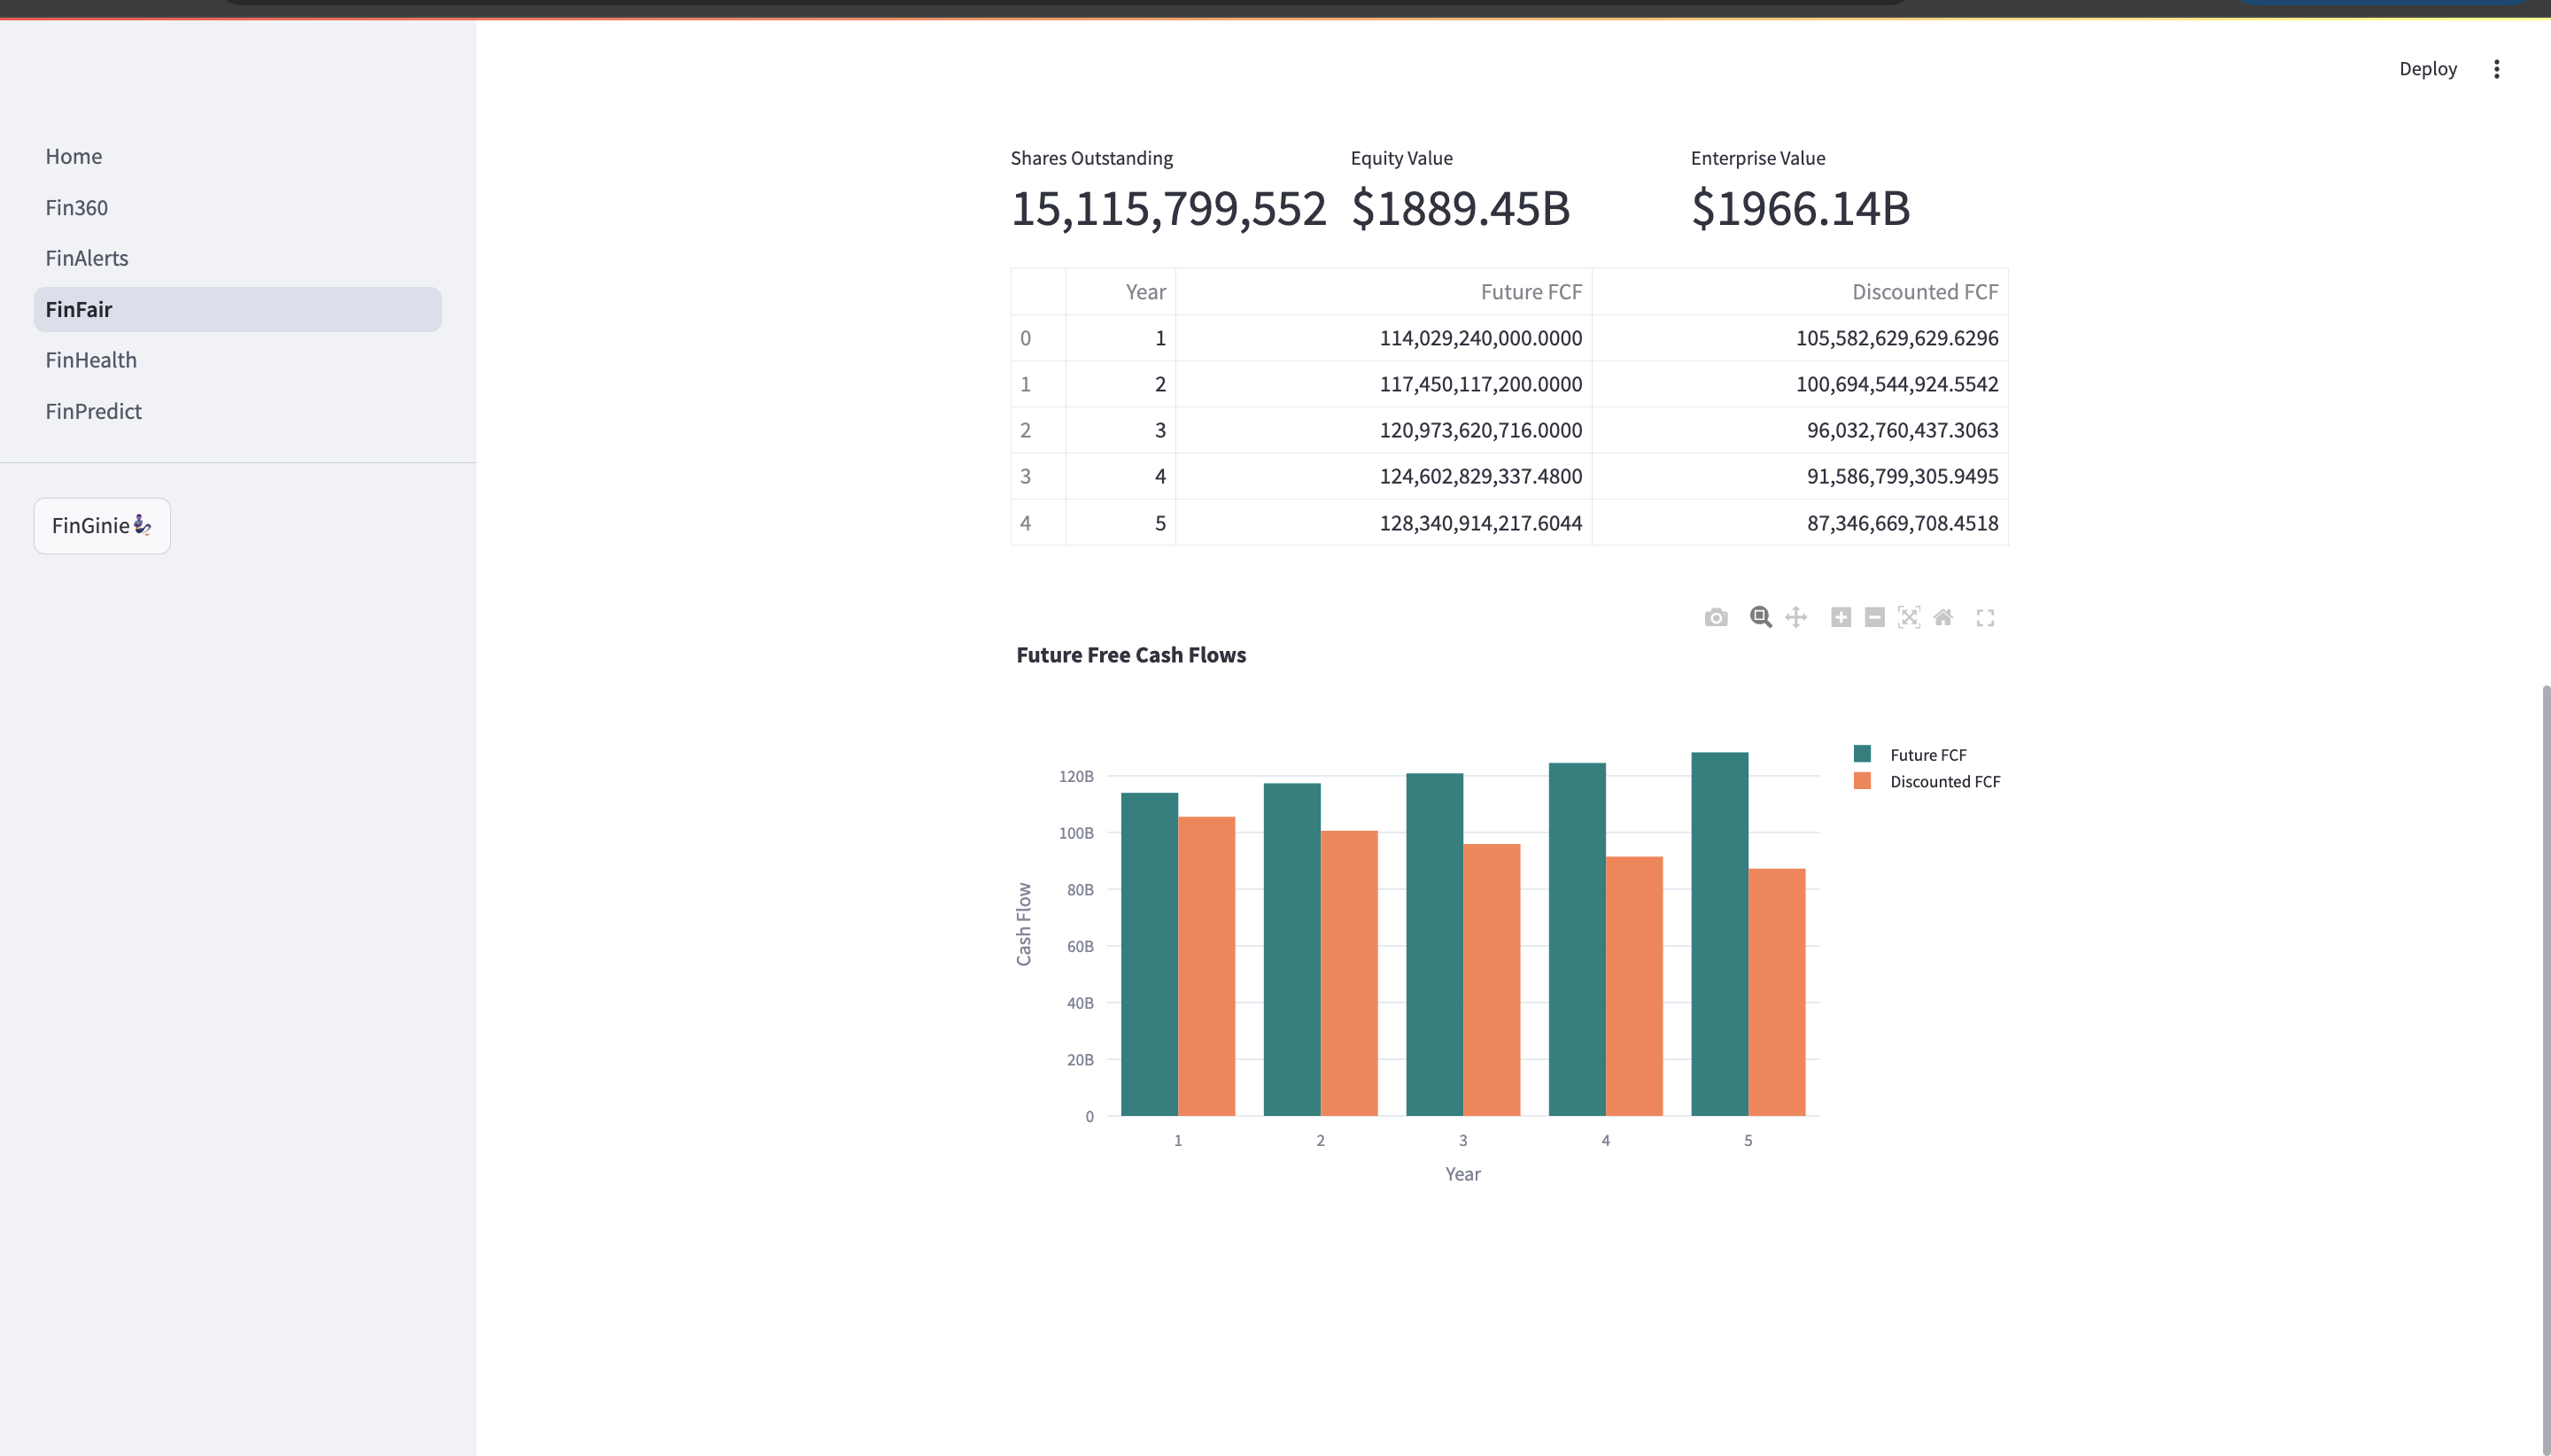
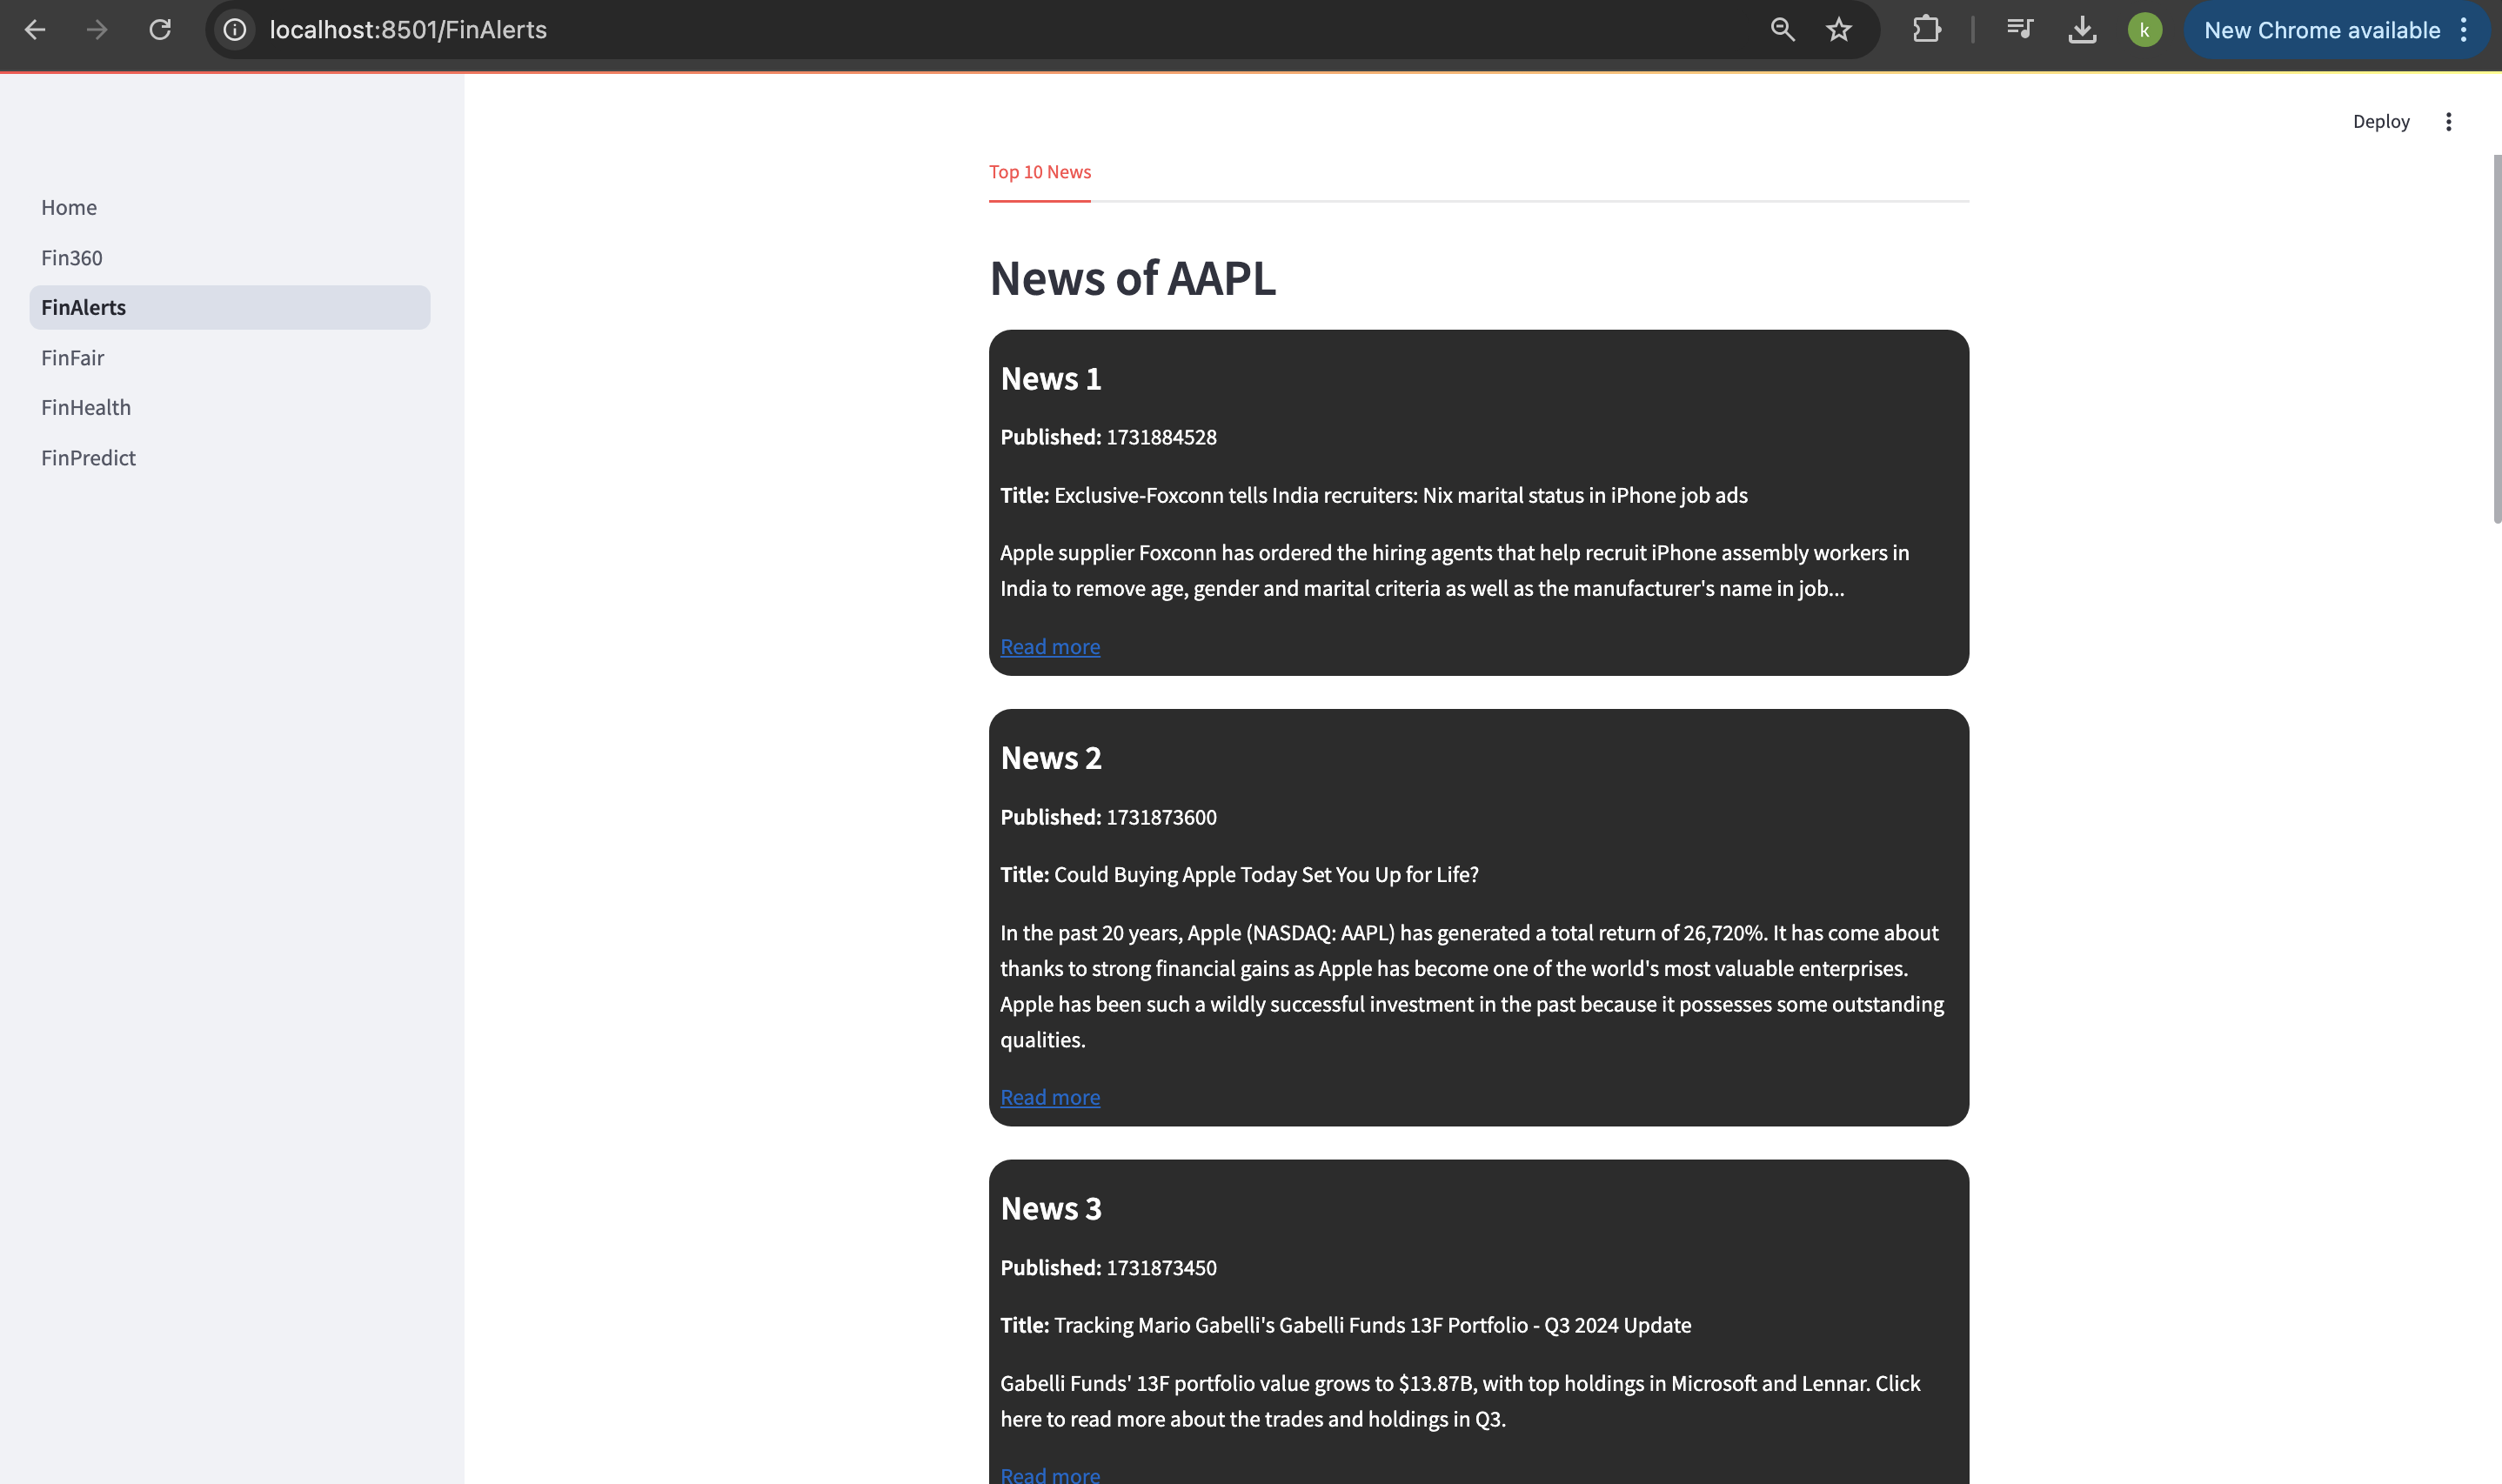
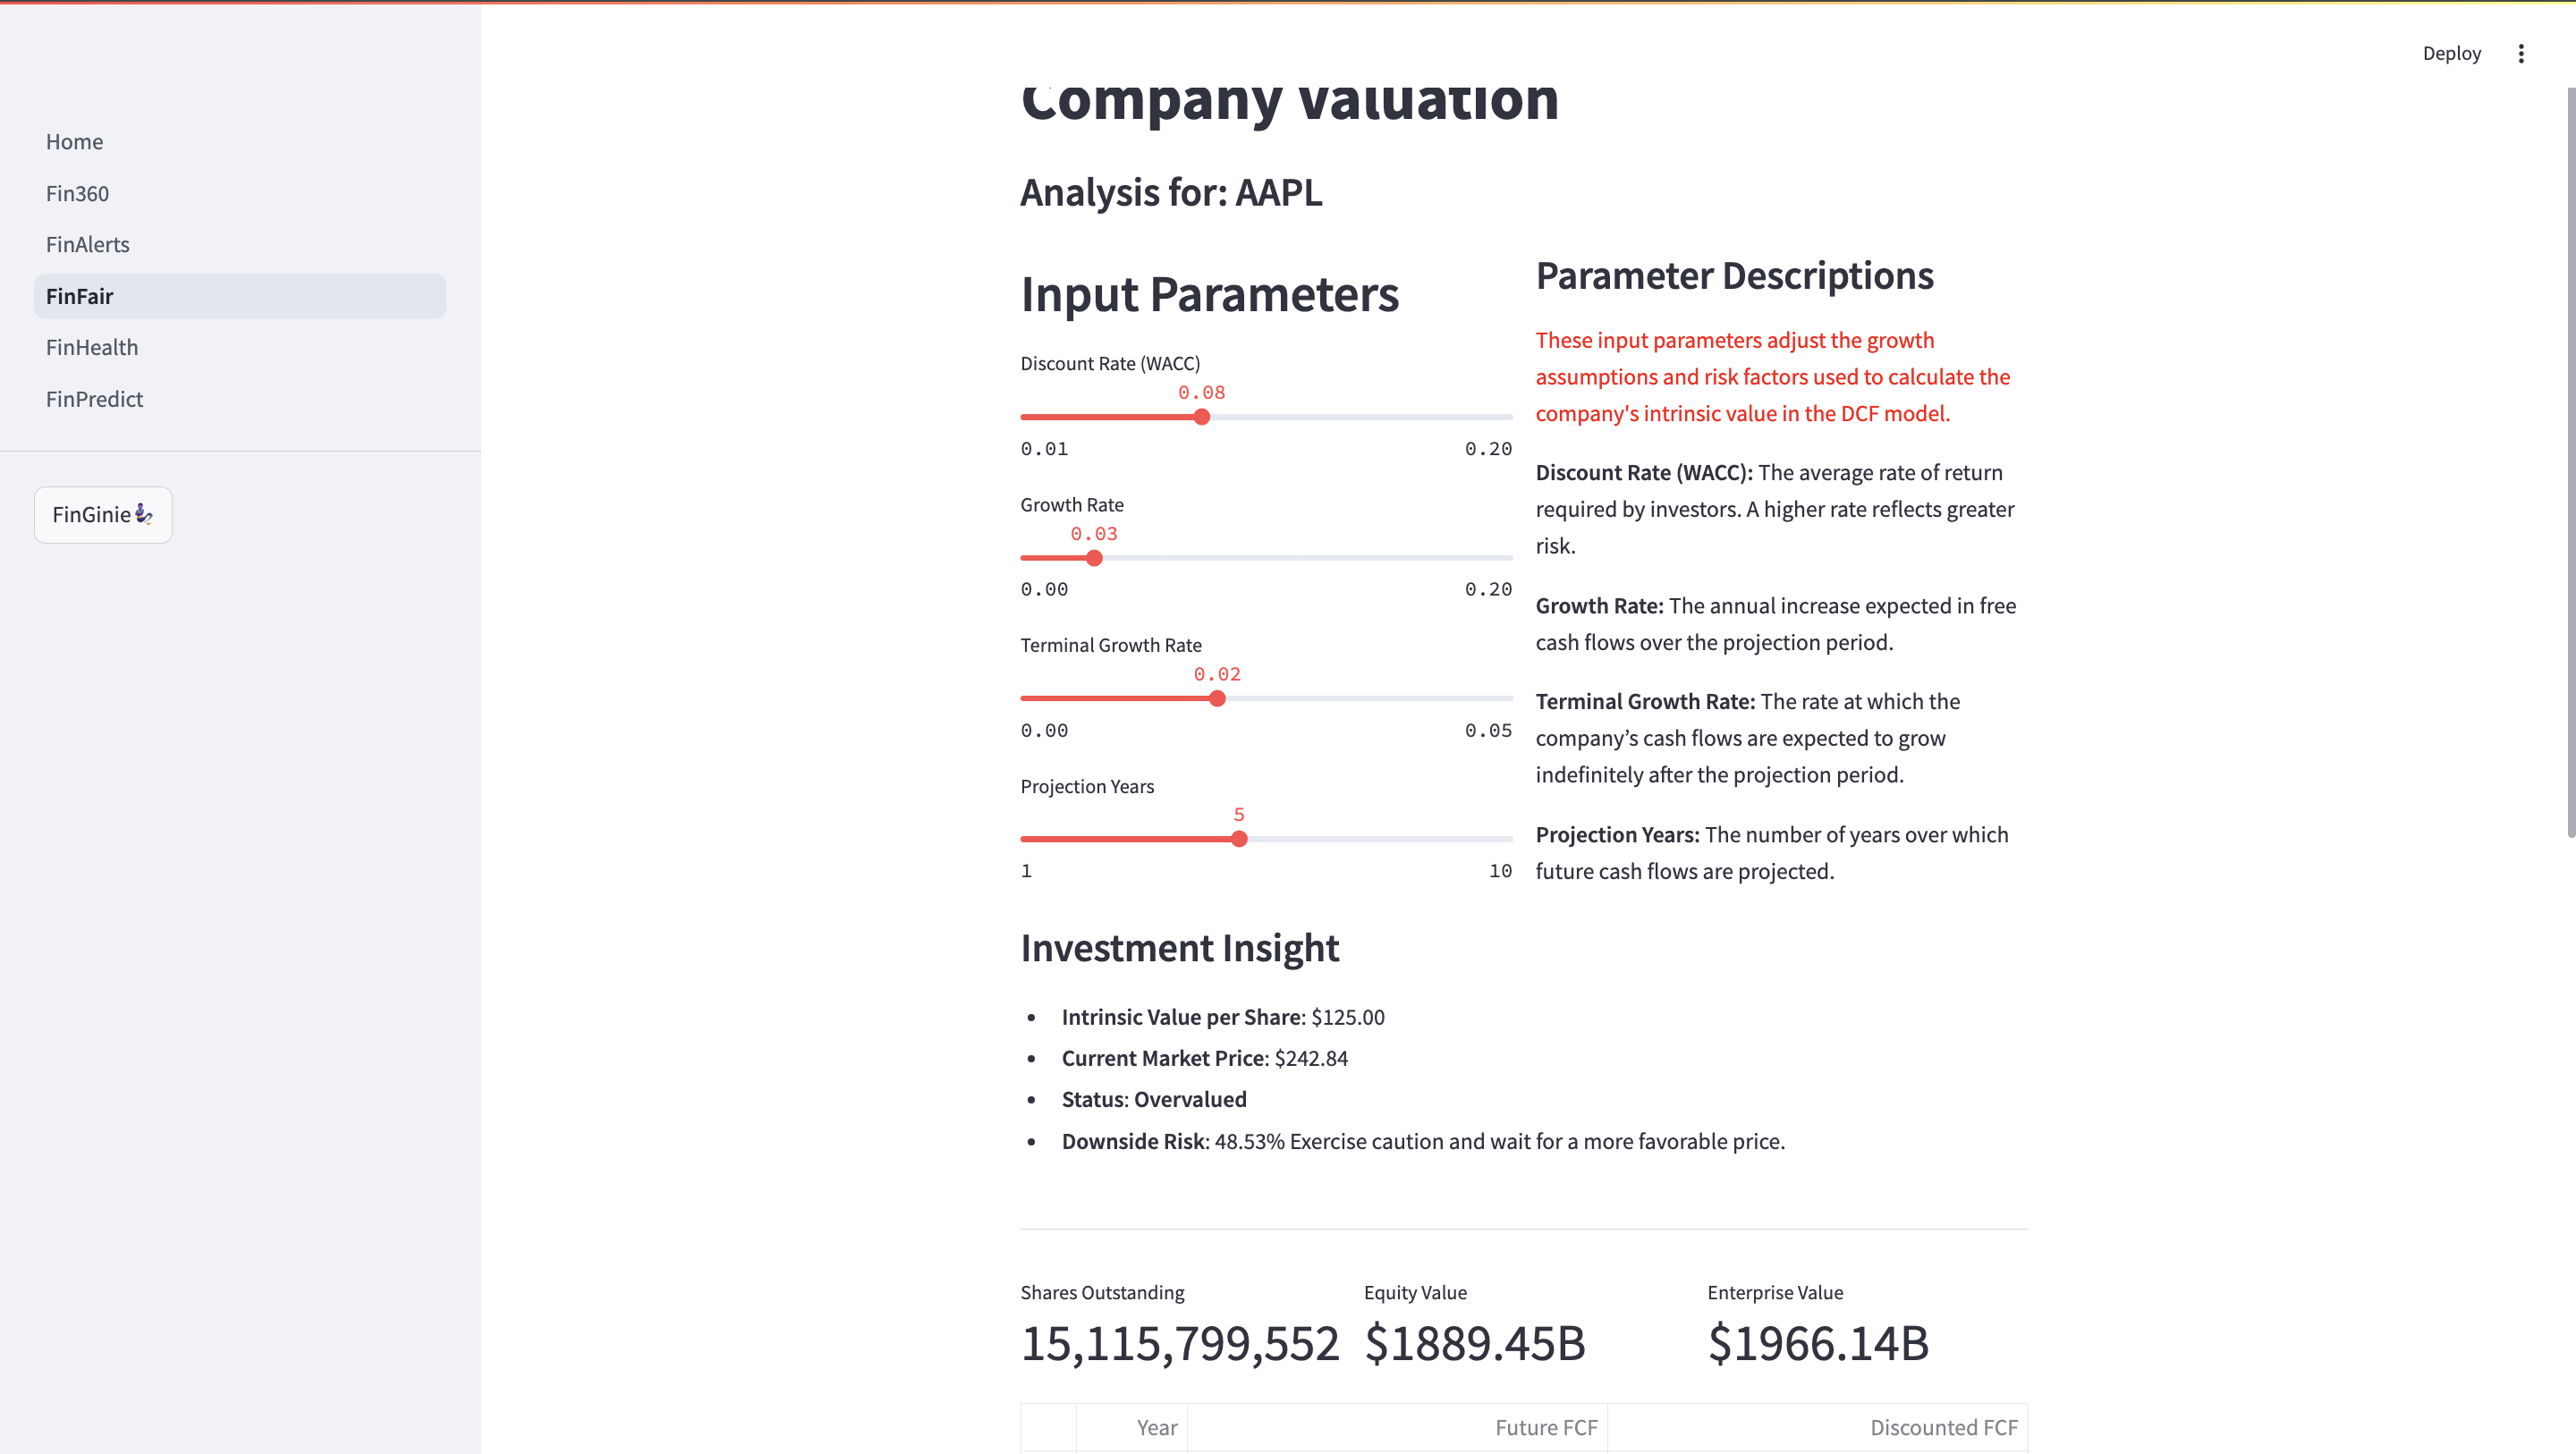
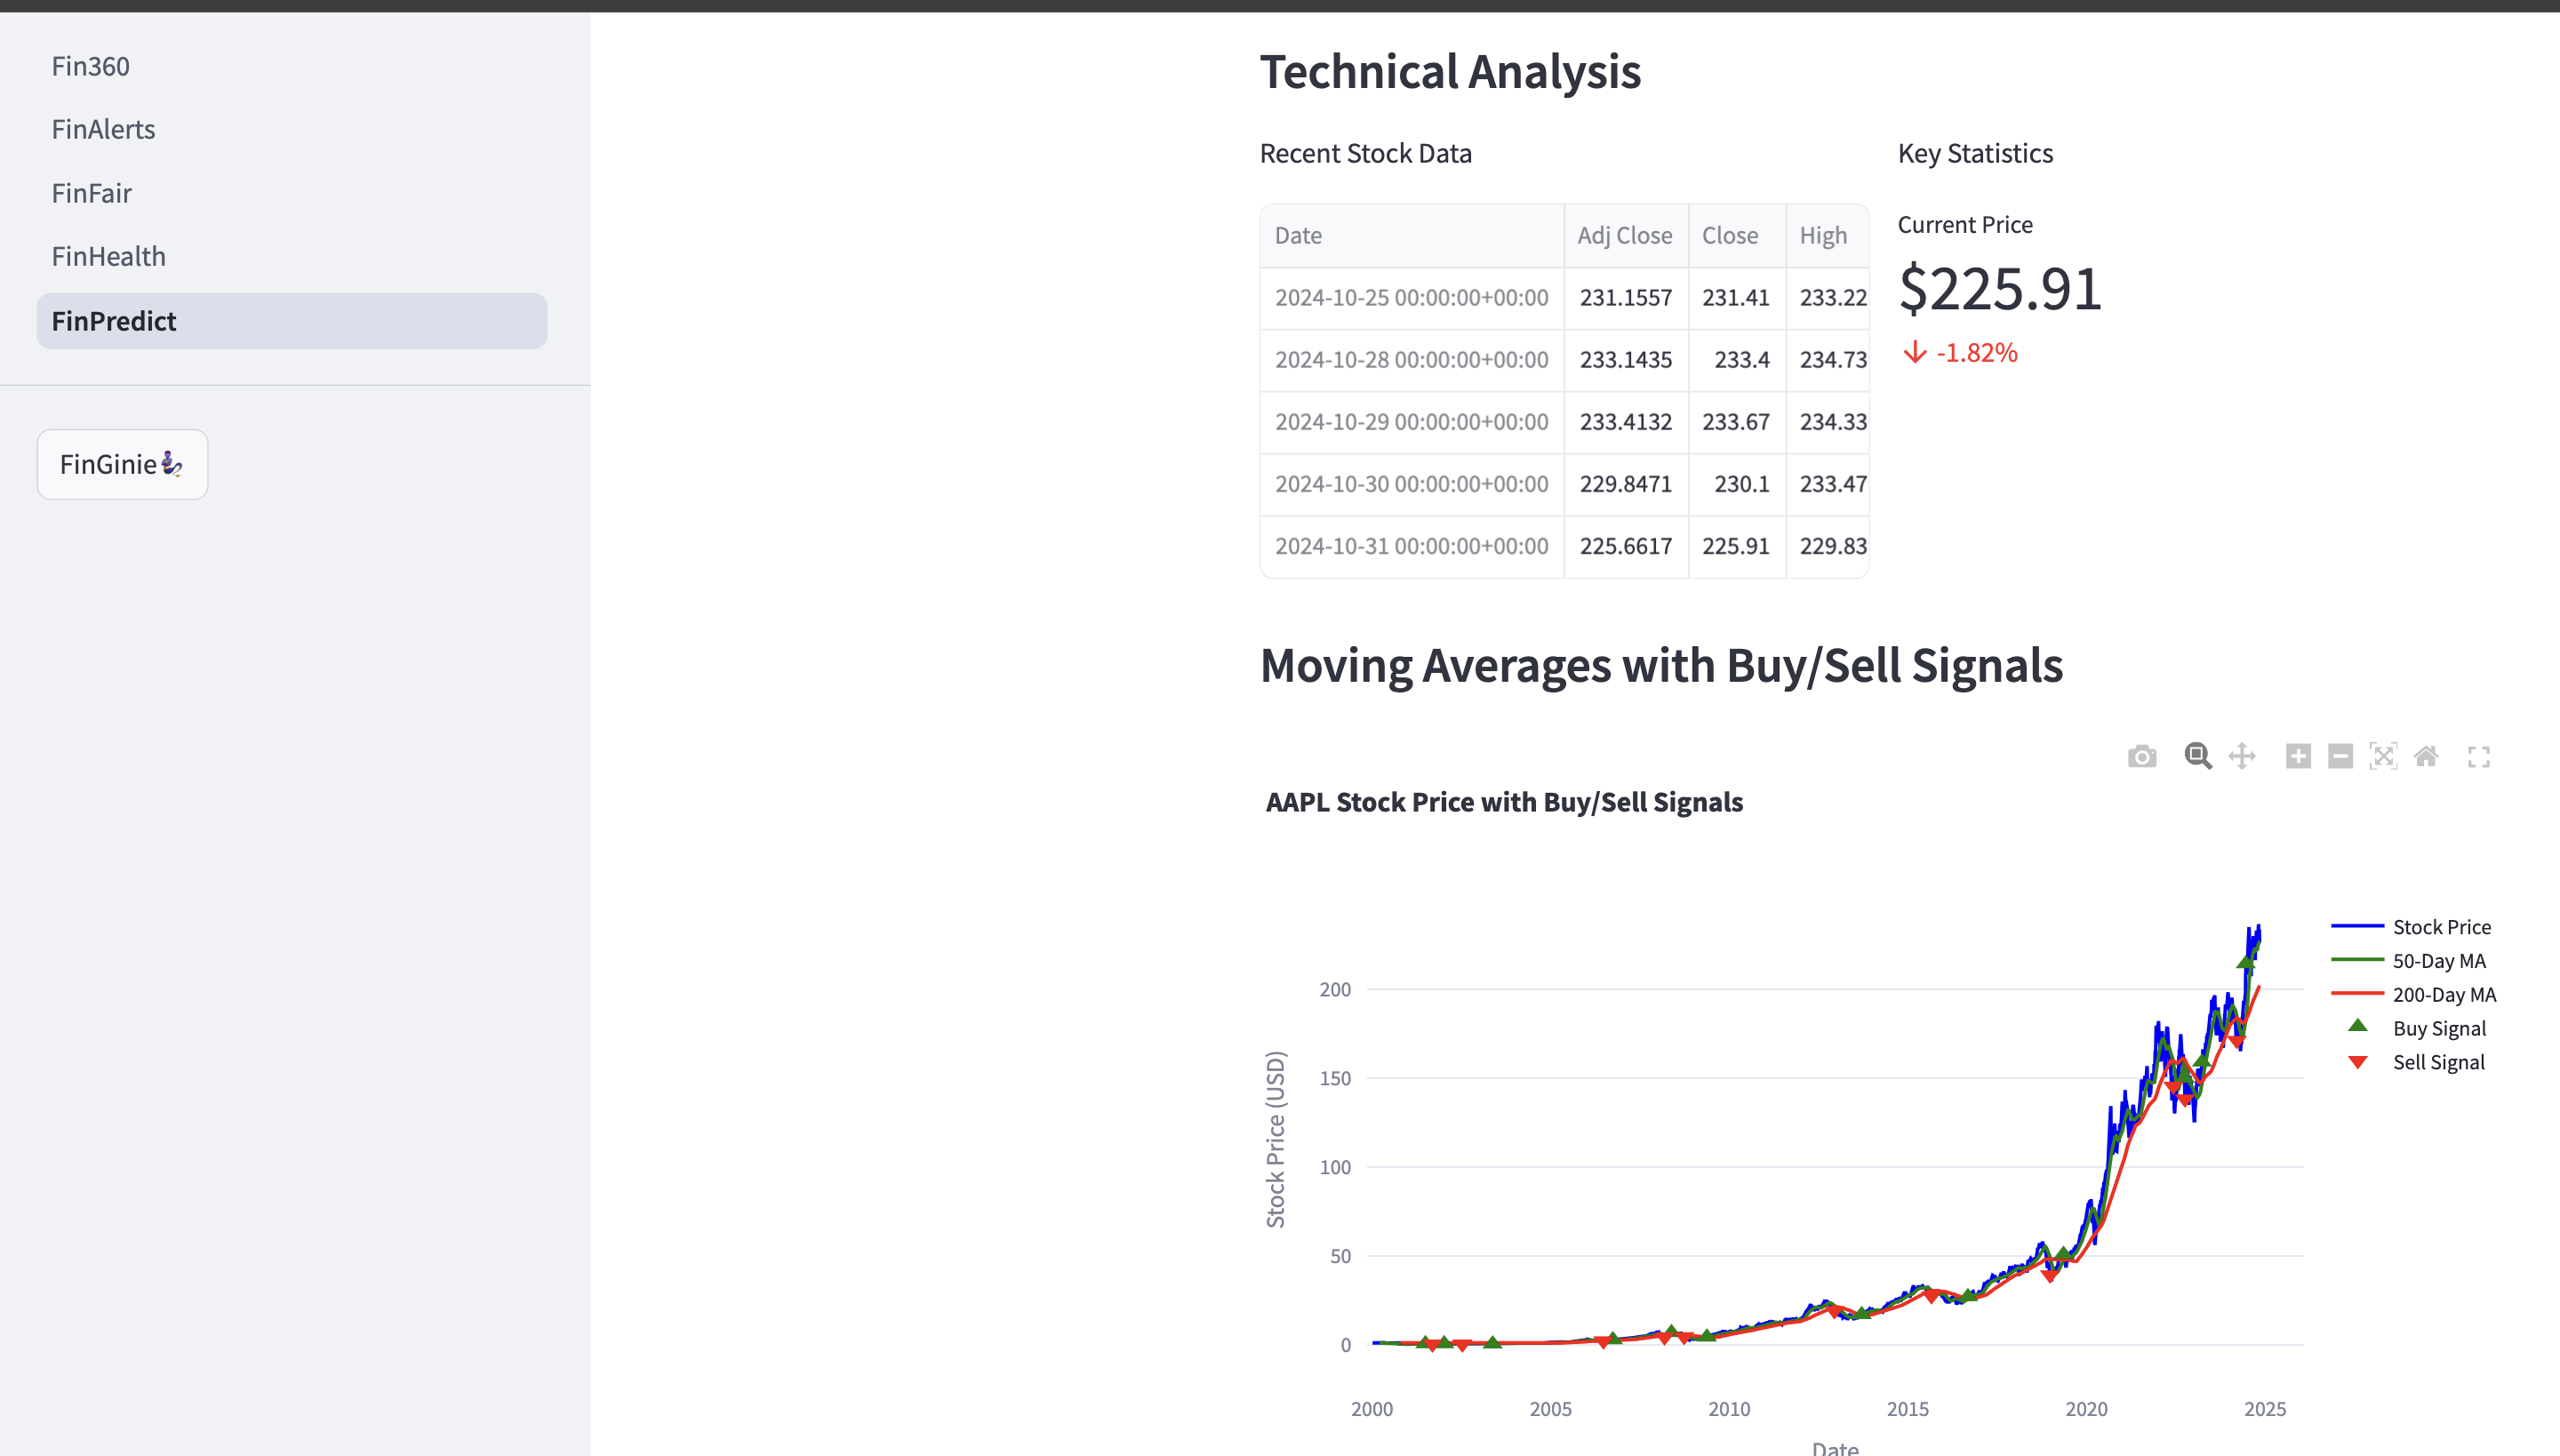
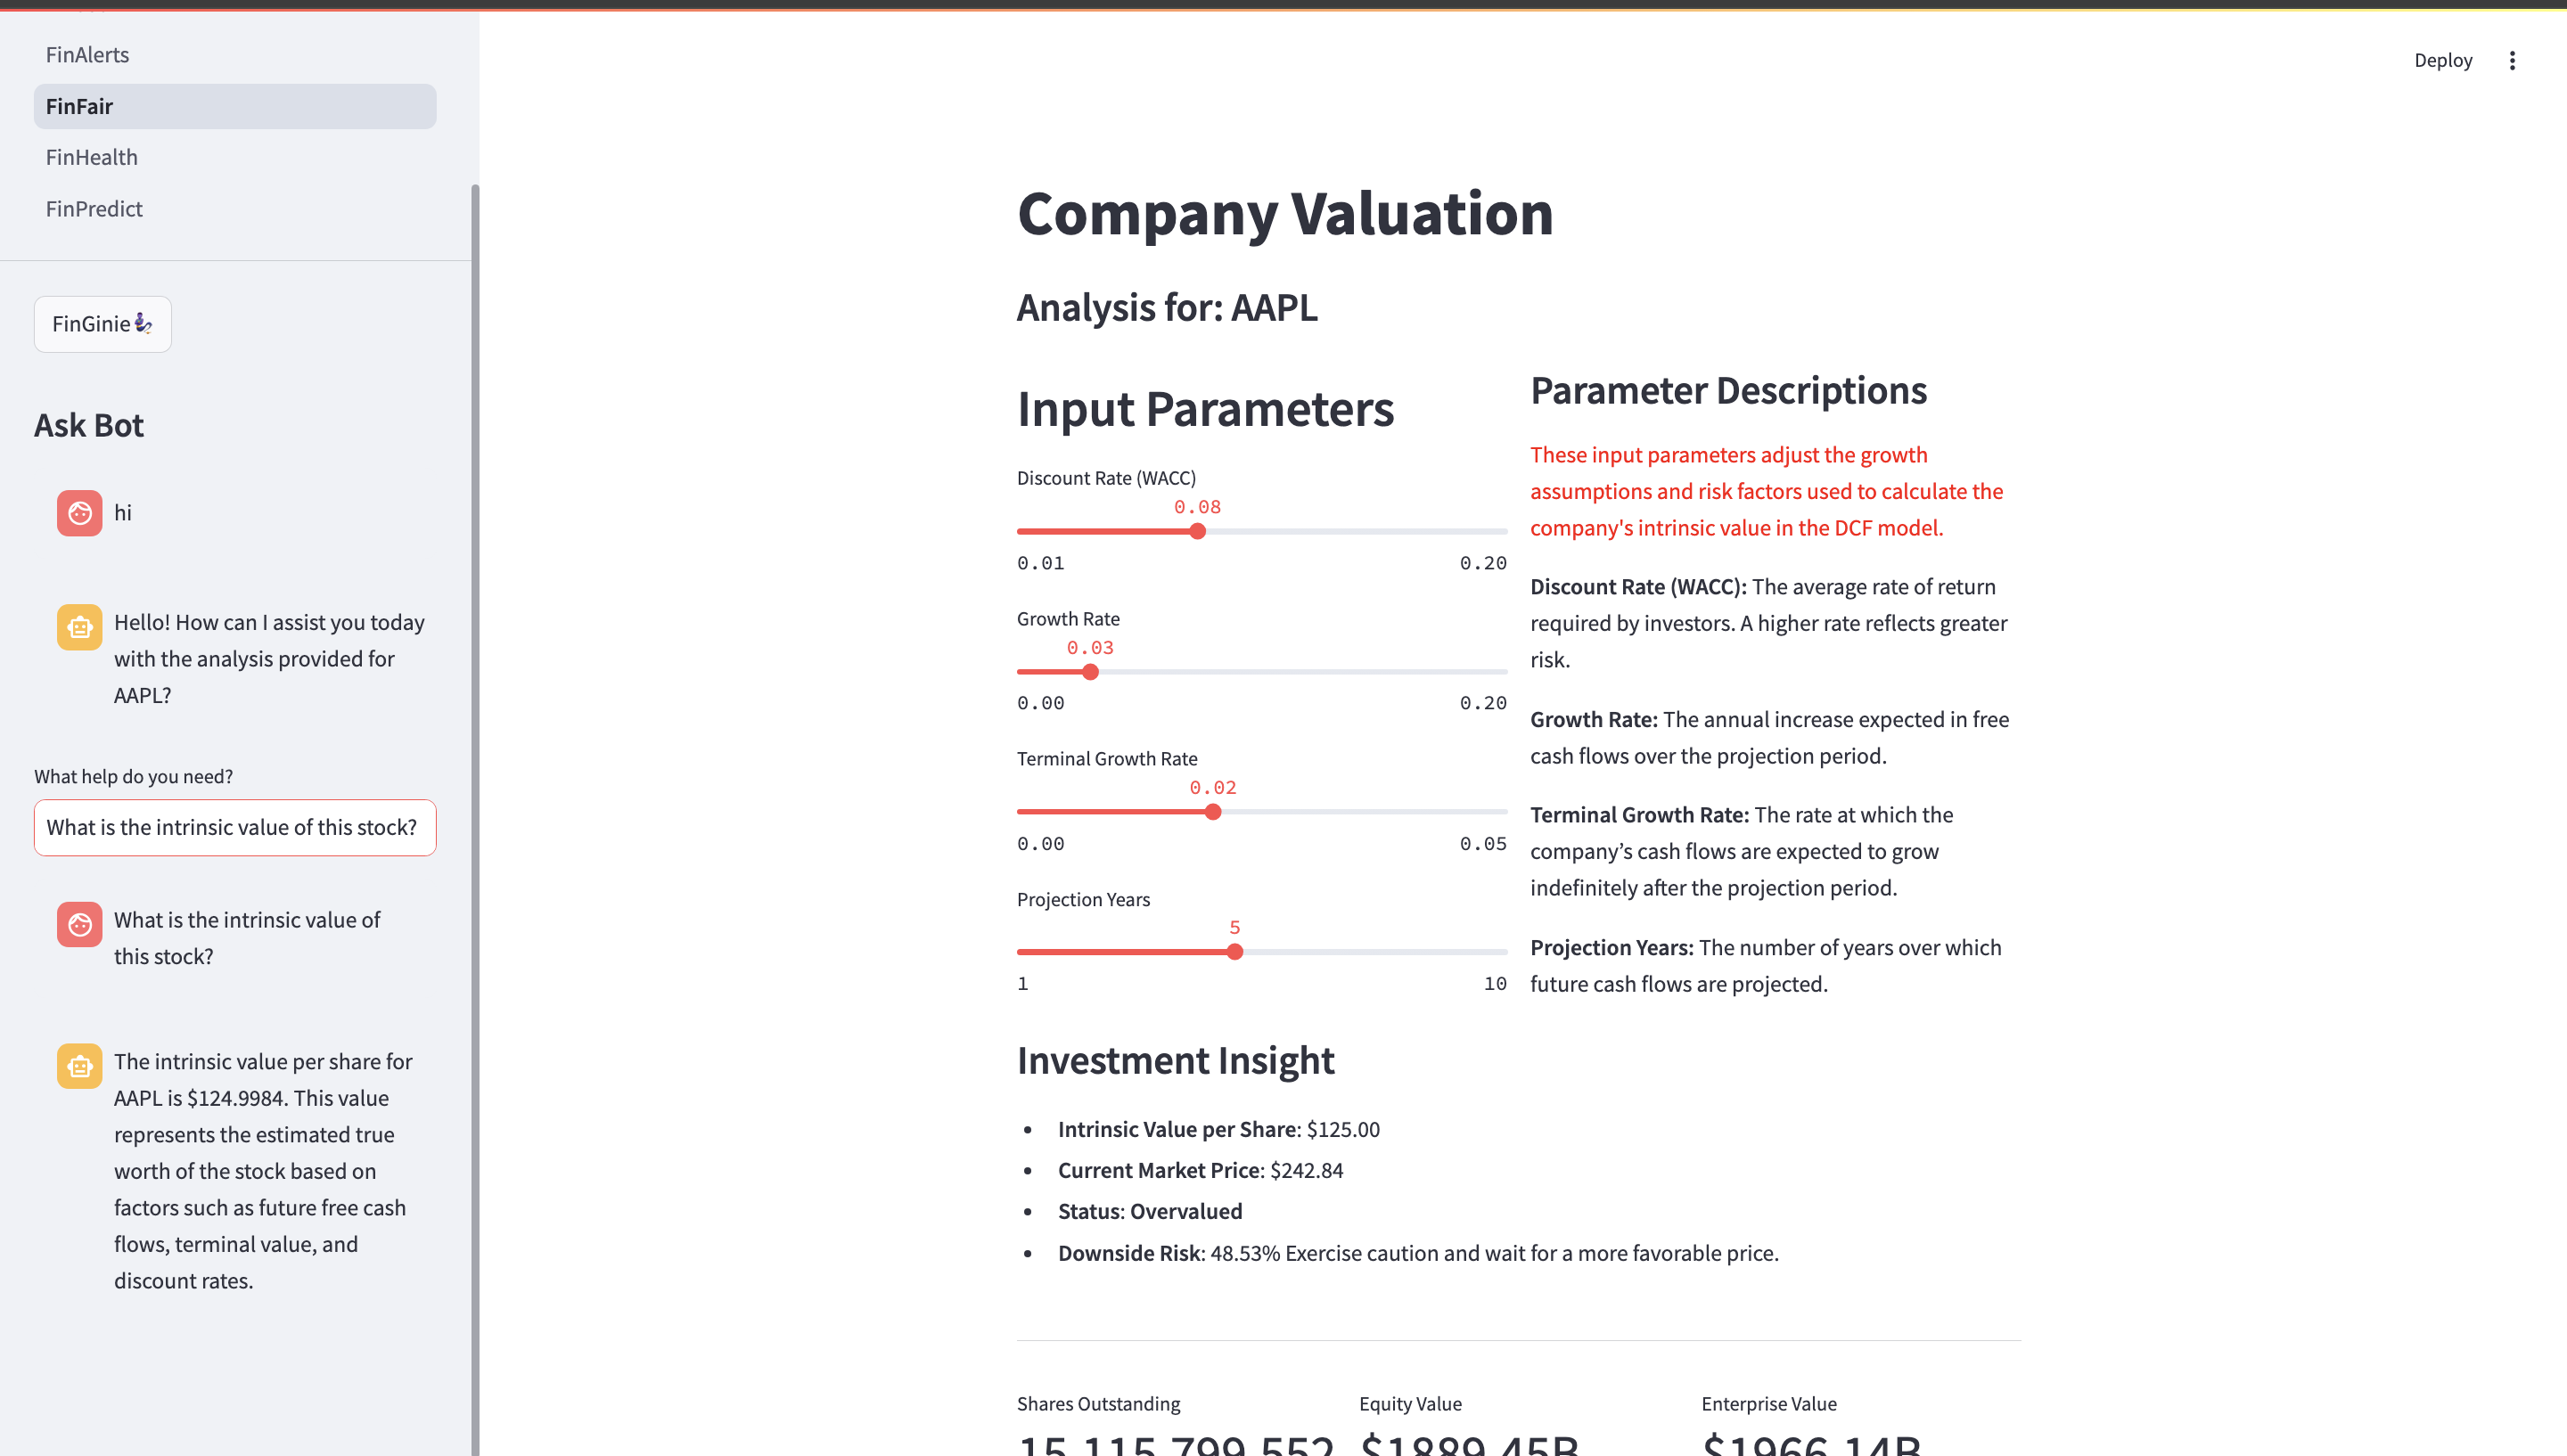
FinBridge is an all-in-one financial analysis platform that simplifies data interpretation and decision-making through five core dashboards: Fin360: Aggregates company-specific financial data, highlights trends like YoY revenue/profit changes, and identifies competitors using SIC codes. FinAlerts: Retrieves the latest company news using Finnhub API to help users make timely, informed decisions. FinFair: Automates Discounted Cash Flow (DCF) analysis to calculate intrinsic stock value, comparing it to the market price to determine over/undervaluation. FinHealth: Converts complex financial metrics (liquidity, profitability, leverage) into an intuitive health score, providing detailed analysis and actionable suggestions. FinPredict: Combines real-time stock data with LSTM-based machine learning for stock price prediction, highlighting buy/sell signals using moving averages.
How we built it
Frameworks & Tools: Streamlit, NumPy, Pandas, Keras, PyTorch APIs: yFinance for financial data, Finnhub for company news, OpenAI for the chatbot Visualization: Matplotlib and Plotly for interactive graphs ML Techniques: LSTM (Long Short-Term Memory) neural networks for stock price predictions with real-time accuracy adjustments. We focused on making FinBridge user-friendly while ensuring the backend handles heavy financial computations efficiently.
Challenges we ran into
Data Complexity: Processing and cleaning fragmented financial data from multiple sources was time-consuming. ML Model Efficiency: Balancing prediction accuracy with dashboard speed required tuning the LSTM model. Visualization: Designing clean, intuitive dashboards to convey complex metrics effectively to non-experts. APIs Integration: Ensuring seamless data retrieval from yFinance and Finnhub while maintaining low latency.
Accomplishments that we're proud of
Successfully developed an end-to-end financial analysis tool that combines financial health, stock prediction, and DCF valuation. Built an accurate LSTM-based stock price predictor that highlights buy/sell signals for actionable insights. Simplified financial data analysis for non-experts, making complex metrics accessible through an intuitive scoring system and visuals. Integrated multiple financial tools into a cohesive, user-friendly platform.
What we learned
Machine Learning: Gained deeper insights into fine-tuning LSTM models for time-series stock predictions. APIs: Learned to manage and integrate real-time financial data effectively. UI/UX Design: Simplified the presentation of intricate financial metrics for a broader audience. Financial Analysis: Mastered critical financial concepts like DCF valuation, NOPAT, and metric scoring systems.
What's next for FinBridge
Enhanced ML Models: Improve accuracy by increasing LSTM epochs and exploring advanced models like Transformer-based architectures. Personalized Recommendations: Introduce AI-driven suggestions for portfolio diversification. Real-Time Alerts: Add event-based notifications for major financial updates. User Customization: Enable users to upload and analyze custom financial datasets. Mobile App: Develop a mobile version for on-the-go financial analysis.


Log in or sign up for Devpost to join the conversation.