Inspiration
We wanted to build a financial application that would visualize spending habits and suggests articles and videos that improve your financial literacy. This is why we created FinTrak, an application that shows in detail where your money is going and shows you resources to learn how to manage your money better.
What it does
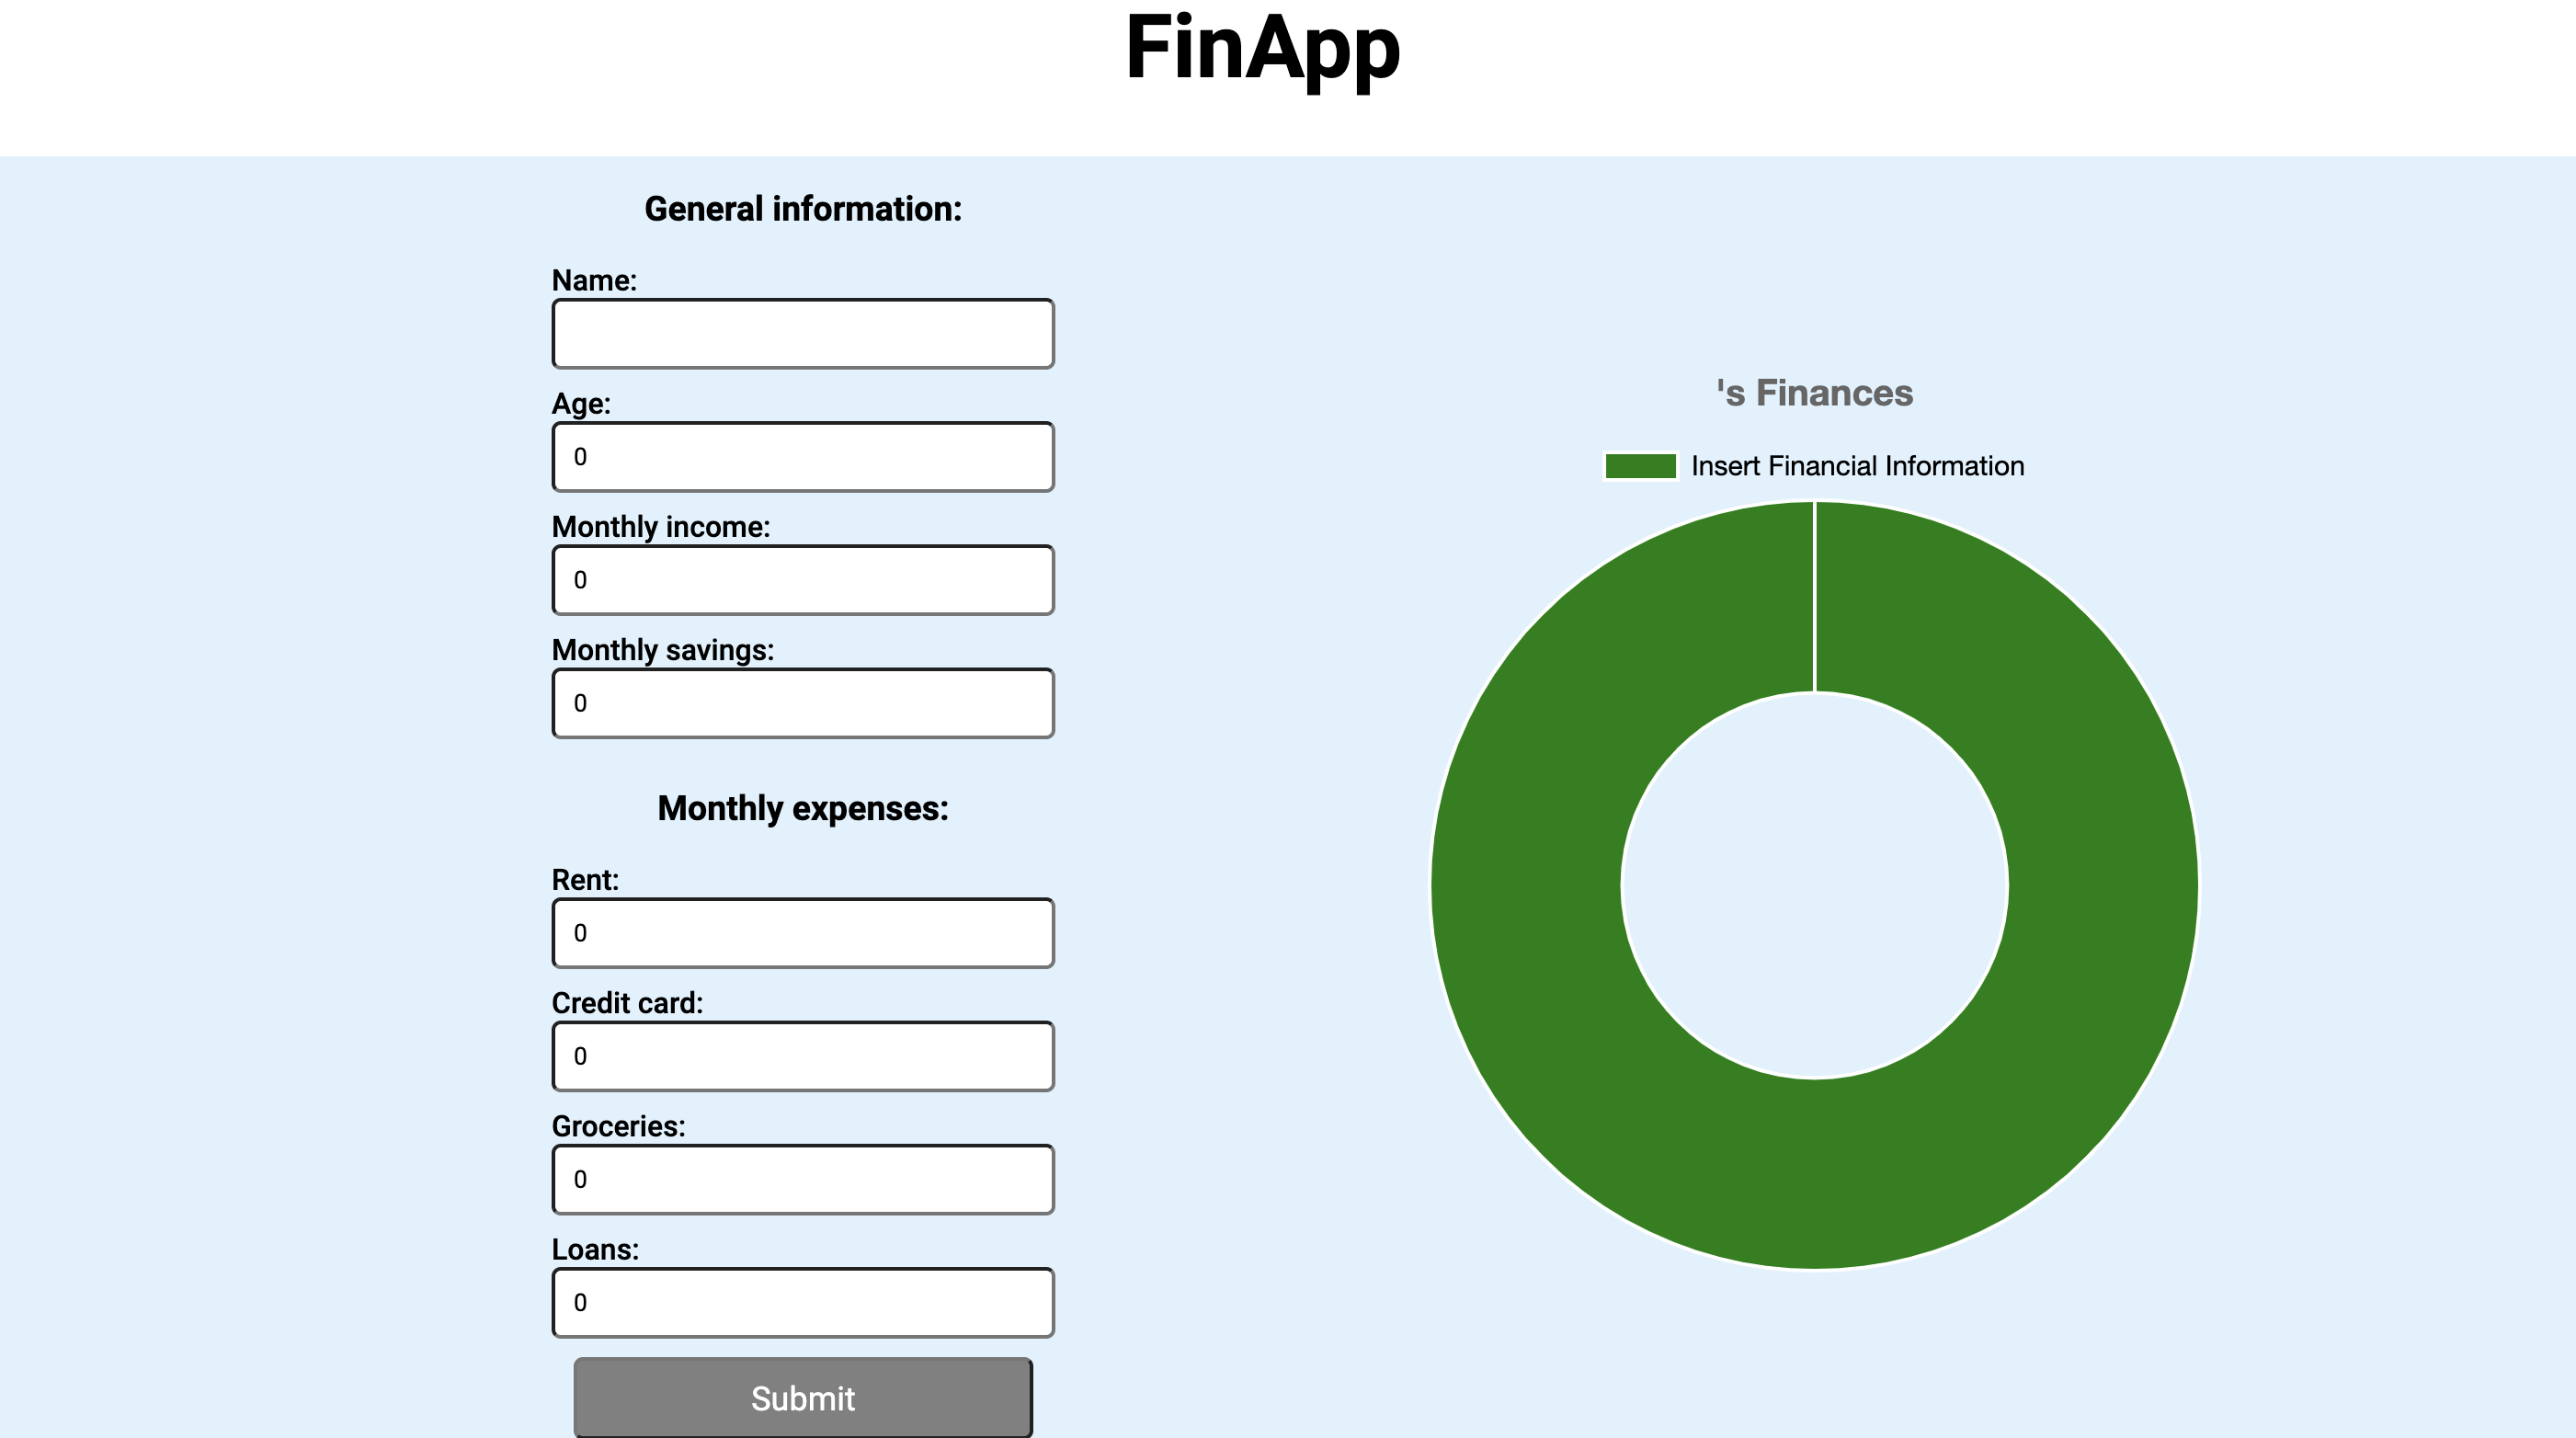
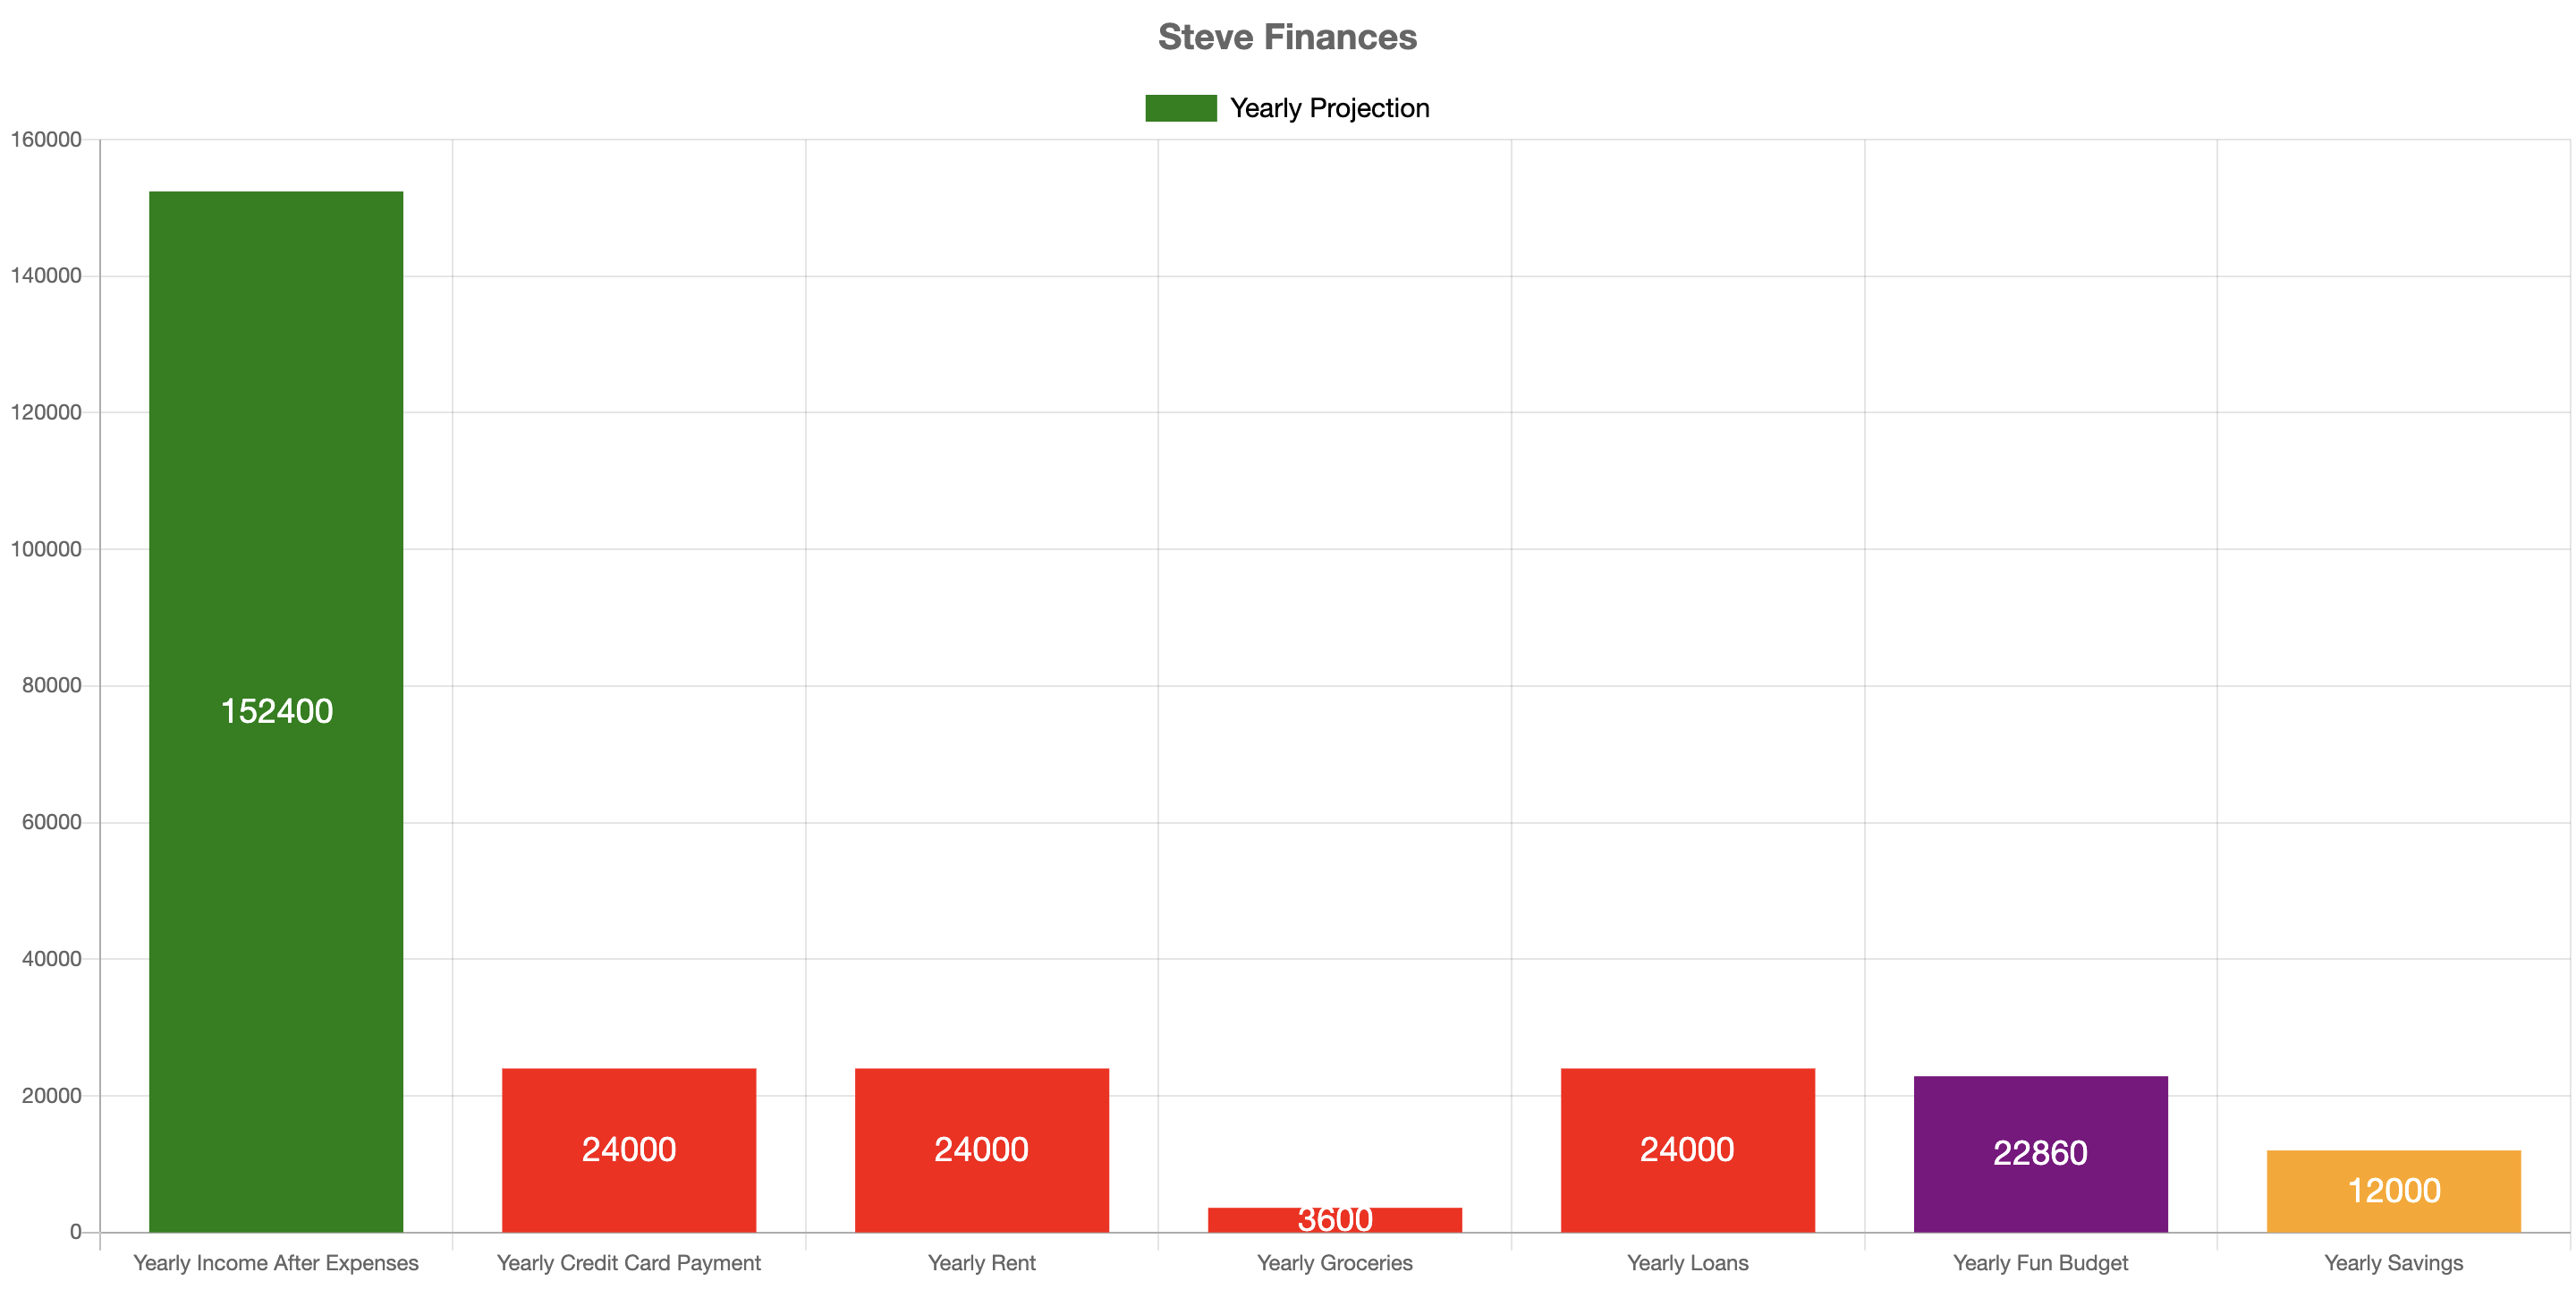
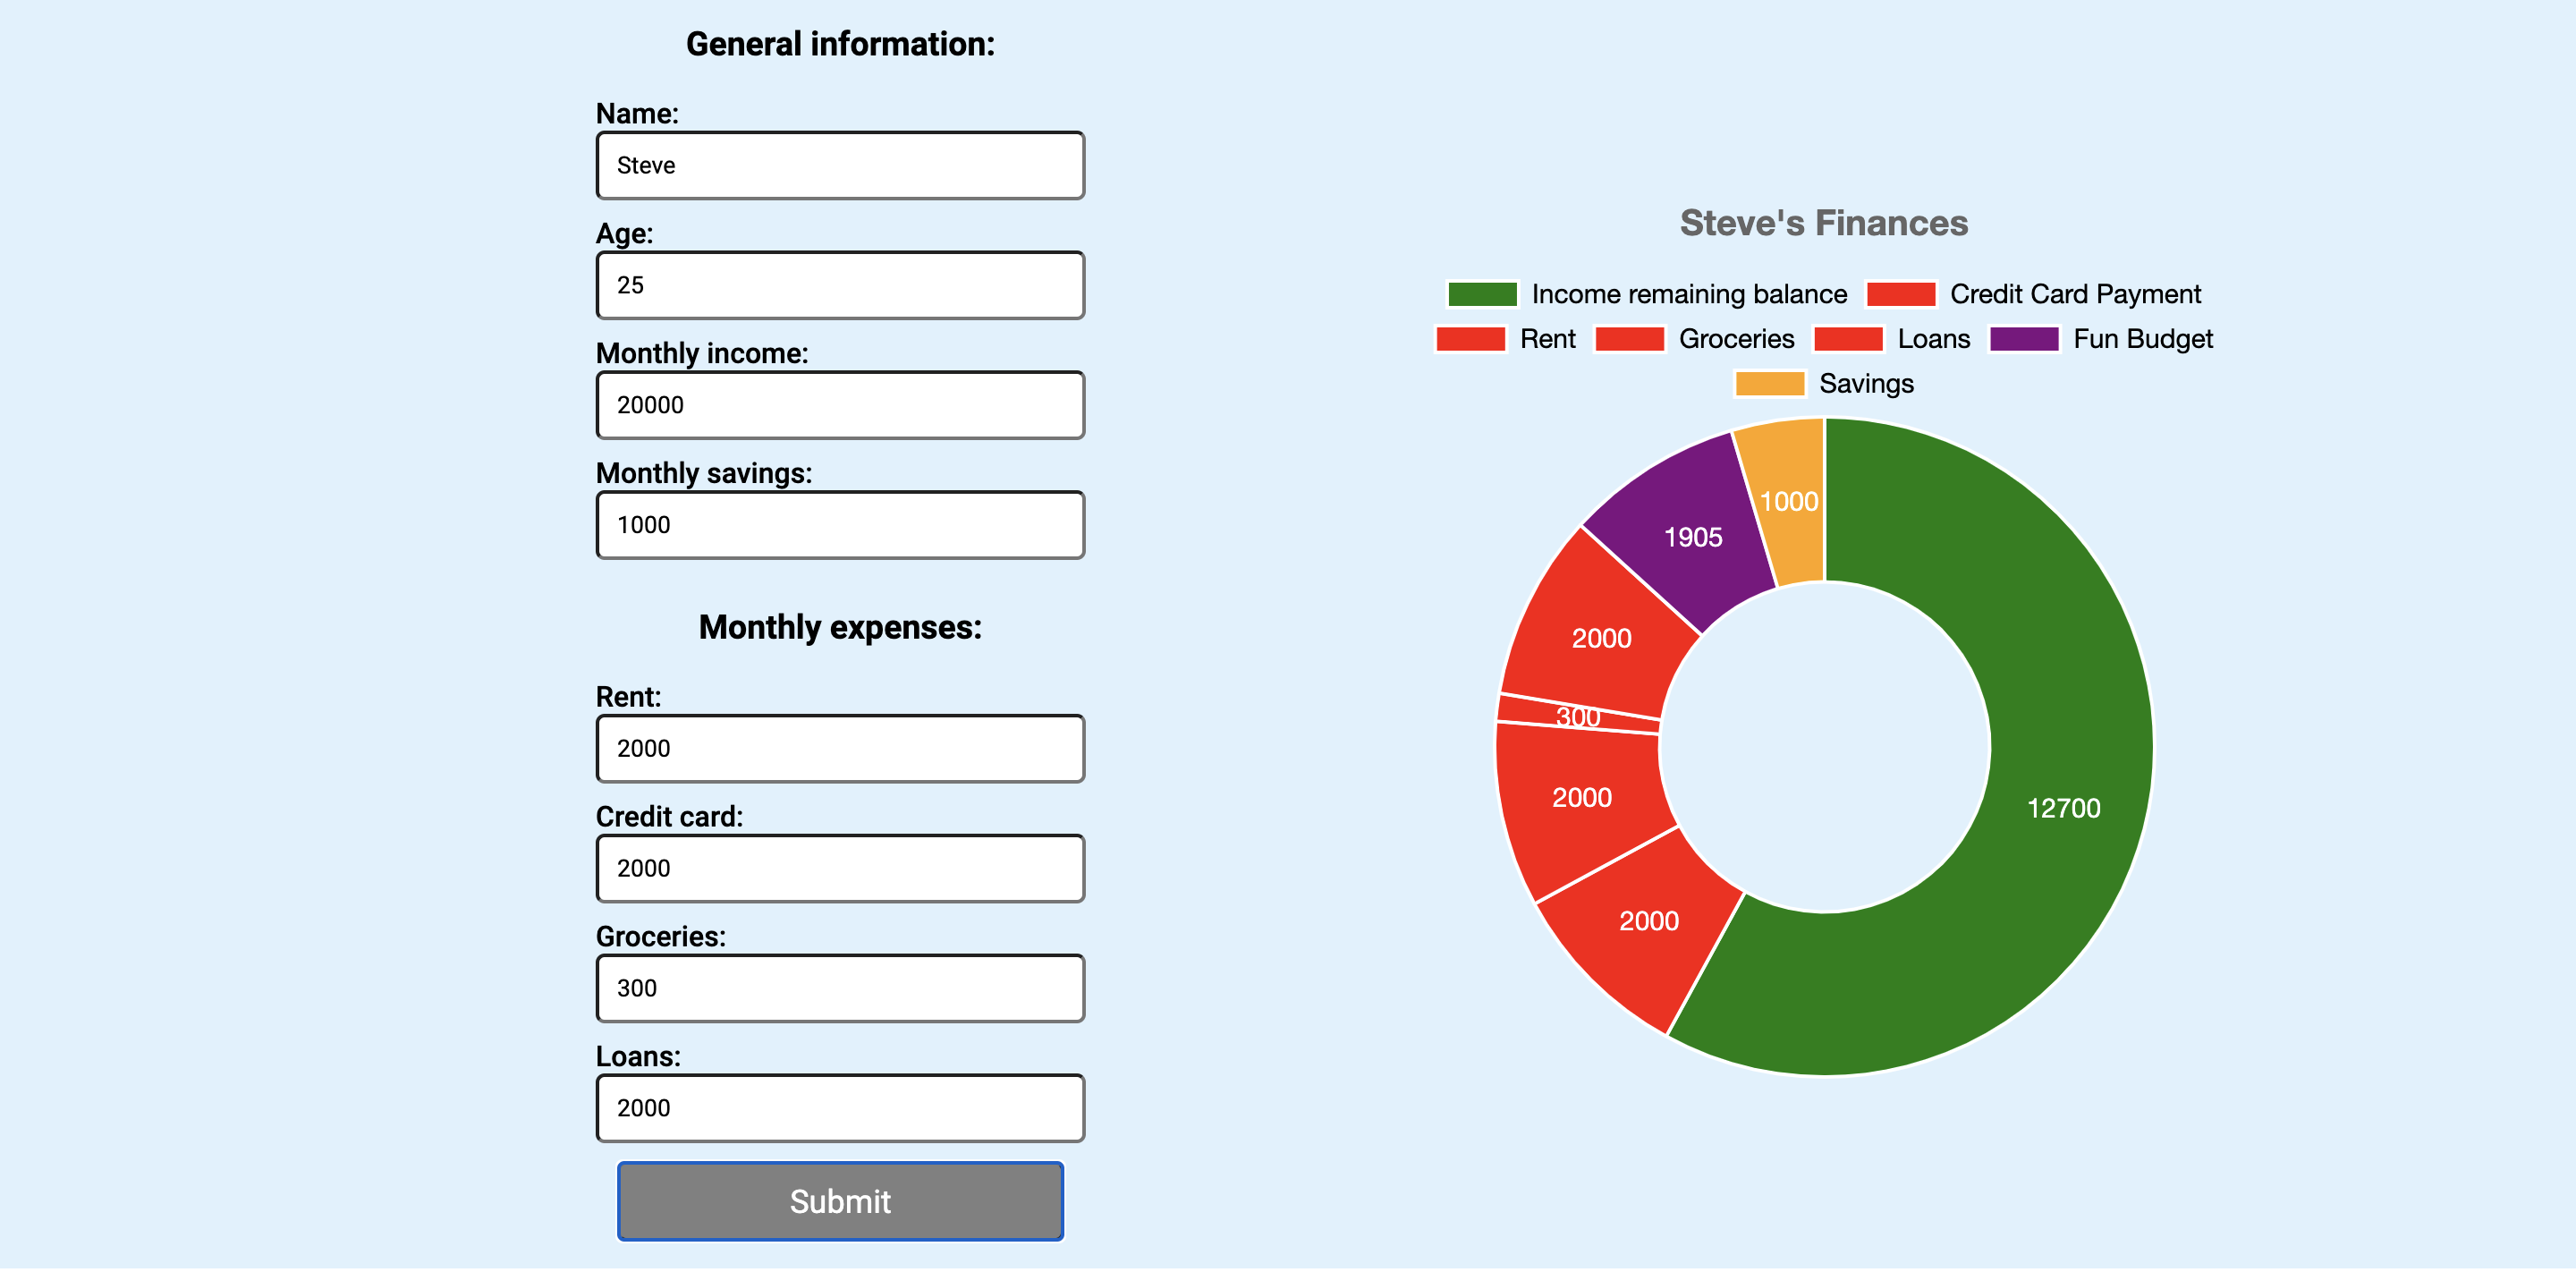
We conceptualized and developed a financial web application that allows users to input their expenses and income to display a pie chart with all of their information dynamically. The app also shows yearly projected costs to inform the user better.
How we built it
React was our front-end framework of choice Chart.js was the chart library we used for financial visualization React-chart-js-2 is a React wrapper for Chart.js Axios was used for fetching API data SASS as our CSS preprocessor
Challenges we ran into
We were having trouble with positioning and styling.
Accomplishments that we're proud of
We are proud to provide a smooth user experience. We leveraged APIs from YoutubeAPI and NewsApi
What we learned
Wireframing is very important when designing a project. We also learn about pull requests, code reviews.
What's next for FinTrak
We plan to add more functionality to our application, and we will add a backend.


Log in or sign up for Devpost to join the conversation.