-
-
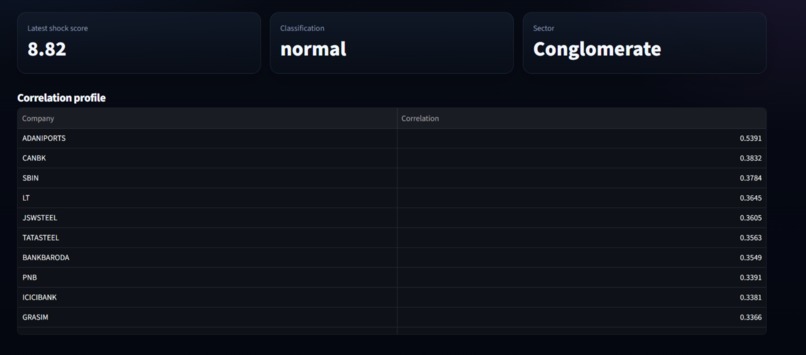
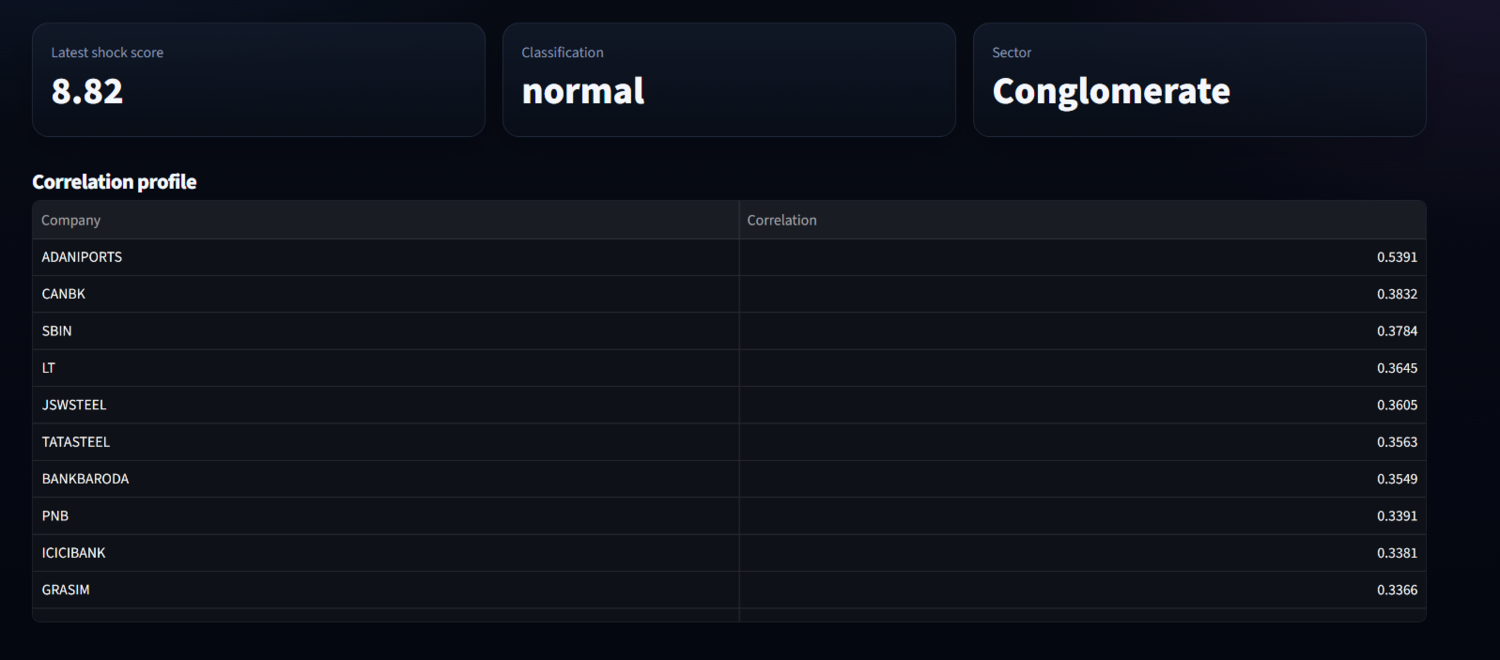
Detailed view panel showing information for a specific entity or node.
-
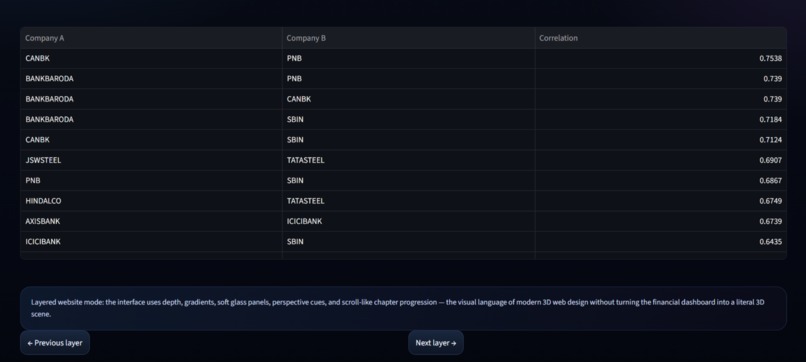
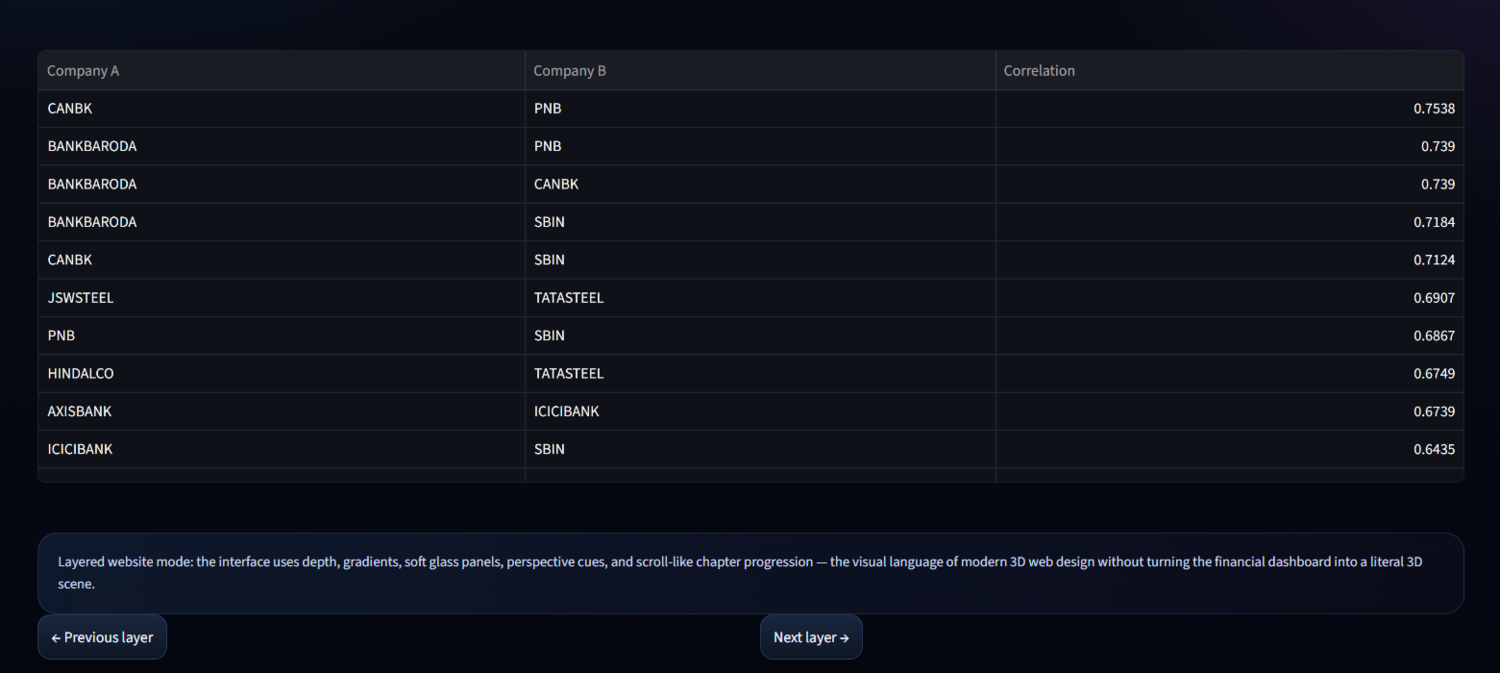
Data table showing detailed network connection metrics.
-
Data table displaying network node statistics.
-
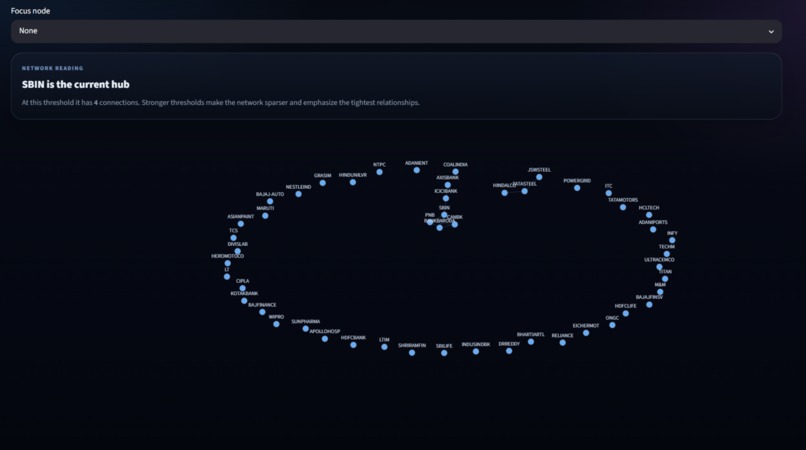
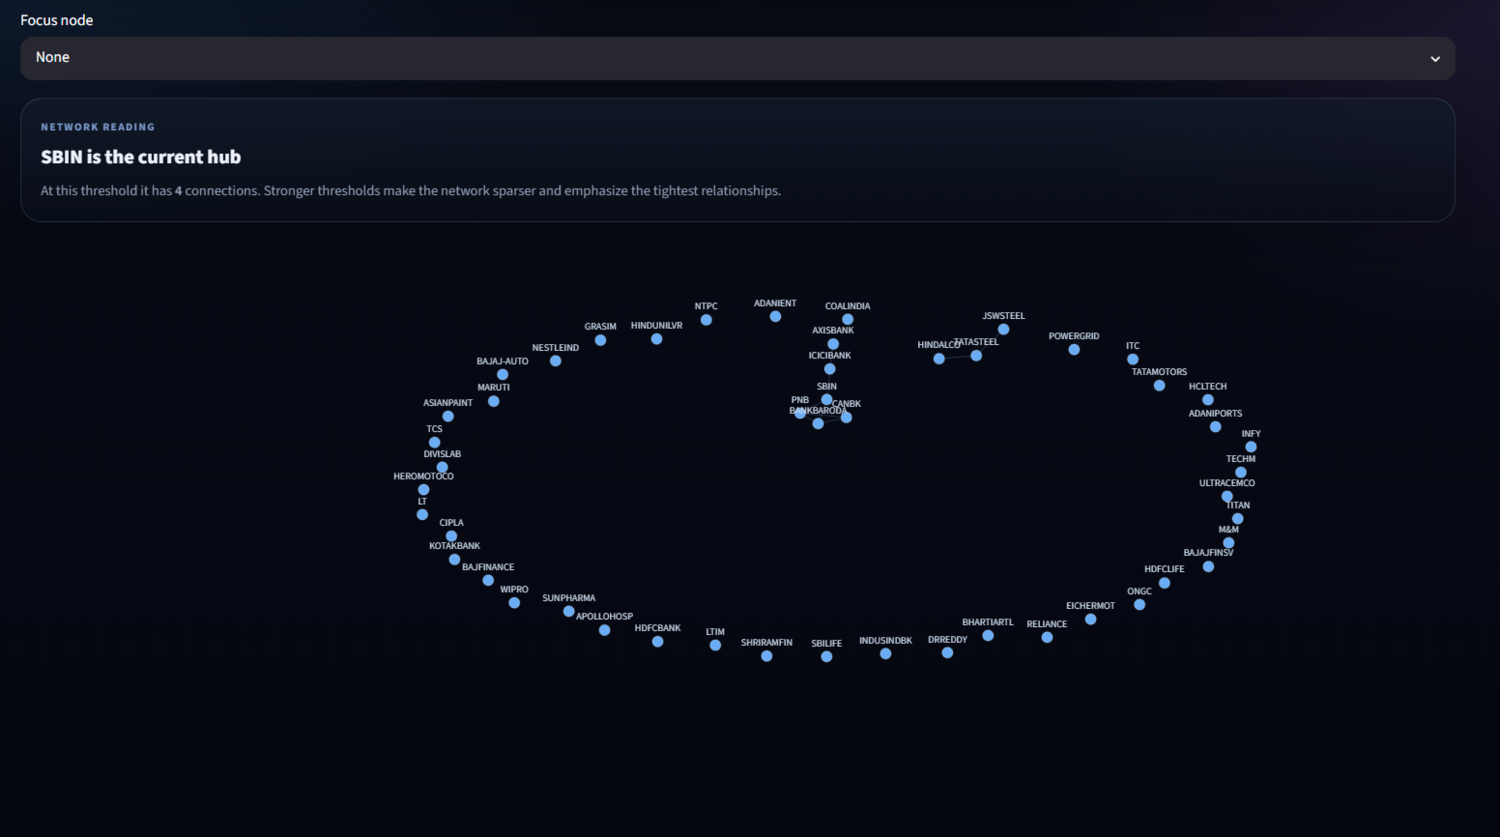
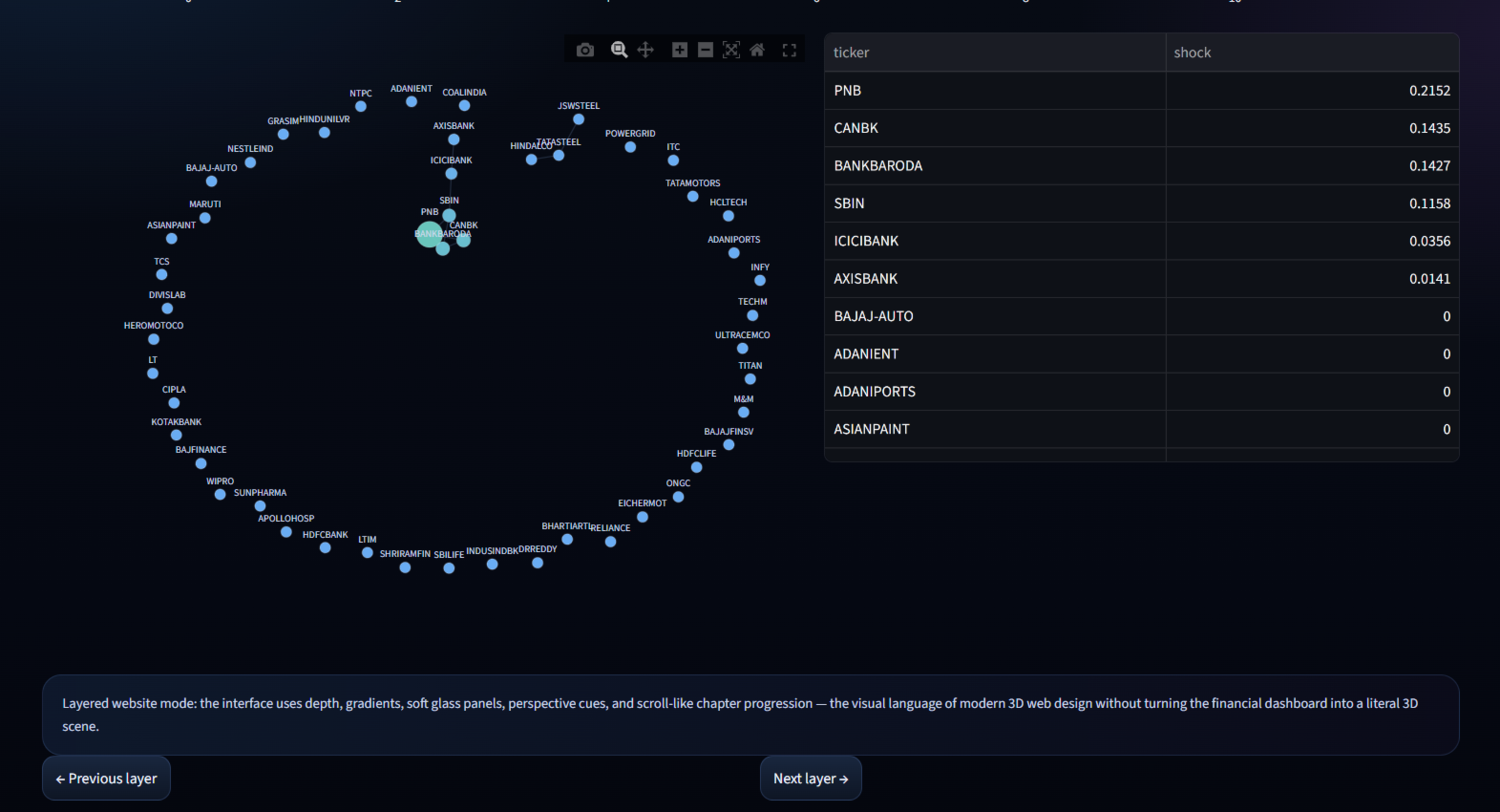
Visualization of a circular network map.
-
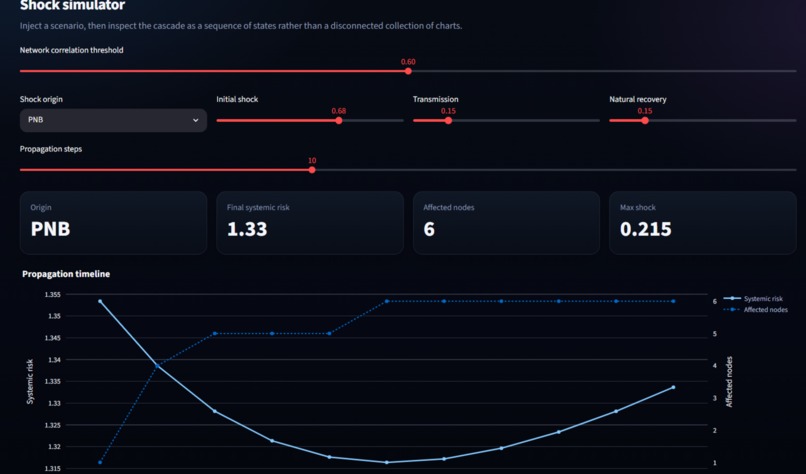
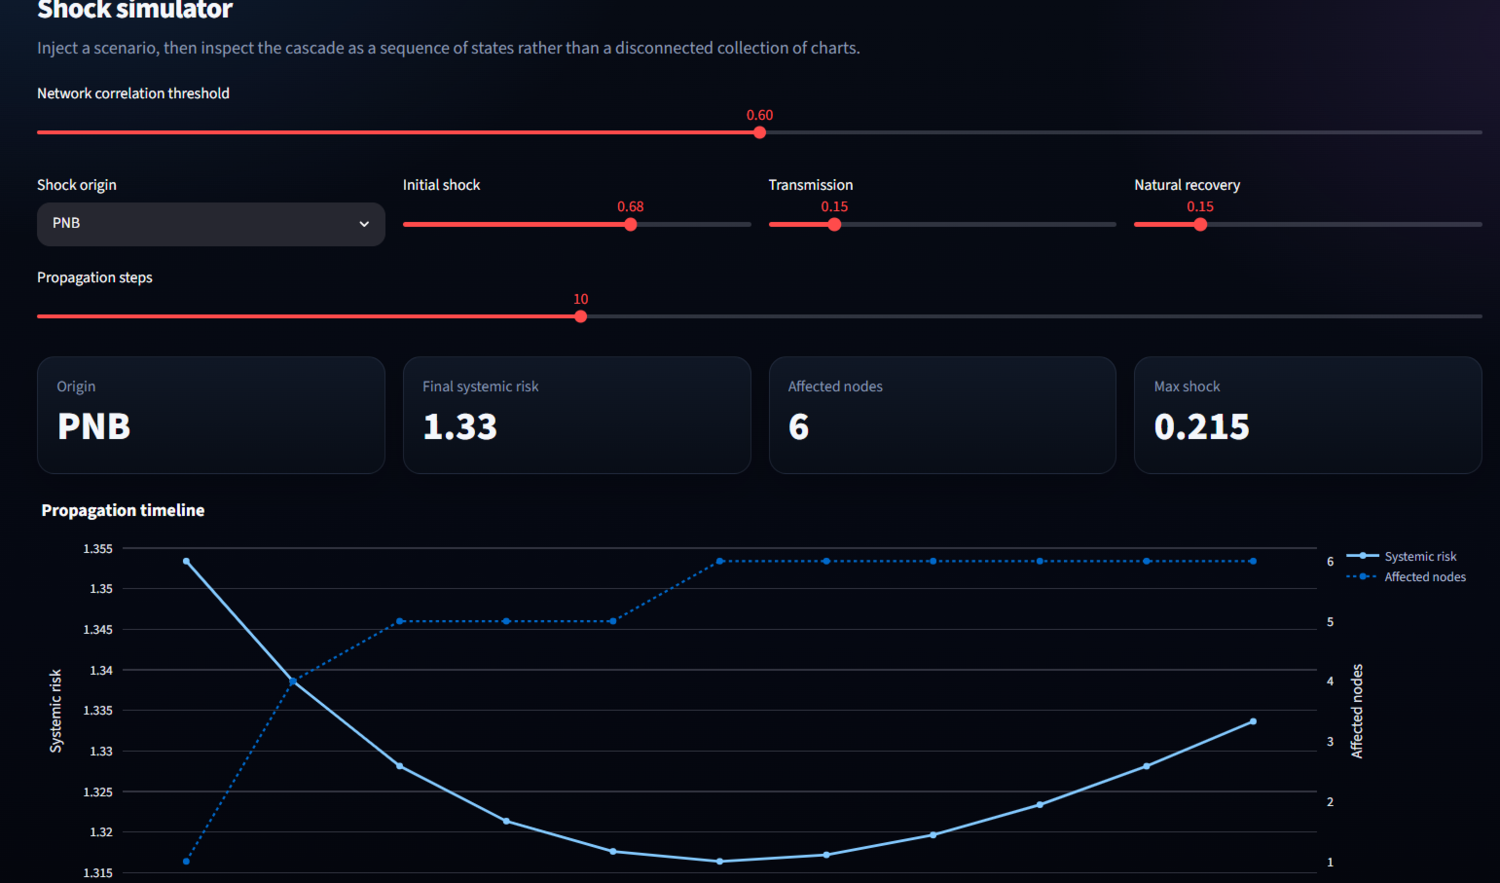
"Shock simulator" dashboard with a chart tracking the contagion index over time.
-
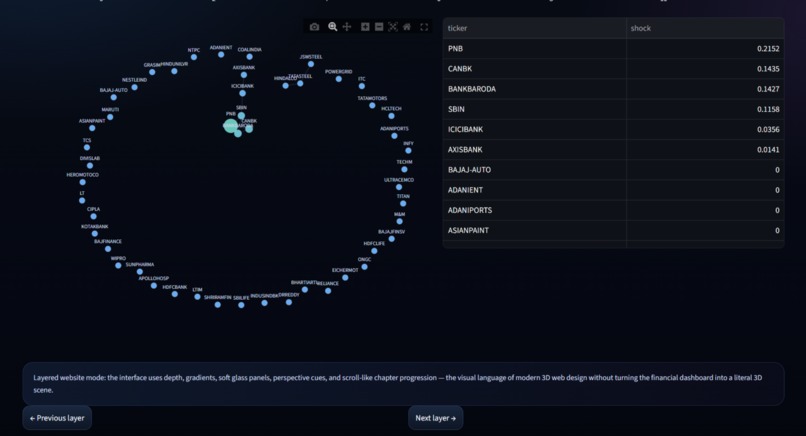
Network map visualization highlighting a specific node and its properties in a side panel.
-
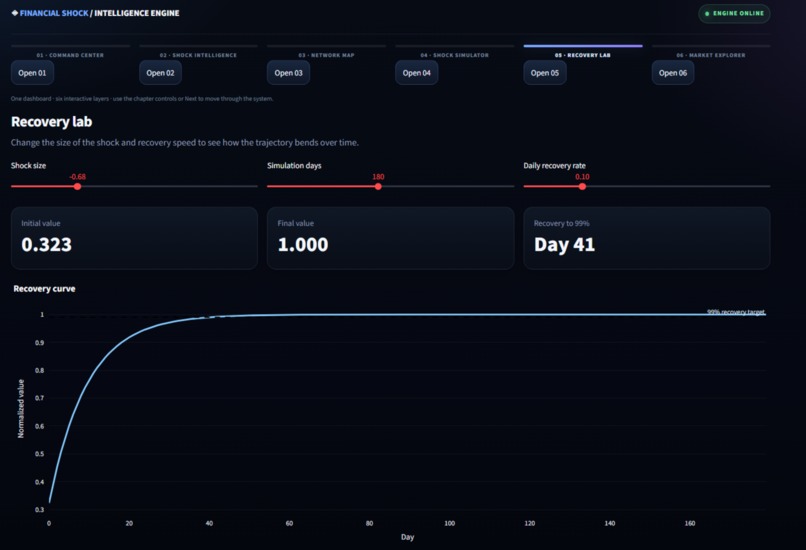
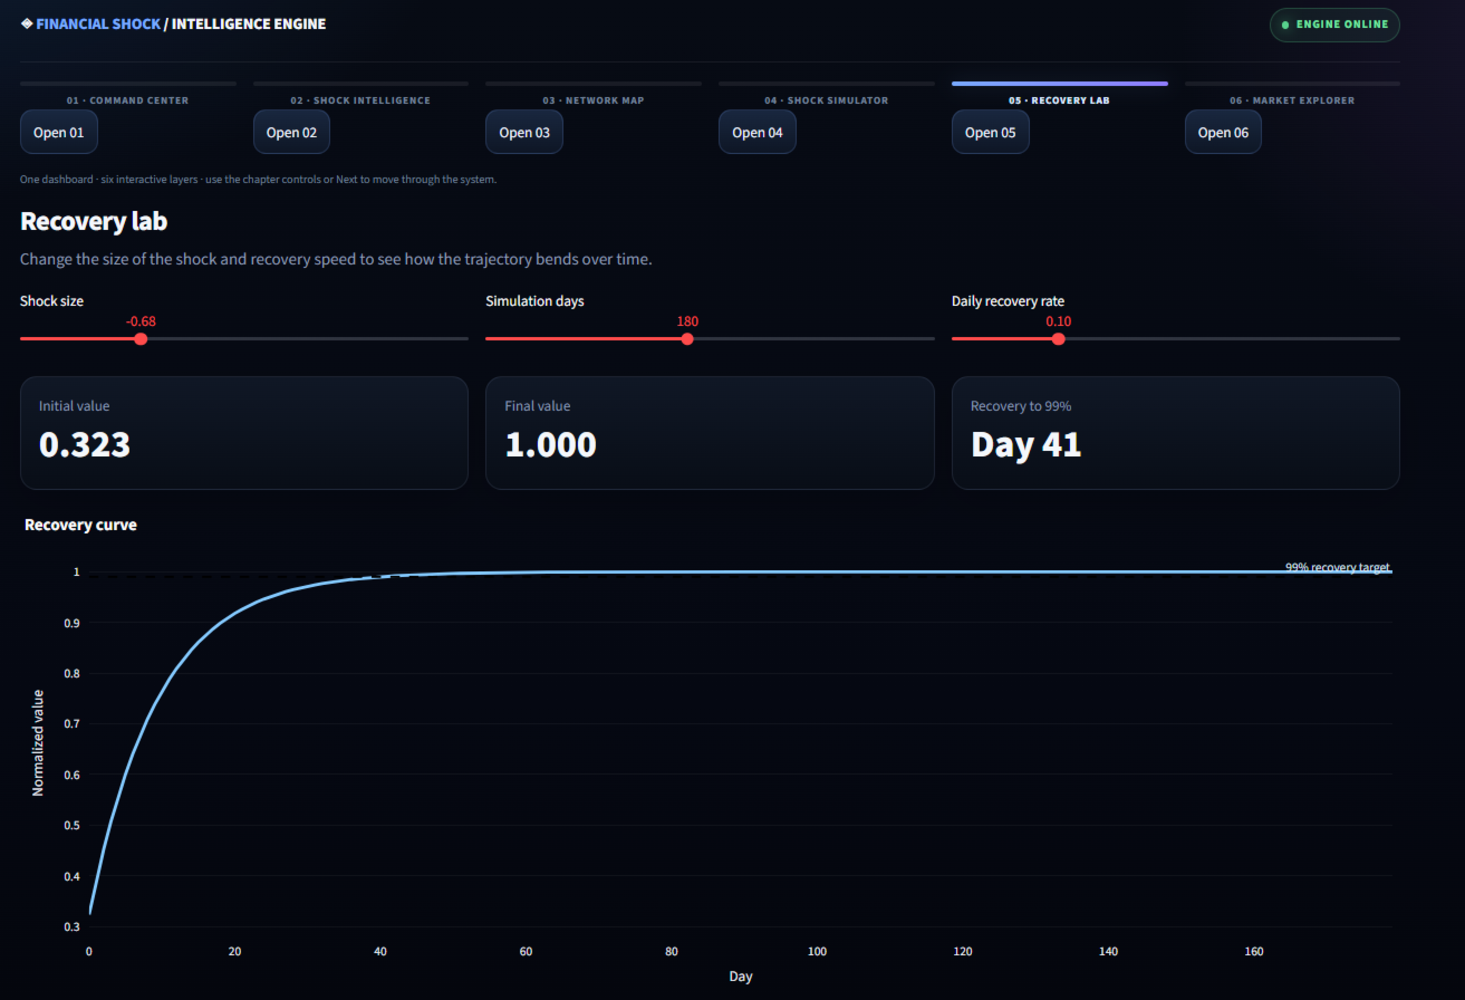
"Recovery lab" dashboard with a chart tracking the recovery index over time.
-
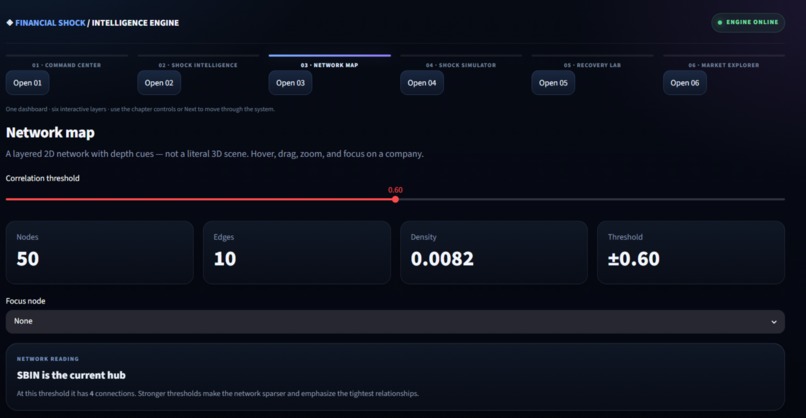
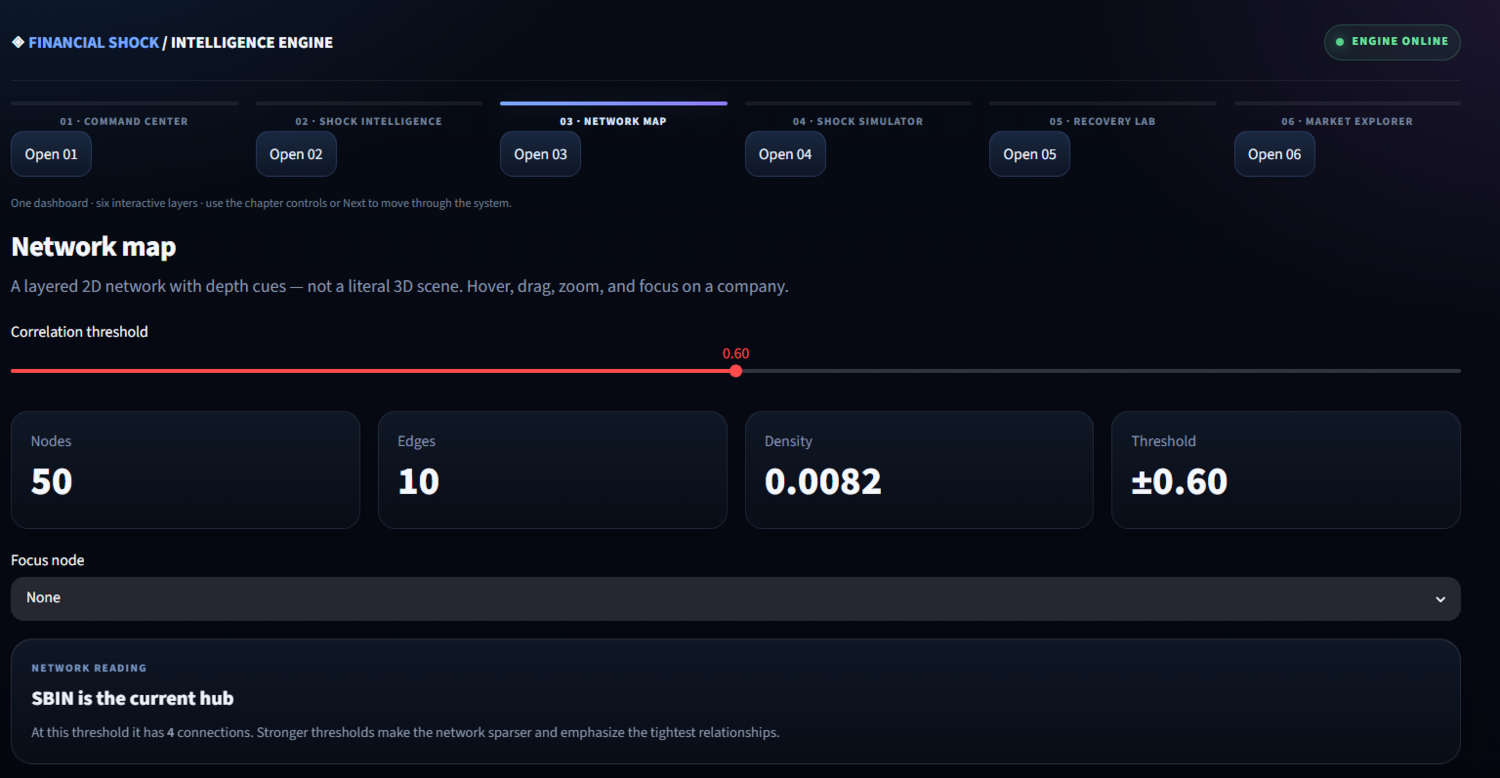
"Network map" overview panel showing key metrics like contagion threshold.
-
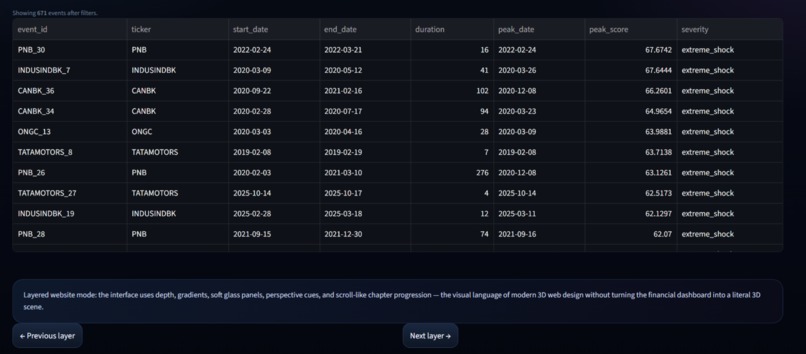
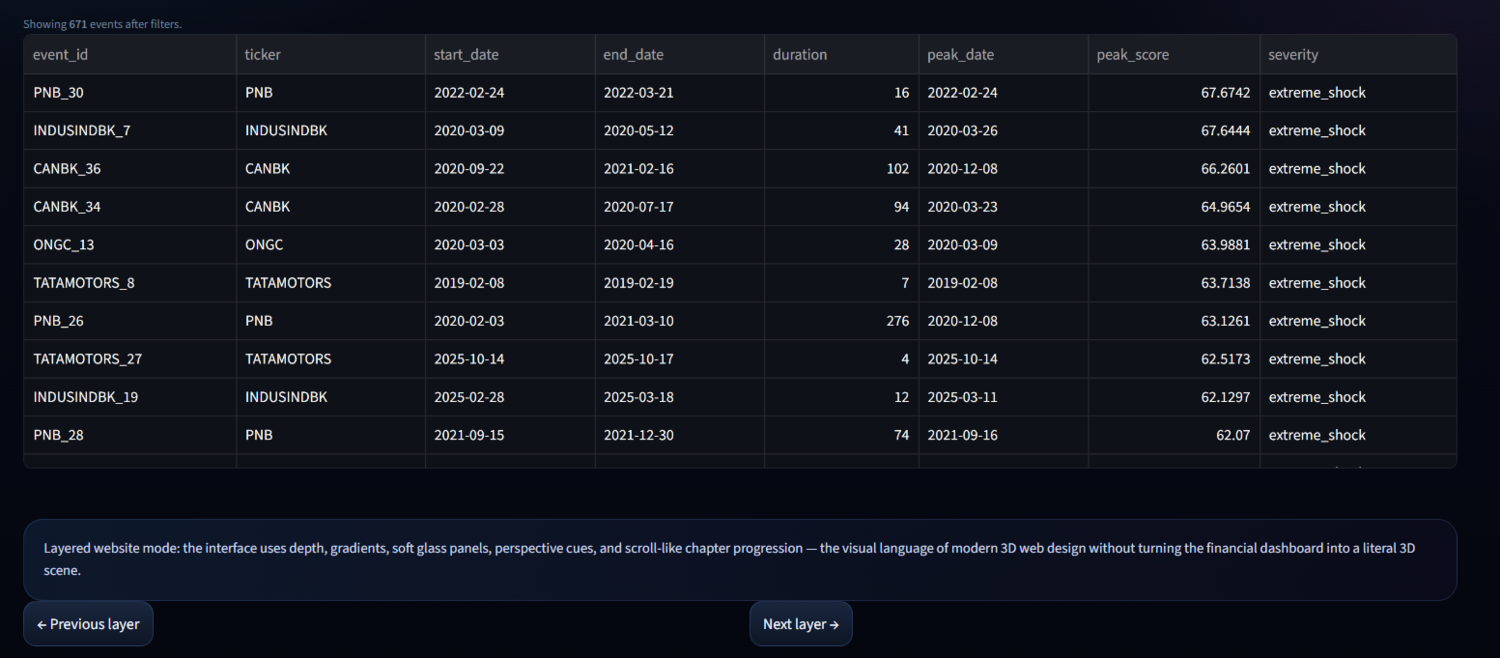
Data table listing specific shock events and their details.
-
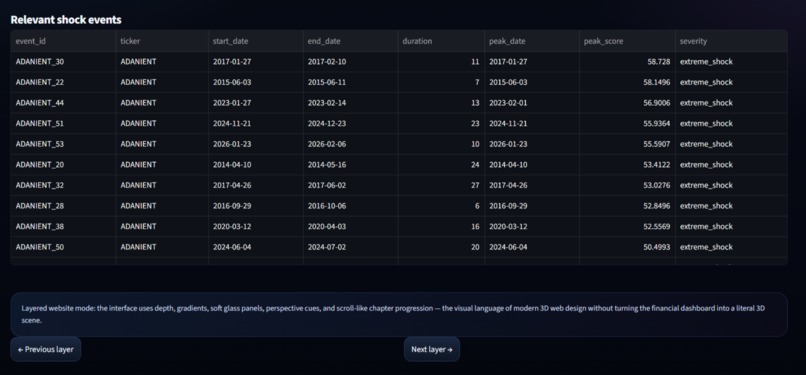
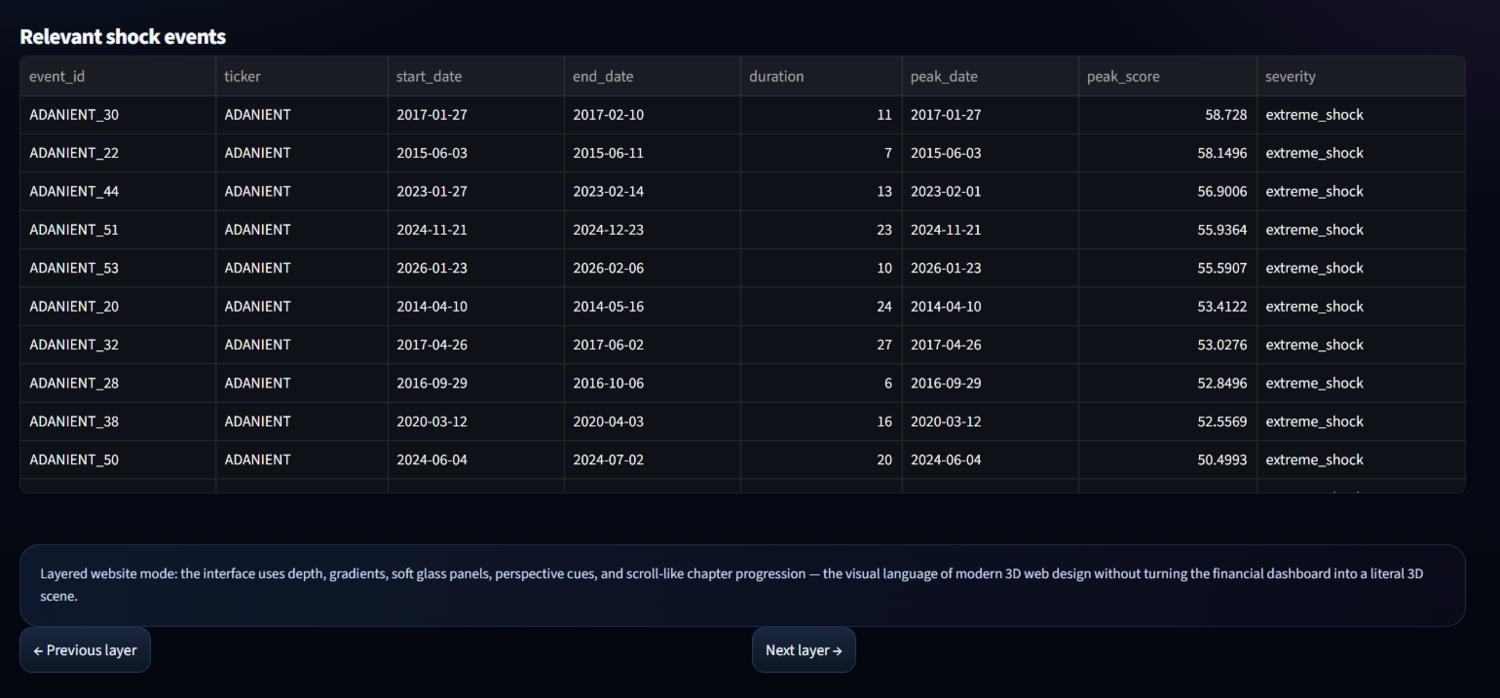
Data table listing "Relevant shock events" with dates and values.
-
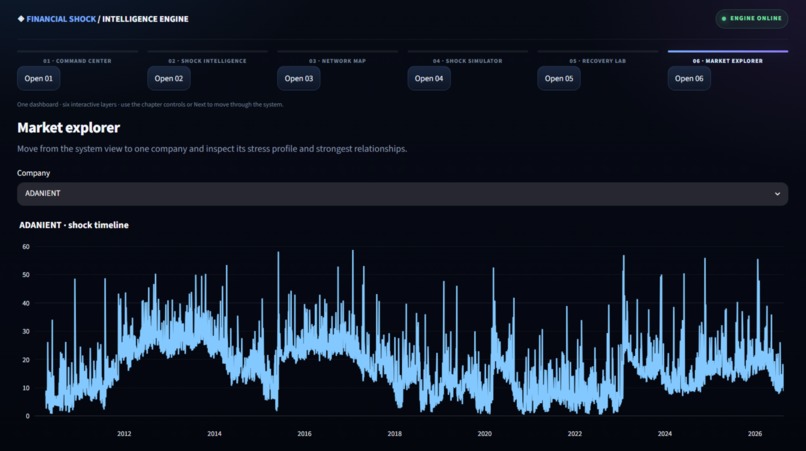
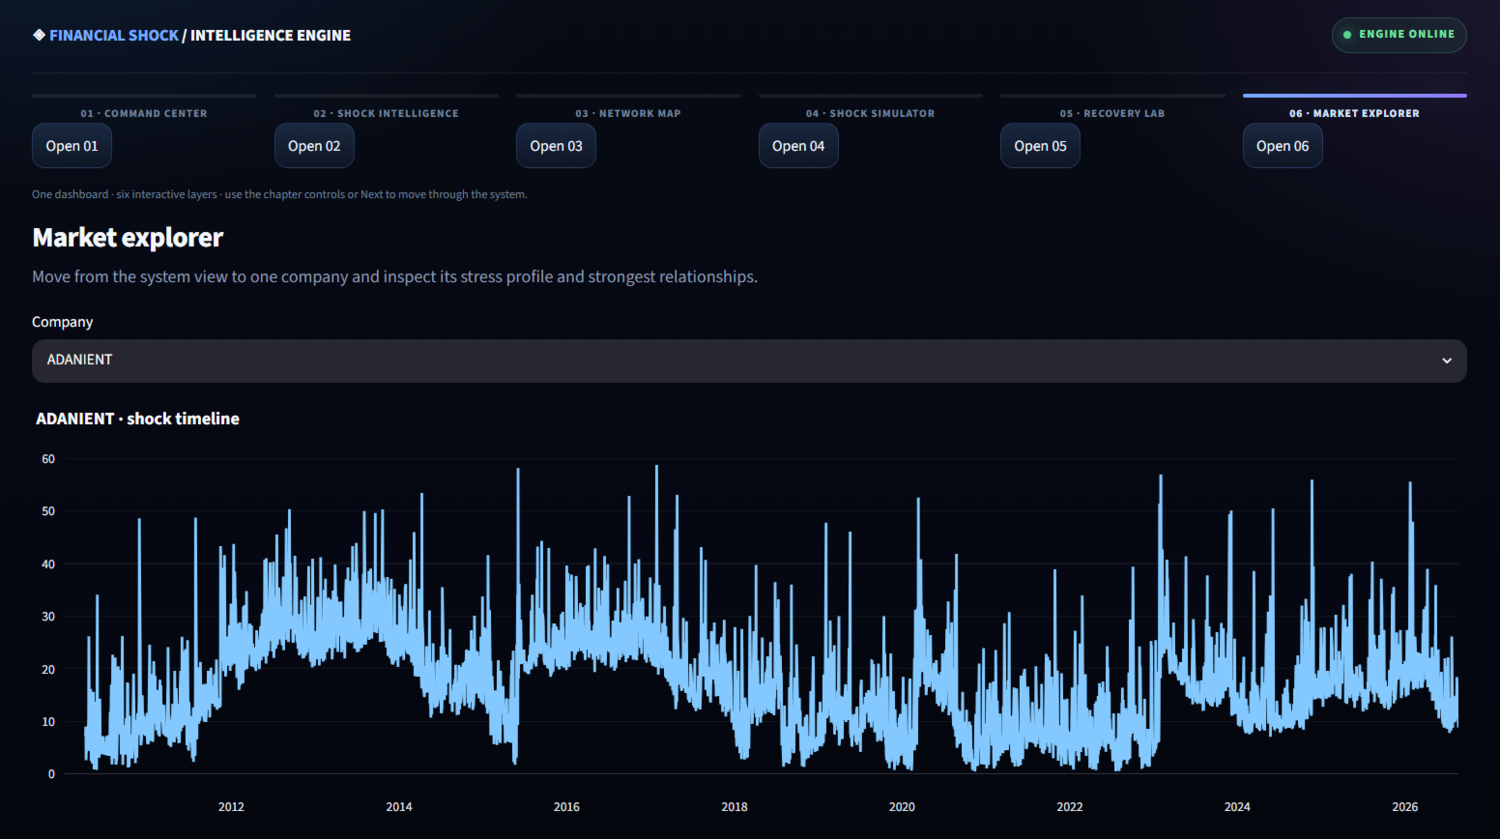
"Market explorer" dashboard featuring a dense historical line chart.
-
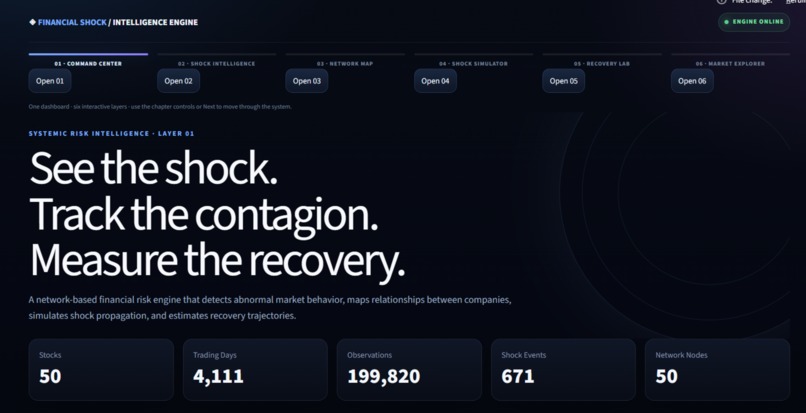
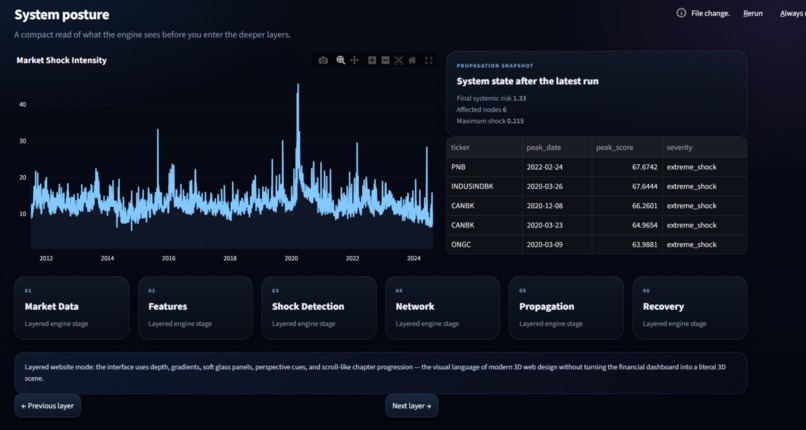
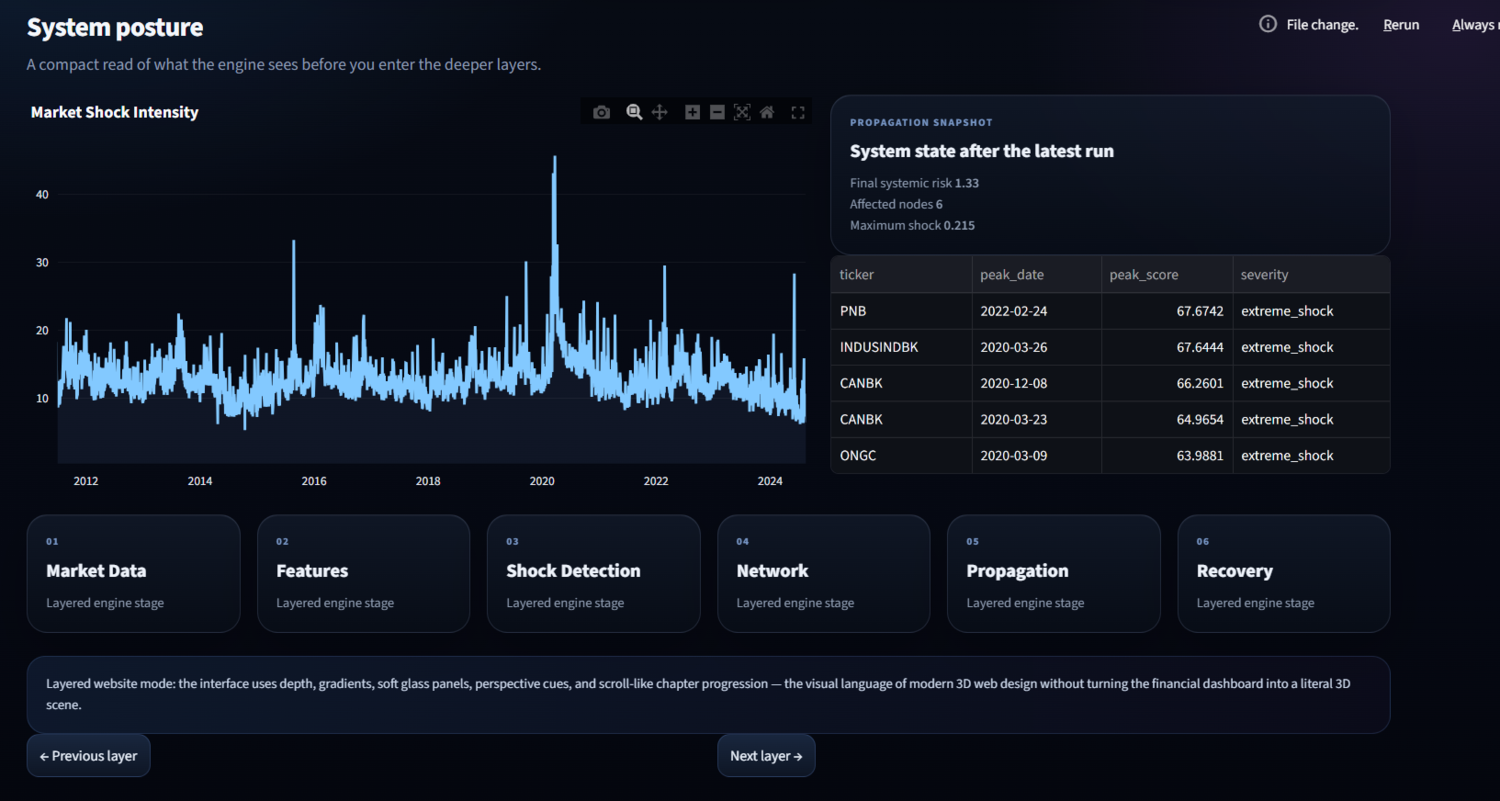
"System posture" dashboard featuring a historical line chart.
-
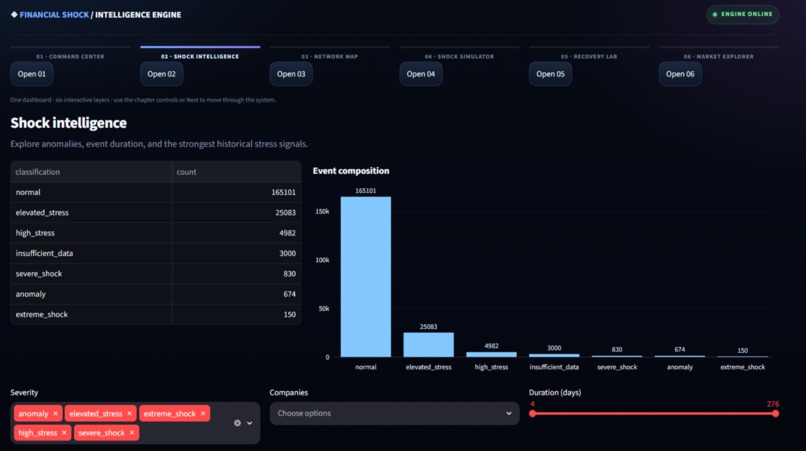
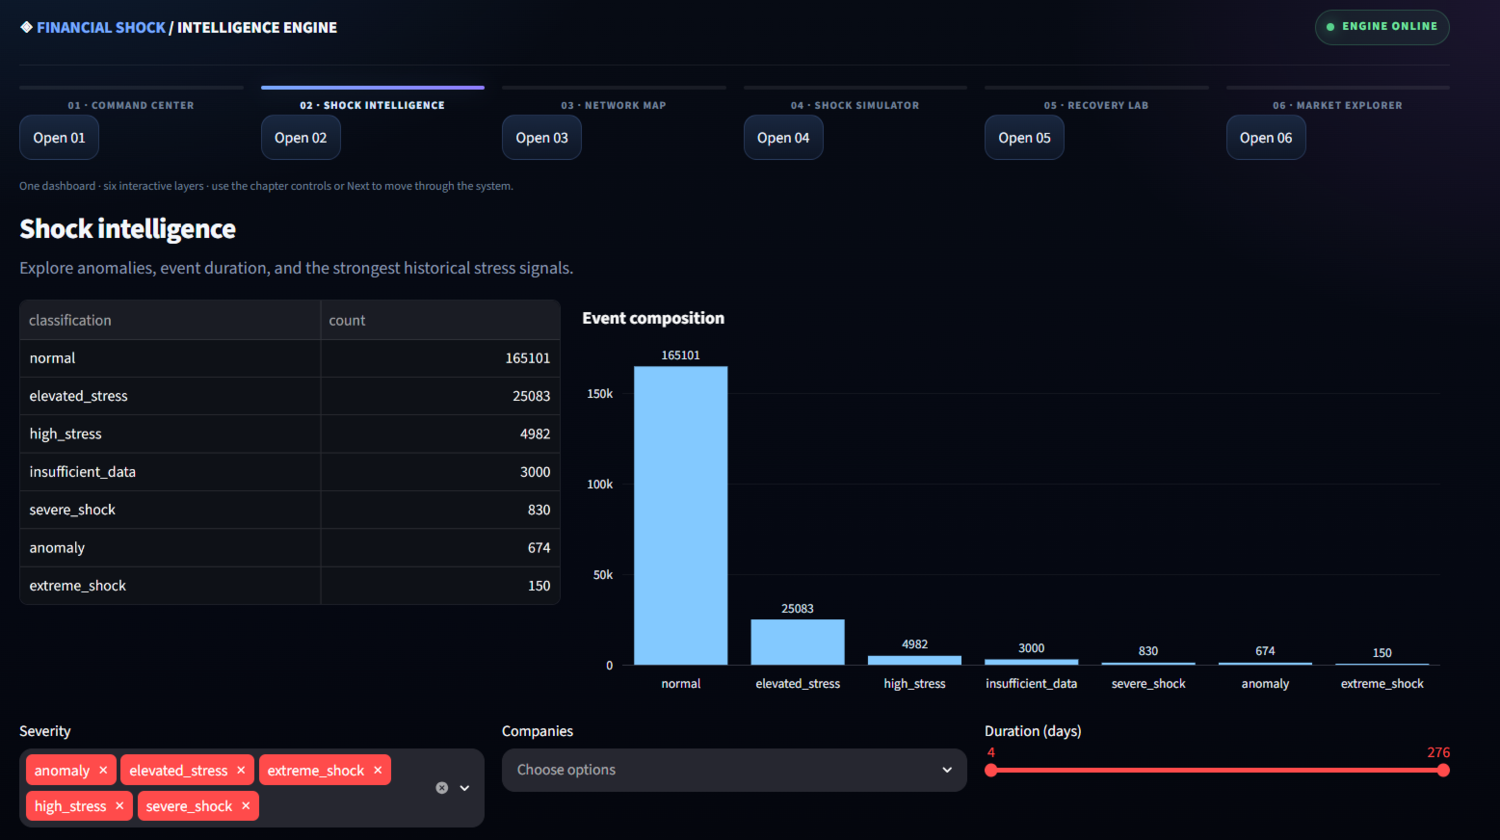
"Shock intelligence" dashboard showing a bar chart of top shock events.
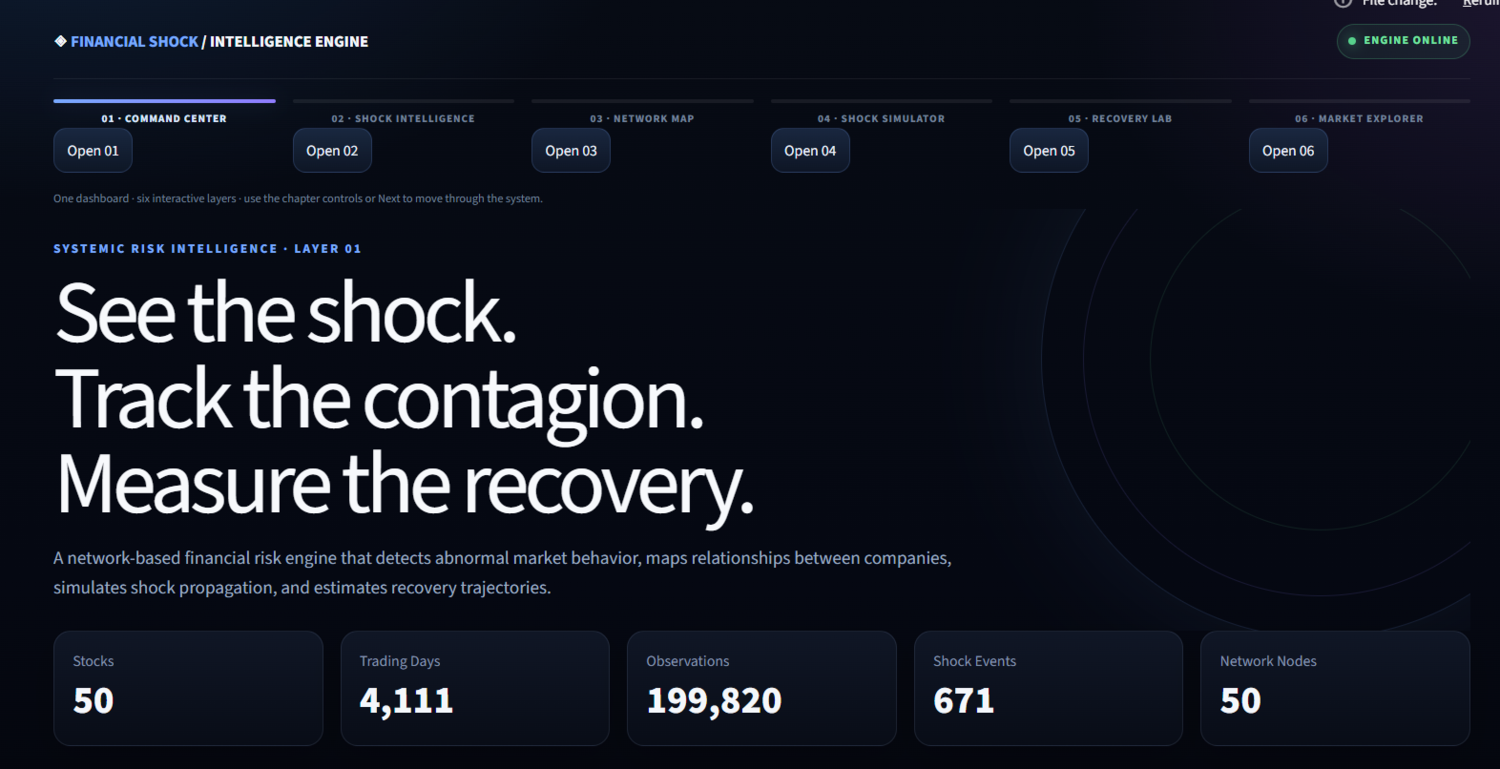
Financial Shock Propagation & Recovery Engine
Inspiration
Financial crises rarely stay isolated.
A company's default can affect its lenders, a banking-sector shock can spread to other industries, and a sudden market crash can trigger a chain reaction across the broader economy. We wanted to build a system that goes beyond simply predicting whether a financial indicator will rise or fall.
Our question was:
What if we could detect a financial shock, understand how it propagates through an interconnected system, measure its severity, and estimate how long recovery could take?
This idea inspired the Financial Shock Propagation & Recovery Engine — an AI-powered system designed to analyze financial stress as a connected, dynamic process rather than as isolated events.
What the Project Does
The system follows a complete pipeline:
Detect → Measure → Propagate → Predict → Recover
It analyzes financial and economic data to identify abnormal events, quantify their severity, model relationships between financial entities and sectors, and estimate the potential impact and recovery trajectory.
The system can provide insights such as:
- Shock Detection — identify unusual movements and potential financial shocks.
- Severity Analysis — estimate how significant a detected shock is.
- Propagation Analysis — model how a shock can spread across interconnected sectors or entities.
- Risk Assessment — identify areas that may be particularly vulnerable.
- Recovery Prediction — estimate the recovery trajectory following a major shock.
- Visualization — present complex financial relationships and risk patterns through an interactive dashboard.
How We Built It
The project combines Data Science, Machine Learning, Time-Series Analysis, Graph Analytics, and Interactive Visualization.
1. Data Collection & Processing
Financial and economic datasets are collected and transformed into a structured format. The preprocessing pipeline handles missing values, normalization, feature engineering, and time-based organization of the data.
2. Shock Detection
We analyze historical patterns to identify abnormal financial behavior.
Instead of treating every price movement as a crisis, the system looks for significant deviations from expected behavior and generates potential shock events.
3. Shock Propagation
The key concept of the project is that financial entities are interconnected.
We represent these relationships as a graph:
          Sector A
         /        \
        ↓          ↓
   Institution B → Sector C
        ↓
   Institution D
        ↓
      Market
Nodes can represent financial entities or sectors, while edges represent relationships or dependencies.
This allows us to study how an initial disturbance can potentially propagate through the network.
4. Risk Scoring
The engine combines different indicators to produce a risk assessment.
A simplified representation is:
$$ Risk = f(Shock\ Severity,\ Exposure,\ Connectivity,\ Volatility) $$
The objective is to transform complex financial information into an interpretable risk signal.
5. Recovery Analysis
Detecting a crisis is only half the problem.
The system also analyzes the post-shock period to understand the recovery trajectory:
Normal
  ↓
Shock
  ↓
Rapid Decline
  ↓
Peak Stress
  ↓
Stabilization
  ↓
Recovery
  ↓
Normal / New Equilibrium
This helps estimate how severe the disruption was and how quickly conditions move toward recovery.
What We Learned
Building this project taught us that financial data is much more complicated than simply predicting a stock price.
We learned how to:
- Work with noisy and time-dependent financial data.
- Engineer meaningful features from raw datasets.
- Detect anomalies and unusual financial behavior.
- Think about financial systems as networks rather than isolated variables.
- Combine machine learning with graph-based reasoning.
- Visualize complex model outputs in an understandable way.
- Build an end-to-end data pipeline instead of focusing only on a model.
- Design a system where predictions can be interpreted rather than treated as a black box.
One of our biggest takeaways was that relationships between financial entities can be just as important as the individual entities themselves.
Challenges We Faced
Data Quality
Financial datasets can contain missing values, inconsistent time intervals, outliers, and changing market conditions. Preparing reliable input data was therefore one of the most important parts of the project.
Modeling Propagation
Predicting how a shock moves through a financial network is significantly harder than predicting a single variable.
A shock can have different effects depending on the strength of relationships, exposure, market conditions, and the existing level of financial stress.
Balancing Complexity and Interpretability
A highly complex model may produce strong predictions but become difficult to understand.
We therefore focused on presenting the results through understandable metrics, risk scores, propagation relationships, and visualizations.
Recovery Is Not Linear
Financial recovery does not necessarily follow a straight line. Markets can stabilize, experience another shock, or enter a new equilibrium.
This made recovery modeling an important and challenging part of the project.
Why It Matters
Traditional financial analysis often focuses on individual assets, companies, or indicators.
Our approach focuses on the system.
Instead of asking only:
"Will this asset fall?"
we want to answer:
"If a shock occurs here, where could it spread, how severe could the impact become, and how might the system recover?"
This perspective can potentially support early-warning systems, financial risk analysis, stress testing, and decision support.
Future Improvements
There are several directions we would like to explore next:
- Real-time financial data integration.
- More advanced Graph Neural Networks (GNNs).
- Scenario-based stress testing.
- Automated intervention simulations.
- Explainable AI for individual risk predictions.
- More sophisticated recovery forecasting.
- Real-time interactive propagation maps.
- Integration of macroeconomic indicators and alternative financial signals.
Final Vision
The long-term vision is to turn the project into a financial resilience simulation platform.
A user could introduce a hypothetical scenario such as:
"What happens if a major financial institution experiences a sudden 30% loss?"
The engine could then simulate the potential propagation of the shock, identify vulnerable parts of the network, estimate systemic risk, and visualize possible recovery paths.
The goal is not simply to predict the next market movement.
The goal is to understand how financial systems react, adapt, and recover when unexpected shocks occur.
Built With
- artificial-intelligence
- contagion-analysis
- data-science
- data-visualization
- financial-analysis
- financial-contagion
- financial-market
- financial-modeling
- financial-risk
- fintech
- graph-analysis
- machine-learning
- market-crash
- network-analysis
- plotly
- predictive-analytics
- python
- recovery-modeling
- risk-intelligence
- risk-management
- shock-propagation
- simulation
- streamlit
- systemic-risk


Log in or sign up for Devpost to join the conversation.