
Inspiration
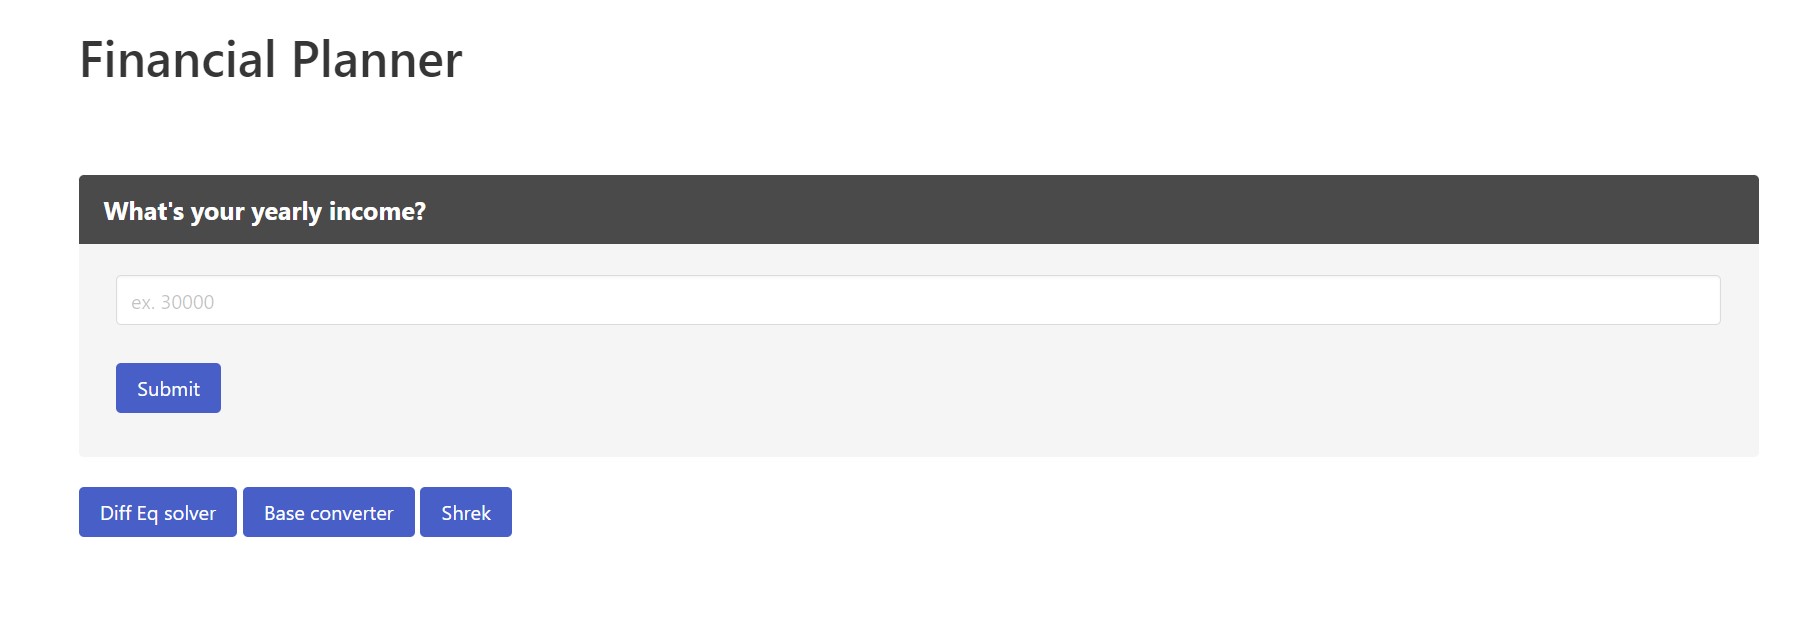
We were inspired to code up a solution for college students to be able to budget during college by putting in their yearly income and being shown a breakdown of how best to budget their money through general financial advice of the percentage breakdown of various categories.
What it does
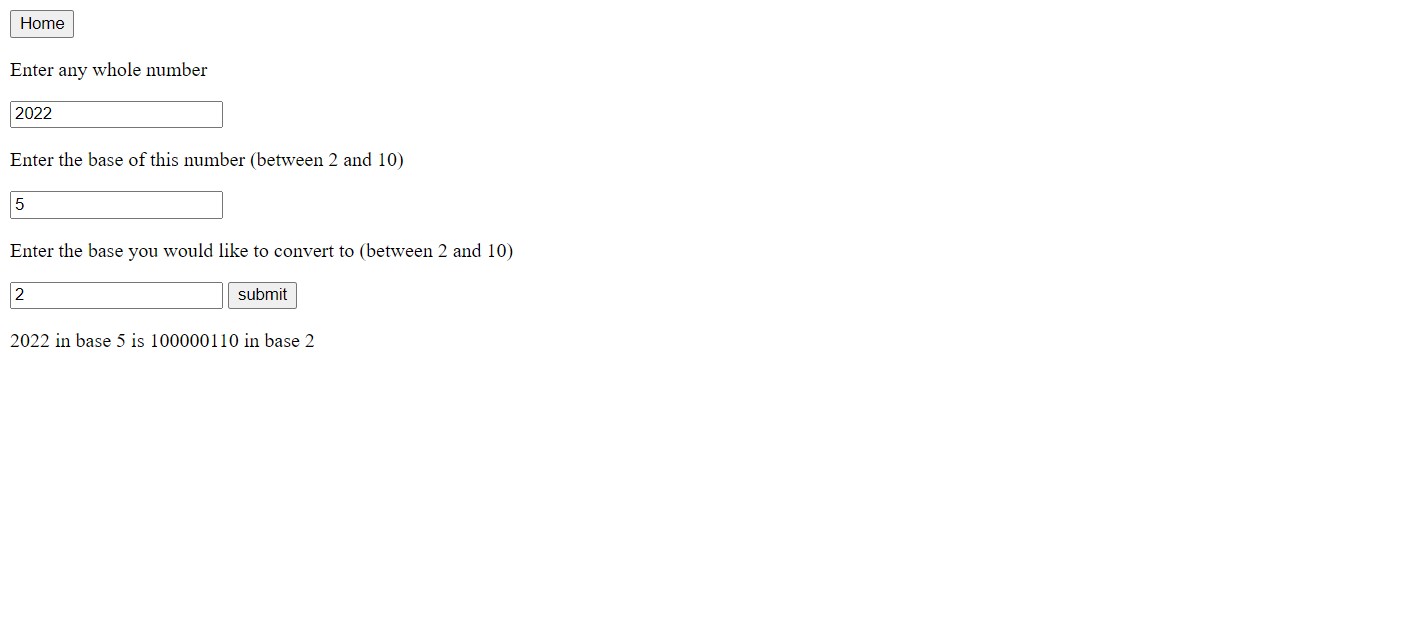
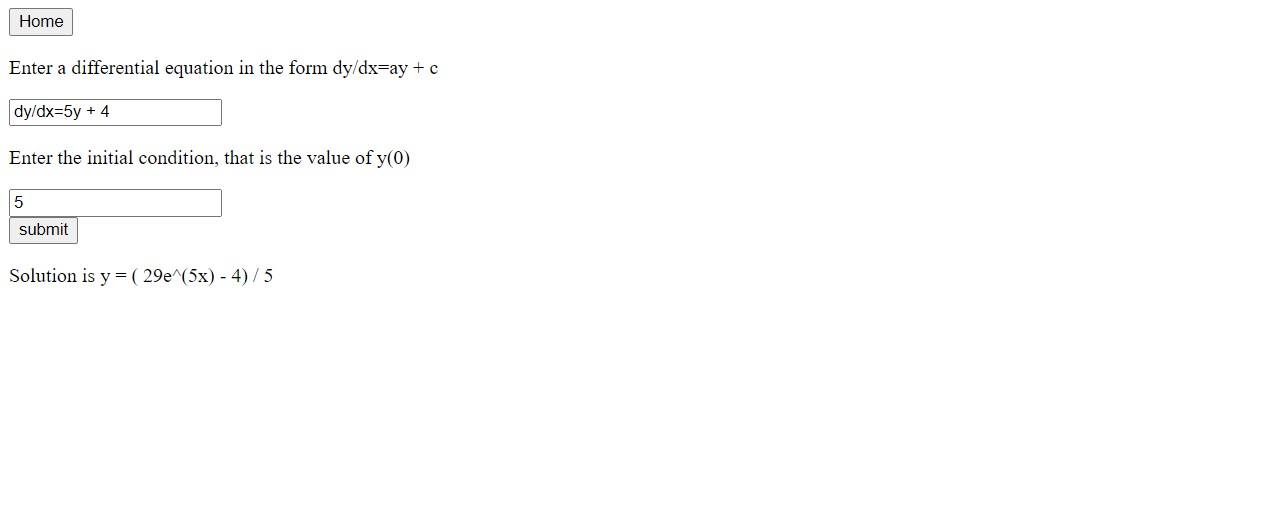
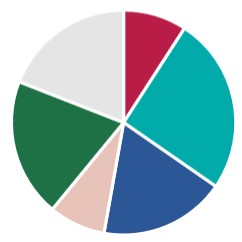
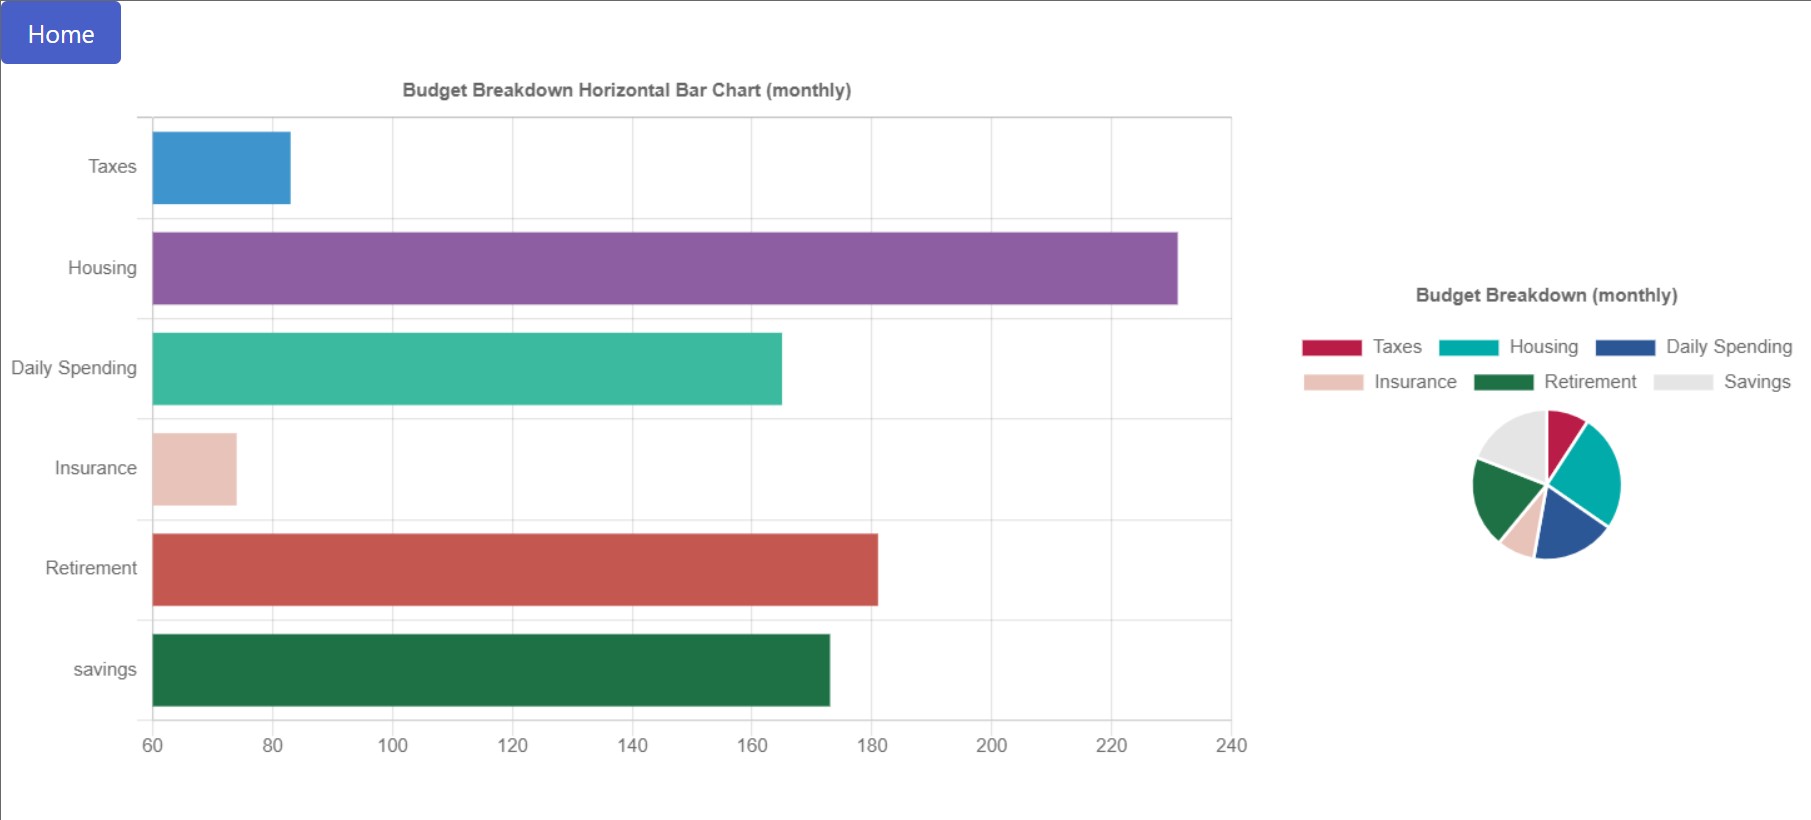
Our project takes in a person's yearly income on the landing page through an input box, takes out taxes based on the U.S.' tax bracket system and then gets recommended percentages for housing, daily spending, insurance, retirement, and savings and shows it through a bar and pie chart to the user on a new page once the submit button is clicked. We also showed our side projects of a differential equations solver, a base converter, and an image of Shrek through buttons that redirected to html pages with those projects.
How we built it
We used some CSS templates from Bulma along with our own basic html and some of our own css to show the front end. We wrote our backend in JavaScript to redirect pages on buttons being clicked as well as using chart.js to show the charts visually to the reader in budget.html. Our side projects of a differential equations solver and base converter was more barebones on the front end with it being a vector to display our knowledge in the backend.
Challenges we ran into
The biggest challenge we ran into was learning how to integrate the front end with the back end for this project. It took us a while to find a workaround for working with an imported js file in order to use it as a script in our budget.html page with values taken from our own js file. We were able to resolve this challenge by using sessionStorage to store the values.
Accomplishments that we're proud of
We are most proud of being able to redirect the users to a new landing page and show the calculated values of our selected categories and their percentage calculation to the user through two charts. We are also proud of being able to add some other back end projects and be able to have a visual showcase of what they do to the user rather than having to just use a console for I/O.
What we learned
We learned that it is a pretty big challenge to integrate the front end and back end efficiently and effectively. The back end and front end by themselves are not that complicated to learn pretty quickly. However, being able to actually have the front end and back end work together is harder than it seems. The biggest thing we learned is how easy it is to barely change the front end and back end in a team and with many people working on it not knowing exactly what broke what was working previously. For instance, we had a chart that could work with static variables for a long time while trying to resolve the dynamic variable problem, but we were hindered extra in our pursuit by breaking the static variable template instead of creating a new project to tinker on in order to always have the static variable state of our project intact and not having to debug and resolve errors we introduced.
What's next for Financial Planner n Stuff
Building out the landing page for people to be able to insert their own categories and percentage or dollar amounts they would like to budget would be a start as well as selecting which charts they would like to see in the budget.html page. For instance, a pie chart is not as useful if the user is inserting percentages as they likely want to see a bar chart of values to get a visualization that way. Having a way for users to insert as many or as few categories as they want would be another challenge to tackle. We would also like to add an investment graph to show how people's savings would increase if invested over time and have the user able to select popular indices to see their historical average or enter their own yearly compounded interest rate.


Log in or sign up for Devpost to join the conversation.