-
-
Financial Analysis Application
Inspiration
As an investor, I was constantly frustrated by the gap between identifying a promising company and making a confident, data-backed investment decision. The process was a manual grind: digging through financial reports, wrestling with spreadsheets, and building complex models from scratch. A single typo could invalidate hours of work. I realized this friction wasn't just an inconvenience; it was a major barrier preventing many investors from performing deep analysis. This project was born from a desire to solve that problem—to build a tool that automates the tedious work, allowing investors to focus on strategy and the final decision, not the manual data entry.
What it does
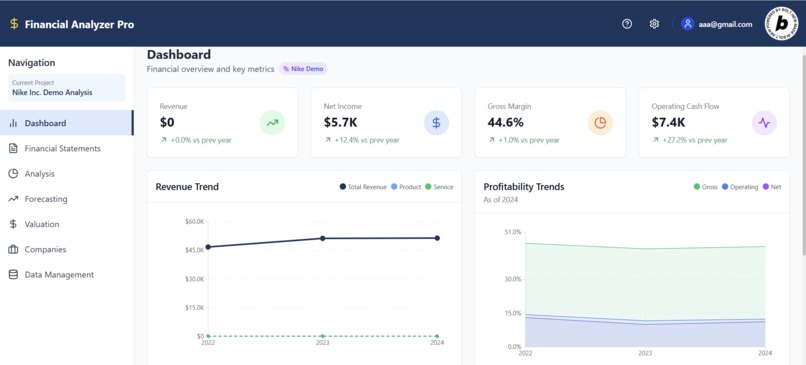
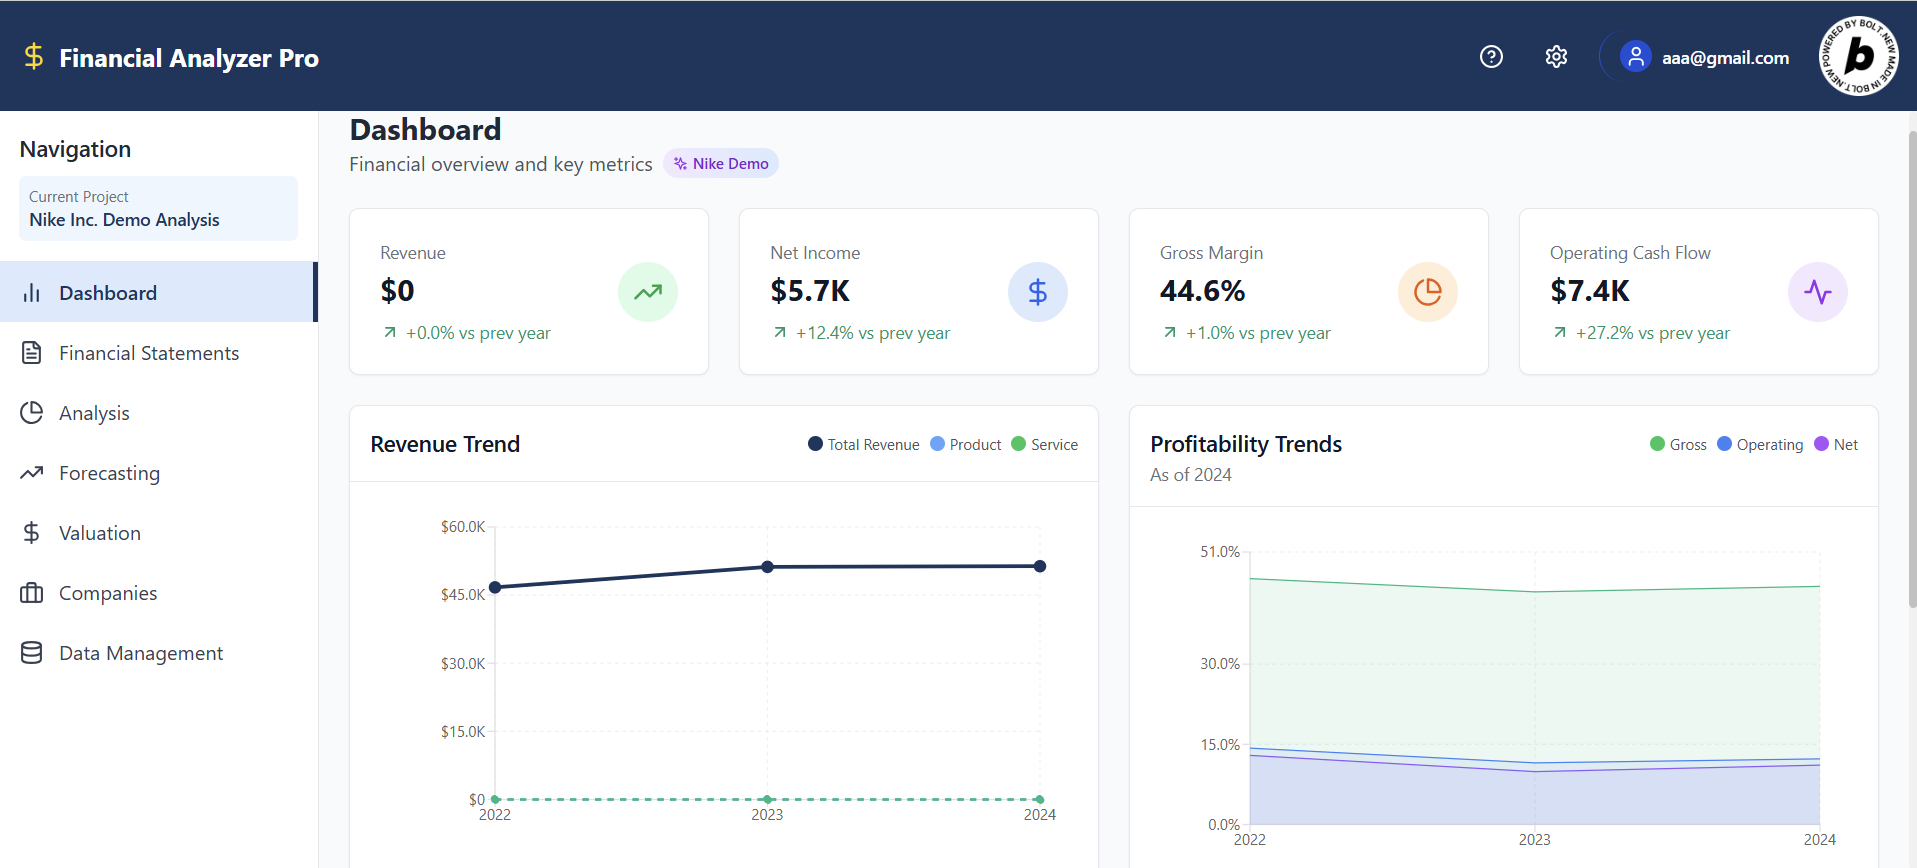
What it does Financial Analyzer Pro is a streamlined platform that transforms raw financial data into a decisive investment analysis. Users input a company's historical data from its Income Statement, Balance Sheet, and Cash Flow Statement. The application then automatically:
1-Structures the data and calculates key financial ratios in real-time. 2-Guides the user through building a comprehensive Discounted Cash Flow (DCF) model. 3-Generates an intrinsic value per share, providing a clear, data-driven basis for a "buy" or "sell" decision. Essentially, it handles the entire analytical workflow, from raw numbers to a final valuation.
How we built it
We built the platform in three distinct phases, mirroring an analyst's workflow:
1-The Foundation: We started by creating an intelligent structure for the three core financial statements. We designed a system that understands the relationships between line items (e.g., how Net Income links to the Balance Sheet and Cash Flow statement), ensuring data integrity from the start.
2-The Analysis Engine: With the foundation in place, we built an automation layer. This engine instantly computes dozens of essential financial ratios (like P/E, Debt-to-Equity, etc.) as data is entered, giving users immediate insights into a company's performance.
3-The Valuation Core: The final phase was building the DCF model. This feature pulls the structured historical data and guides the user through setting assumptions for growth and discount rates to produce a final intrinsic value.
Challenges we ran into
Data Integrity: Our biggest hurdle was preventing the "garbage in, garbage out" problem. We had to build robust validation and cross-checks to ensure the financial statements were always balanced and logically consistent.
Simplifying Complexity: The DCF model is powerful but complex, relying heavily on user assumptions. We worked hard to create a guided experience that is flexible enough for seasoned analysts but intuitive enough for those new to valuation.
Intuitive User Experience: The goal was to make a complex process feel simple. We dedicated significant effort to designing a clean, logical user interface that guides the user from one step to the next seamlessly, without requiring a degree in finance to navigate.
Accomplishments that we're proud of
We are incredibly proud of creating a seamless, end-to-end analysis tool from scratch. Specifically, we're proud of:
1-Automating the entire workflow from raw data to a full DCF valuation, which drastically reduces the time and effort required for analysis. 2-Building an intelligent system that understands the intricate connections between financial statements, ensuring accuracy. 3-Designing an intuitive and clean interface that makes sophisticated financial modeling accessible to a broader audience of investors.
What we learned
This project was a deep dive into both finance and technology. We learned how to deconstruct complex financial models like the DCF into their fundamental components. On the technical side, we learned how to architect a system that could handle the relational nature of financial data, ensuring that a change in one area correctly propagates throughout the model. Most importantly, we learned how to bridge the gap between a powerful tool and a usable product through thoughtful user experience design.
What's next for Financial Analyzer Pro
Our goal is to make this the go-to platform for fundamental analysis. The roadmap includes:
1-Expanding Valuation Models: Integrating other popular valuation methods, such as multiples-based analysis (like P/E, EV/EBITDA) to provide a more comprehensive view of a company's value.
2-Industry Benchmarking: Introducing features that allow users to compare a company's financial ratios and performance metrics against its industry peers, providing crucial context for their analysis.
3-Advanced Charting and Visualization: Adding more dynamic charts and graphs to help users visualize trends and tell a clearer story with the data.
Built With
- css
- database-supabase
- icons-lucide
- management-zustand
- policies
- postgresql)
- react
- rls
- security-supabase
- services-supabase
- styling-tailwind
- tool-vite
- typescript


Log in or sign up for Devpost to join the conversation.