Inspiration:
Business Impact: Growing demand for AI-driven financial analysis tools. Technical Challenges: Data Integration Complex data sourcing from multiple public sources, Opportunity to work with real-world financial data Social Impact: Making complex financial concepts accessible to non-experts, Enabling smaller businesses to make informed decisions
Learnings:
How to deal with a big dataset. How to understand the meanings of each column and how each column correlates with each other. How to think through from a consumer's point of view and then analyze the problem. Understanding and learning about the finance domain. Scrapping of stock market data using Yahoo Api. Building predictive models for financial metrics Making complex data understandable Using tools like Streamlit for user interfaces
Building Process
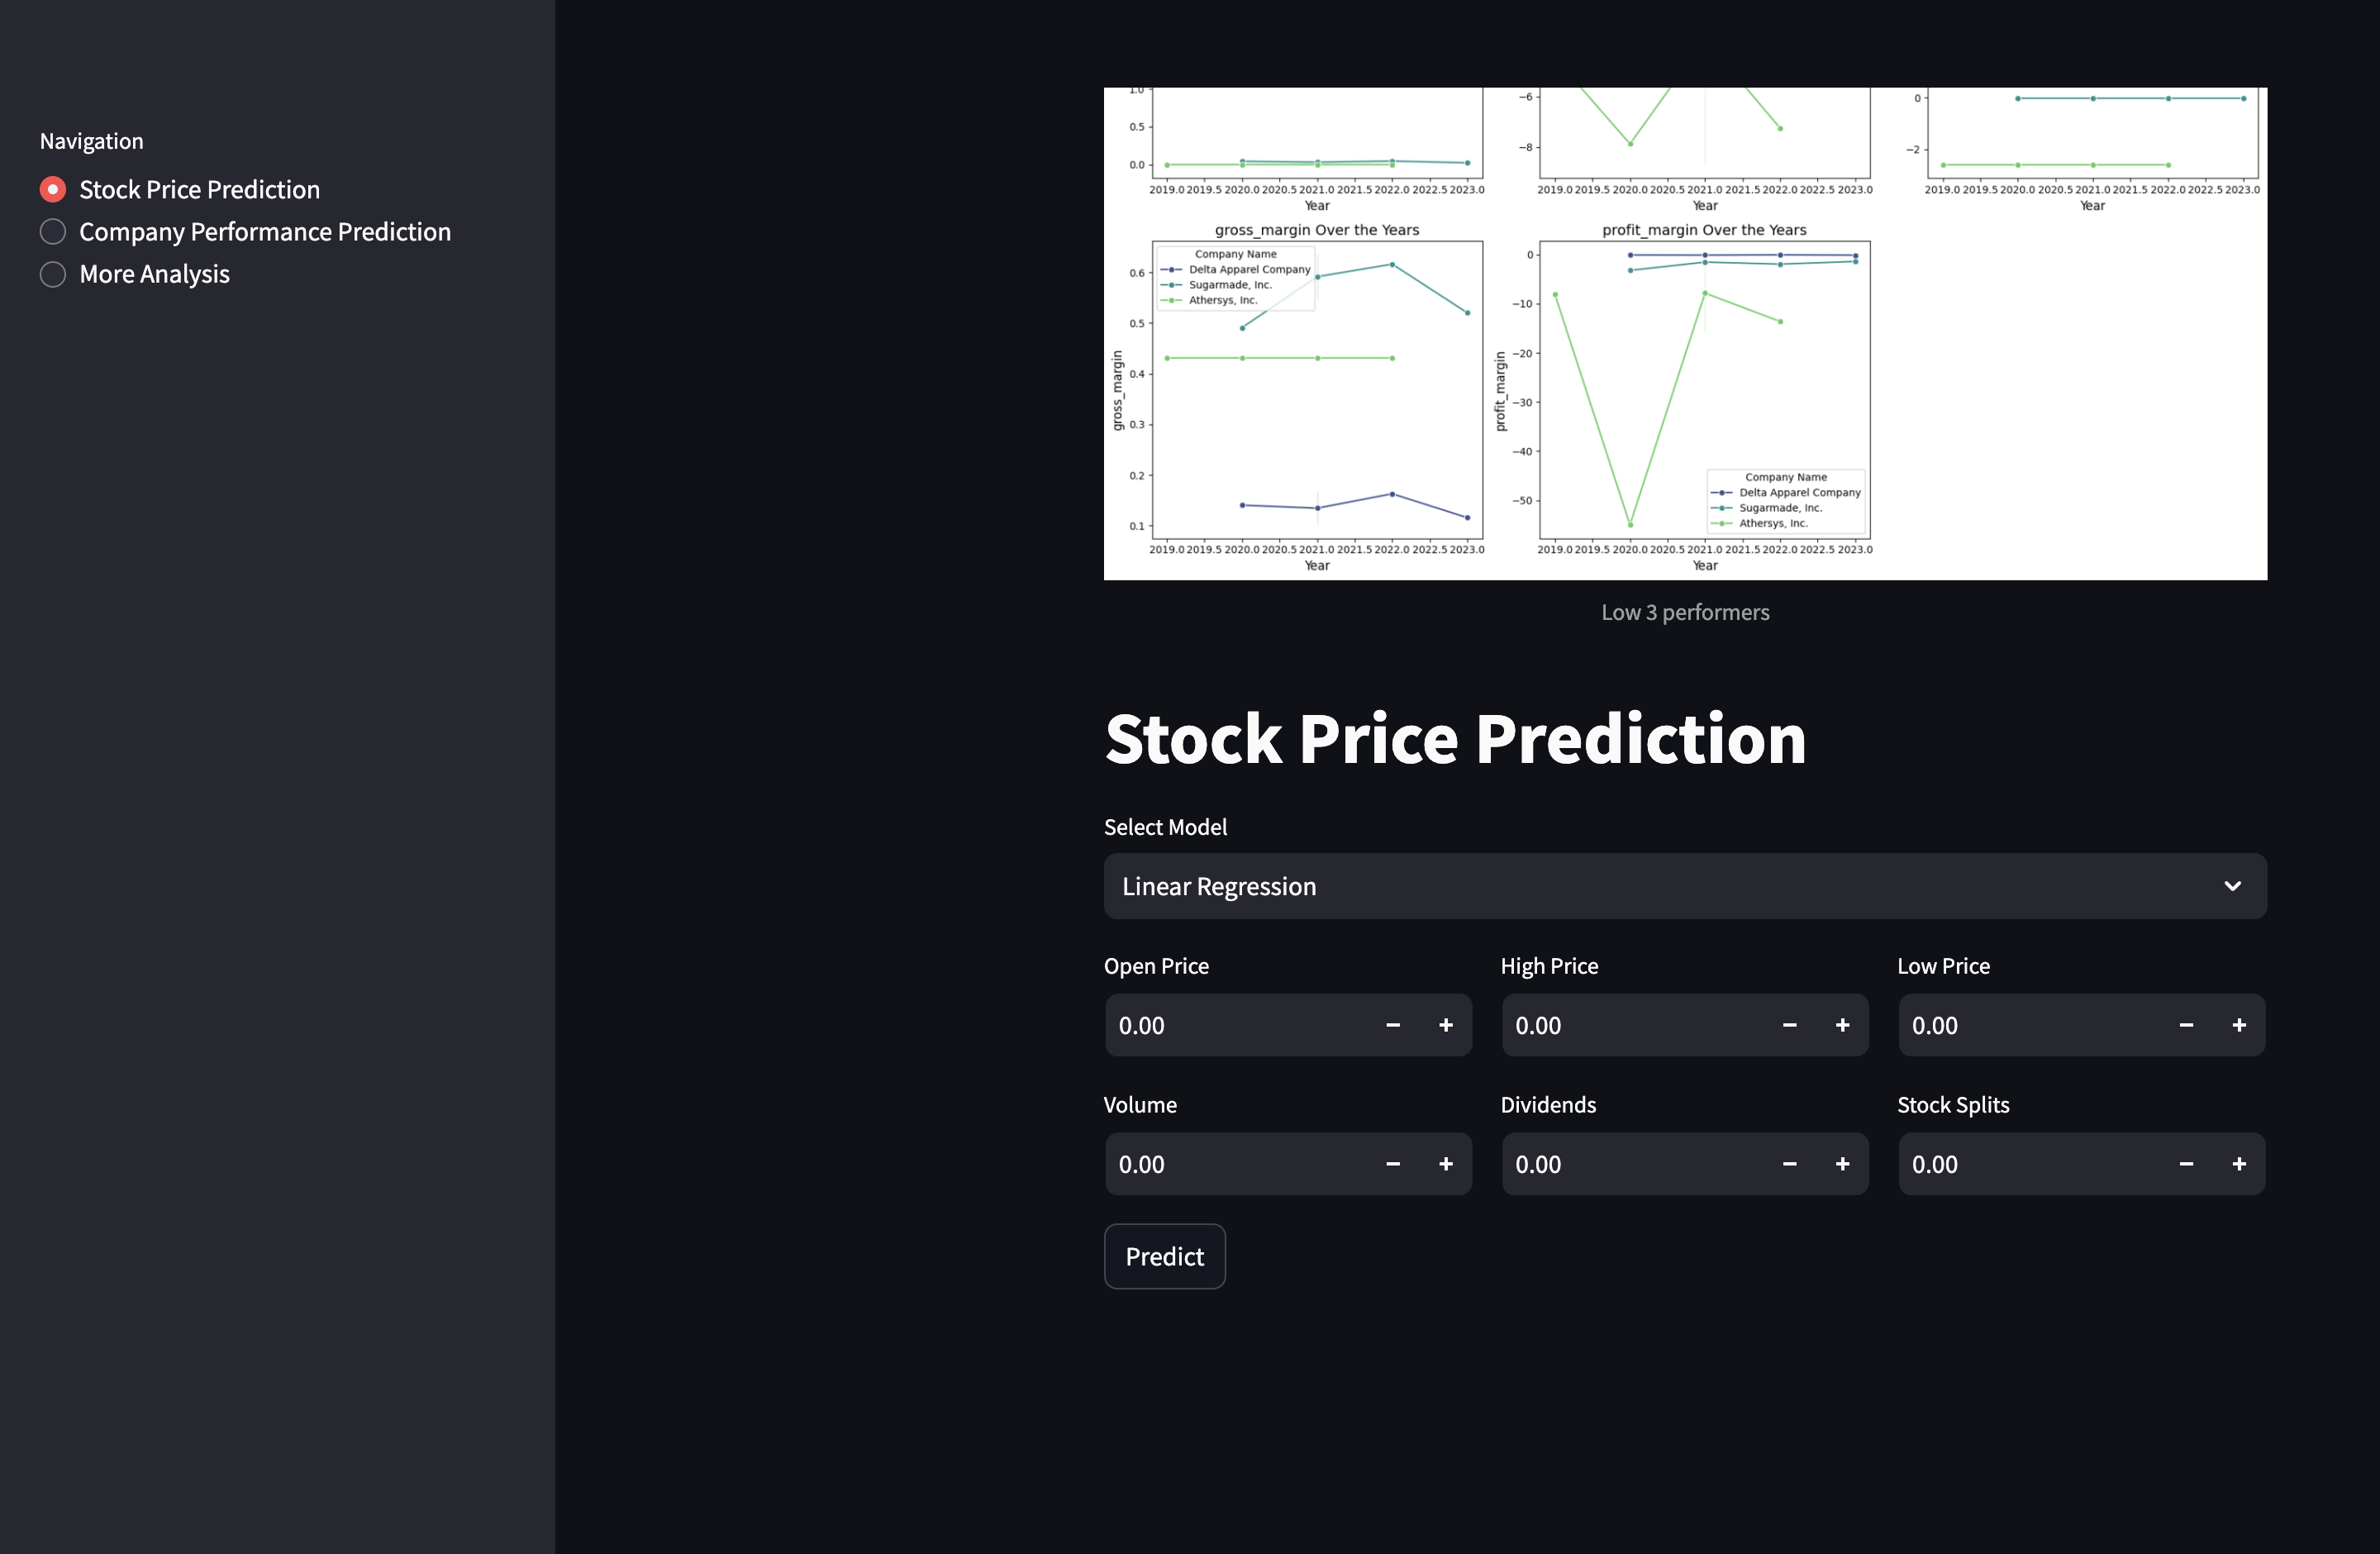
We mainly used Python (Jupyter notebook) for performing a number of tasks: data loading, cleaning, analyzing the problem, making some charts to get insights, building AI models, etc. Used Tableau software to get more interactive and dynamic visualizations. These visualizations helped us get better insights about the data and how the market has performed over a span of the last five years. Used Streamlit to create a user-interface to show the results of our prediction.
Challenges
Our first challenge was acquiring the data from publicly available sources. Given the large volume of data, we dedicated time to efficiently load it and integrate it with two CSV files provided in the datathon. The subsequent key steps focused on data cleanup and addressing missing values. Another big challenge was scraping stock market data using Yahoo Api as it blocks access time and again.

Log in or sign up for Devpost to join the conversation.