Inspiration
Many students and early-career professionals struggle to understand the true cost of a college education and how long it will take to recoup that investment. Rising tuition, housing, and living expenses make it difficult to model payback timelines on a spreadsheet alone, so we built an interactive web tool to visualize these numbers at a glance.
What it does
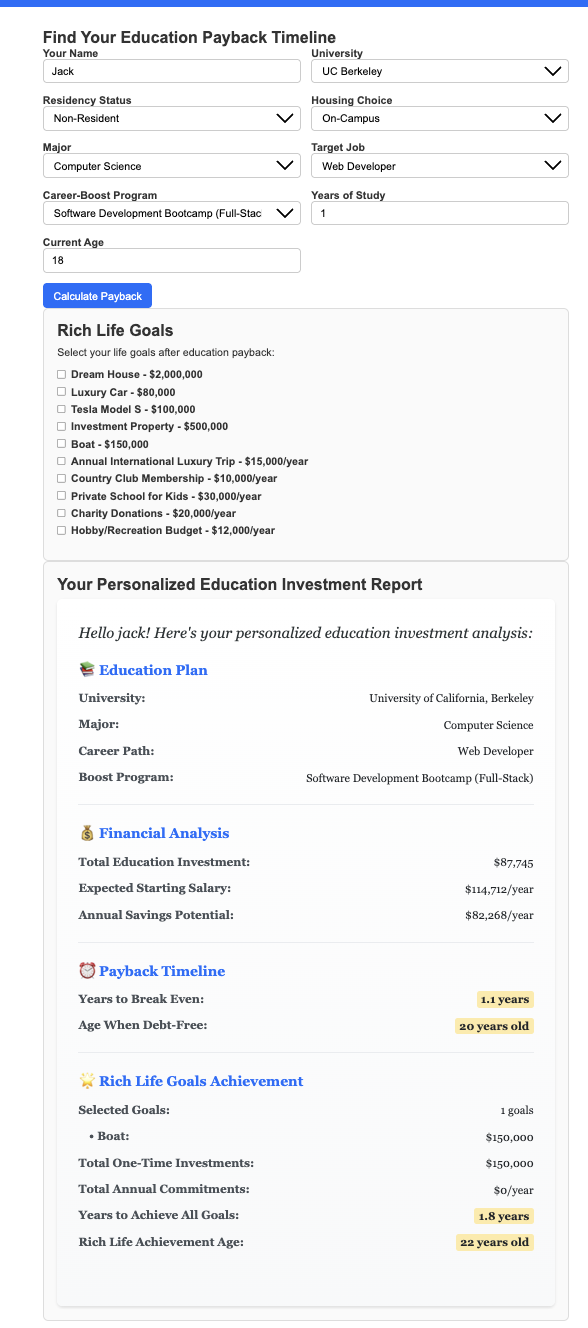
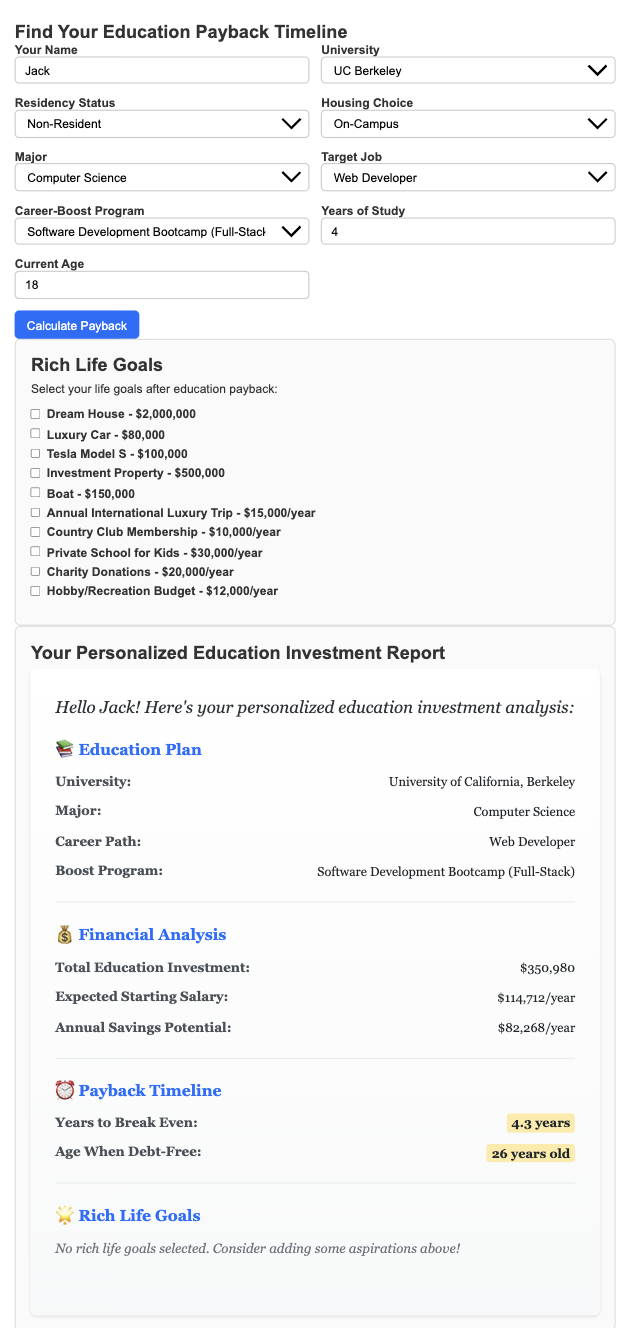
This application lets users select their university, major, housing choice, career path, and optional certification program. It then calculates:
- Total education cost over the chosen years of study (tuition + living expenses)
- Estimated starting salary boost based on major and program
- Annual disposable income after living costs
- Years required to pay back the full education investment
- Age at which the user will break even
All calculations update instantly as inputs change, and results are displayed in a clear, step‑by‑step text breakdown.
How we built it
We used plain HTML, CSS, and vanilla JavaScript for maximum compatibility and simplicity. Key techniques include:
- Dynamic
<select>population from a centralAPP_DATAJSON object - Grid-based CSS layout for a responsive two-column form
- JavaScript event listeners to recalculate on input changes and form submission
- Intl.NumberFormat for consistent currency formatting
- A monospaced
<pre>element to preserve alignment of the results breakdown
Challenges we ran into
- Ensuring every dropdown remained fully clickable and accessible while using a grid layout
- Handling variable data shapes (different numbers of universities, majors, jobs, and programs)
- Keeping formatting tight and readable across desktop and mobile breakpoints
Accomplishments that we're proud of
- A 100% client‑side solution without any external dependencies
- A flexible data model that can be extended with new universities, majors, or certification programs
- Clear, human‑readable output that mirrors real financial planning spreadsheets
What we learned
- How to structure and manage complex form state in vanilla JavaScript
- Best practices for currency and percentage formatting in the browser
- Techniques for building a dynamic, data‑driven UI without frameworks
What's next for Finance Calculator
- Add support for out‑of‑state tuition and scholarship adjustments
- Introduce graphical charts (e.g., payback timeline graph) using a library like Chart.js
- Persist user profiles in localStorage or a backend database
- Enhance mobile responsiveness and theming
- Offer PDF export of calculated results for easy sharing


Log in or sign up for Devpost to join the conversation.